Zip Codes with the Highest Percentage of Population Employed in Administrative & Support Services in Omaha, NE

RELATED REPORTS & OPTIONS

Administrative & Support Services
Population
Families and Households
Female Fertility
Female Fertility (Unmarried)
Race (Community Size)
Race (Percentage)
Ancestry (Community Size)
AfghanAfricanAlbanianAleutAmericanApacheArabArapahoArgentineanArmenianAustralianAustrianBangladeshiBasqueBelgianBhutaneseBlackfeetBolivianBrazilianBritishBulgarianBurmeseCajunCambodianCanadianCarpatho RusynCentral AmericanCentral American IndianCherokeeChickasawChileanChineseChippewaChoctawColombianComancheCosta RicanCreekCroatianCubanCzechCzechoslovakianDanishDominicanDutchEastern EuropeanEcuadorianEgyptianEnglishEthiopianEuropeanFilipinoFinnishFrenchFrench American IndianFrench CanadianGermanGerman RussianGhanaianGreekGuamanian / ChamorroGuatemalanGuyaneseHaitianHonduranHungarianIcelanderIndian (Asian)IndonesianInupiatIranianIraqiIrishIroquoisIsraeliItalianJamaicanJapaneseJordanianKenyanKiowaKoreanLaotianLatvianLebaneseLithuanianLuxembourgerMacedonianMalaysianMexicanMexican American IndianMoroccanNative HawaiianNavajoNicaraguanNigerianNorthern EuropeanNorwegianPakistaniPalestinianPanamanianPennsylvania GermanPeruvianPolishPortuguesePotawatomiPuebloPuerto RicanRomanianRussianSalvadoranSamoanScandinavianScotch-IrishScottishSeminoleSerbianSiouxSlavicSlovakSloveneSomaliSouth AfricanSouth AmericanSpaniardSpanishSri LankanSubsaharan AfricanSudaneseSwedishSwissSyrianThaiTlingit-HaidaTrinidadian and TobagonianTurkishUkrainianVenezuelanVietnameseWelshWest IndianYugoslavianZimbabwean
Ancestry (Percentage)
AfghanAfricanAlbanianAleutAmericanApacheArabArapahoArgentineanArmenianAustralianAustrianBangladeshiBasqueBelgianBhutaneseBlackfeetBolivianBrazilianBritishBulgarianBurmeseCajunCambodianCanadianCarpatho RusynCentral AmericanCentral American IndianCherokeeChickasawChileanChineseChippewaChoctawColombianComancheCosta RicanCreekCroatianCubanCzechCzechoslovakianDanishDominicanDutchEastern EuropeanEcuadorianEgyptianEnglishEthiopianEuropeanFilipinoFinnishFrenchFrench American IndianFrench CanadianGermanGerman RussianGhanaianGreekGuamanian / ChamorroGuatemalanGuyaneseHaitianHonduranHungarianIcelanderIndian (Asian)IndonesianInupiatIranianIraqiIrishIroquoisIsraeliItalianJamaicanJapaneseJordanianKenyanKiowaKoreanLaotianLatvianLebaneseLithuanianLuxembourgerMacedonianMalaysianMexicanMexican American IndianMoroccanNative HawaiianNavajoNicaraguanNigerianNorthern EuropeanNorwegianPakistaniPalestinianPanamanianPennsylvania GermanPeruvianPolishPortuguesePotawatomiPuebloPuerto RicanRomanianRussianSalvadoranSamoanScandinavianScotch-IrishScottishSeminoleSerbianSiouxSlavicSlovakSloveneSomaliSouth AfricanSouth AmericanSpaniardSpanishSri LankanSubsaharan AfricanSudaneseSwedishSwissSyrianThaiTlingit-HaidaTrinidadian and TobagonianTurkishUkrainianVenezuelanVietnameseWelshWest IndianYugoslavianZimbabwean
Immigrant Origin (Total)
AfghanistanAfricaArgentinaAsiaAustraliaBangladeshBarbadosBelarusBosnia and HerzegovinaBrazilBurma / MyanmarCameroonCanadaCaribbeanCentral AmericaChileChinaColombiaCongoCosta RicaCroatiaCubaCzechoslovakiaDominican RepublicEastern AfricaEastern AsiaEastern EuropeEgyptEl SalvadorEnglandEthiopiaEuropeFranceGermanyGhanaGreeceGuatemalaHondurasHong KongHungaryIndiaIndonesiaIranIraqIrelandIsraelItalyJamaicaJapanJordanKazakhstanKenyaKoreaKuwaitLaosLatin AmericaLatviaLithuaniaMalaysiaMexicoMiddle AfricaMoroccoNepalNetherlandsNicaraguaNigeriaNorthern AfricaNorthern EuropeOceaniaPakistanPanamaPeruPhilippinesPolandPortugalRomaniaRussiaSaudi ArabiaScotlandSierra LeoneSomaliaSouth AfricaSouth AmericaSouth Central AsiaSouth Eastern AsiaSouthern EuropeSpainSri LankaSudanSyriaTaiwanThailandTrinidad and TobagoTurkeyUgandaUkraineVenezuelaVietnamWestern AfricaWestern AsiaWestern EuropeZaireZimbabwe
Immigrant Origin (Percentage)
AfghanistanAfricaArgentinaAsiaAustraliaBangladeshBarbadosBelarusBosnia and HerzegovinaBrazilBurma / MyanmarCameroonCanadaCaribbeanCentral AmericaChileChinaColombiaCongoCosta RicaCroatiaCubaCzechoslovakiaDominican RepublicEastern AfricaEastern AsiaEastern EuropeEgyptEl SalvadorEnglandEthiopiaEuropeFranceGermanyGhanaGreeceGuatemalaHondurasHong KongHungaryIndiaIndonesiaIranIraqIrelandIsraelItalyJamaicaJapanJordanKazakhstanKenyaKoreaKuwaitLaosLatin AmericaLatviaLithuaniaMalaysiaMexicoMiddle AfricaMoroccoNepalNetherlandsNicaraguaNigeriaNorthern AfricaNorthern EuropeOceaniaPakistanPanamaPeruPhilippinesPolandPortugalRomaniaRussiaSaudi ArabiaScotlandSierra LeoneSomaliaSouth AfricaSouth AmericaSouth Central AsiaSouth Eastern AsiaSouthern EuropeSpainSri LankaSudanSyriaTaiwanThailandTrinidad and TobagoTurkeyUgandaUkraineVenezuelaVietnamWestern AfricaWestern AsiaWestern EuropeZaireZimbabwe
Income
Income (Families)
Income (Households)
Poverty
Poverty (Families)
Unemployment
Employment Occupations
Employment Industries
Employer Class
Commute Time
Commute Means
School Enrollment
Education by Degree Field
Occupancy
Finances
Physical Characteristics
Omaha
Compare Zip Codes
Comparison Subject

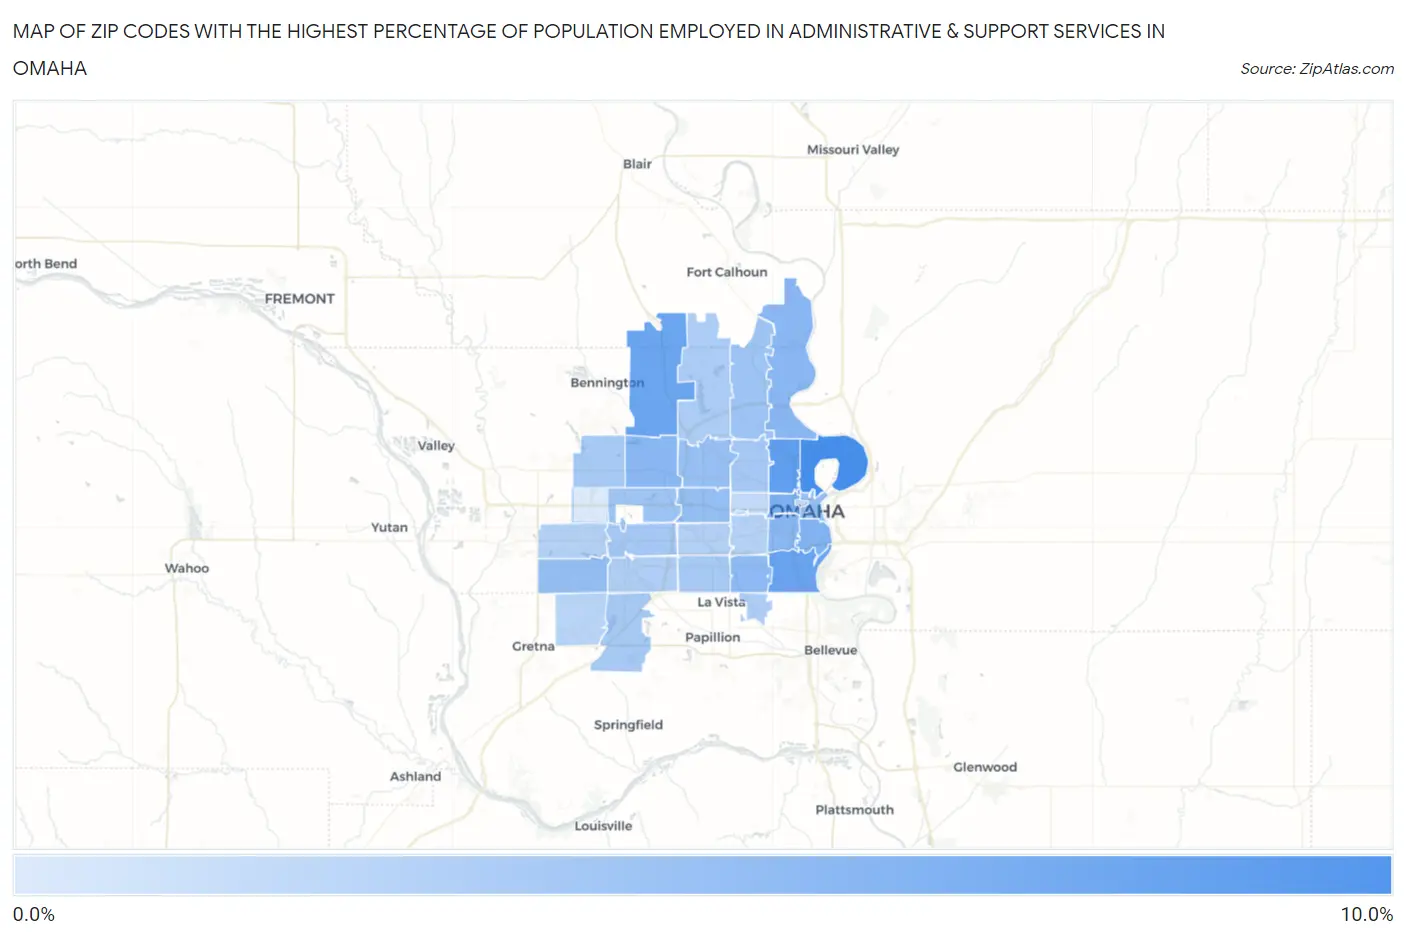
Map of Zip Codes with the Highest Percentage of Population Employed in Administrative & Support Services in Omaha

0.0%
10.0%
Zip Codes with the Highest Percentage of Population Employed in Administrative & Support Services in Omaha Map

Zip Codes with the Highest Percentage of Population Employed in Administrative & Support Services in Omaha, NE

Zip Code % Employed vs State vs National
1.681108.9%3.4%(+5.57)#234.1%(+4.77)#1,732
2.681117.7%3.4%(+4.31)#244.1%(+3.51)#2,538
3.681077.2%3.4%(+3.81)#284.1%(+3.02)#3,010
4.681427.0%3.4%(+3.64)#314.1%(+2.84)#3,231
5.681316.1%3.4%(+2.76)#414.1%(+1.97)#4,566
6.681086.0%3.4%(+2.60)#434.1%(+1.81)#4,865
7.681125.6%3.4%(+2.25)#474.1%(+1.46)#5,574
8.681055.6%3.4%(+2.21)#484.1%(+1.42)#5,663
9.681645.5%3.4%(+2.15)#534.1%(+1.35)#5,851
10.681175.4%3.4%(+2.00)#564.1%(+1.20)#6,186
11.681145.0%3.4%(+1.68)#604.1%(+0.882)#7,020
12.681355.0%3.4%(+1.63)#624.1%(+0.833)#7,159
13.681024.9%3.4%(+1.59)#634.1%(+0.798)#7,254
14.681344.9%3.4%(+1.54)#654.1%(+0.748)#7,416
15.681544.5%3.4%(+1.16)#814.1%(+0.366)#8,674
16.681524.5%3.4%(+1.15)#834.1%(+0.357)#8,694
17.681044.2%3.4%(+0.843)#894.1%(+0.047)#9,836
18.681444.2%3.4%(+0.836)#904.1%(+0.040)#9,865
19.681164.1%3.4%(+0.747)#934.1%(-0.049)#10,238
20.681384.1%3.4%(+0.721)#954.1%(-0.075)#10,359
21.681274.0%3.4%(+0.690)#964.1%(-0.105)#10,496
22.681223.9%3.4%(+0.544)#1074.1%(-0.252)#11,121
23.681573.7%3.4%(+0.338)#1134.1%(-0.458)#12,021
24.681373.7%3.4%(+0.304)#1144.1%(-0.492)#12,200
25.681243.5%3.4%(+0.194)#1234.1%(-0.602)#12,724
26.681303.4%3.4%(+0.052)#1284.1%(-0.744)#13,404
27.681063.3%3.4%(-0.006)#1314.1%(-0.802)#13,698
28.681363.1%3.4%(-0.231)#1534.1%(-1.03)#14,873
29.681322.8%3.4%(-0.507)#1674.1%(-1.30)#16,280
30.681782.5%3.4%(-0.849)#1884.1%(-1.64)#18,112
31.681821.6%3.4%(-1.76)#2674.1%(-2.55)#22,376
32.681181.5%3.4%(-1.84)#2774.1%(-2.64)#22,701

Common Questions

What are the Top 10 Zip Codes with the Highest Percentage of Population Employed in Administrative & Support Services in Omaha, NE?
Top 10 Zip Codes with the Highest Percentage of Population Employed in Administrative & Support Services in Omaha, NE are:
#1
8.9%
#2
7.7%
#3
7.2%
#4
7.0%
#5
6.1%
#6
6.0%
#7
5.6%
#8
5.6%
#9
5.5%
#10
5.4%
What zip code has the Highest Percentage of Population Employed in Administrative & Support Services in Omaha, NE?
68110 has the Highest Percentage of Population Employed in Administrative & Support Services in Omaha, NE with 8.9%.
What is the Percentage of Population Employed in Administrative & Support Services in Omaha, NE?
Percentage of Population Employed in Administrative & Support Services in Omaha is 4.8%.
What is the Percentage of Population Employed in Administrative & Support Services in Nebraska?
Percentage of Population Employed in Administrative & Support Services in Nebraska is 3.4%.
What is the Percentage of Population Employed in Administrative & Support Services in the United States?
Percentage of Population Employed in Administrative & Support Services in the United States is 4.1%.