Zip Codes with the Highest Percentage of Population with a Degree in Business in Omaha, NE

RELATED REPORTS & OPTIONS

Business
Population
Families and Households
Female Fertility
Female Fertility (Unmarried)
Race (Community Size)
Race (Percentage)
Ancestry (Community Size)
AfghanAfricanAlbanianAleutAmericanApacheArabArapahoArgentineanArmenianAustralianAustrianBangladeshiBasqueBelgianBhutaneseBlackfeetBolivianBrazilianBritishBulgarianBurmeseCajunCambodianCanadianCarpatho RusynCentral AmericanCentral American IndianCherokeeChickasawChileanChineseChippewaChoctawColombianComancheCosta RicanCreekCroatianCubanCzechCzechoslovakianDanishDominicanDutchEastern EuropeanEcuadorianEgyptianEnglishEthiopianEuropeanFilipinoFinnishFrenchFrench American IndianFrench CanadianGermanGerman RussianGhanaianGreekGuamanian / ChamorroGuatemalanGuyaneseHaitianHonduranHungarianIcelanderIndian (Asian)IndonesianInupiatIranianIraqiIrishIroquoisIsraeliItalianJamaicanJapaneseJordanianKenyanKiowaKoreanLaotianLatvianLebaneseLithuanianLuxembourgerMacedonianMalaysianMexicanMexican American IndianMoroccanNative HawaiianNavajoNicaraguanNigerianNorthern EuropeanNorwegianPakistaniPalestinianPanamanianPennsylvania GermanPeruvianPolishPortuguesePotawatomiPuebloPuerto RicanRomanianRussianSalvadoranSamoanScandinavianScotch-IrishScottishSeminoleSerbianSiouxSlavicSlovakSloveneSomaliSouth AfricanSouth AmericanSpaniardSpanishSri LankanSubsaharan AfricanSudaneseSwedishSwissSyrianThaiTlingit-HaidaTrinidadian and TobagonianTurkishUkrainianVenezuelanVietnameseWelshWest IndianYugoslavianZimbabwean
Ancestry (Percentage)
AfghanAfricanAlbanianAleutAmericanApacheArabArapahoArgentineanArmenianAustralianAustrianBangladeshiBasqueBelgianBhutaneseBlackfeetBolivianBrazilianBritishBulgarianBurmeseCajunCambodianCanadianCarpatho RusynCentral AmericanCentral American IndianCherokeeChickasawChileanChineseChippewaChoctawColombianComancheCosta RicanCreekCroatianCubanCzechCzechoslovakianDanishDominicanDutchEastern EuropeanEcuadorianEgyptianEnglishEthiopianEuropeanFilipinoFinnishFrenchFrench American IndianFrench CanadianGermanGerman RussianGhanaianGreekGuamanian / ChamorroGuatemalanGuyaneseHaitianHonduranHungarianIcelanderIndian (Asian)IndonesianInupiatIranianIraqiIrishIroquoisIsraeliItalianJamaicanJapaneseJordanianKenyanKiowaKoreanLaotianLatvianLebaneseLithuanianLuxembourgerMacedonianMalaysianMexicanMexican American IndianMoroccanNative HawaiianNavajoNicaraguanNigerianNorthern EuropeanNorwegianPakistaniPalestinianPanamanianPennsylvania GermanPeruvianPolishPortuguesePotawatomiPuebloPuerto RicanRomanianRussianSalvadoranSamoanScandinavianScotch-IrishScottishSeminoleSerbianSiouxSlavicSlovakSloveneSomaliSouth AfricanSouth AmericanSpaniardSpanishSri LankanSubsaharan AfricanSudaneseSwedishSwissSyrianThaiTlingit-HaidaTrinidadian and TobagonianTurkishUkrainianVenezuelanVietnameseWelshWest IndianYugoslavianZimbabwean
Immigrant Origin (Total)
AfghanistanAfricaArgentinaAsiaAustraliaBangladeshBarbadosBelarusBosnia and HerzegovinaBrazilBurma / MyanmarCameroonCanadaCaribbeanCentral AmericaChileChinaColombiaCongoCosta RicaCroatiaCubaCzechoslovakiaDominican RepublicEastern AfricaEastern AsiaEastern EuropeEgyptEl SalvadorEnglandEthiopiaEuropeFranceGermanyGhanaGreeceGuatemalaHondurasHong KongHungaryIndiaIndonesiaIranIraqIrelandIsraelItalyJamaicaJapanJordanKazakhstanKenyaKoreaKuwaitLaosLatin AmericaLatviaLithuaniaMalaysiaMexicoMiddle AfricaMoroccoNepalNetherlandsNicaraguaNigeriaNorthern AfricaNorthern EuropeOceaniaPakistanPanamaPeruPhilippinesPolandPortugalRomaniaRussiaSaudi ArabiaScotlandSierra LeoneSomaliaSouth AfricaSouth AmericaSouth Central AsiaSouth Eastern AsiaSouthern EuropeSpainSri LankaSudanSyriaTaiwanThailandTrinidad and TobagoTurkeyUgandaUkraineVenezuelaVietnamWestern AfricaWestern AsiaWestern EuropeZaireZimbabwe
Immigrant Origin (Percentage)
AfghanistanAfricaArgentinaAsiaAustraliaBangladeshBarbadosBelarusBosnia and HerzegovinaBrazilBurma / MyanmarCameroonCanadaCaribbeanCentral AmericaChileChinaColombiaCongoCosta RicaCroatiaCubaCzechoslovakiaDominican RepublicEastern AfricaEastern AsiaEastern EuropeEgyptEl SalvadorEnglandEthiopiaEuropeFranceGermanyGhanaGreeceGuatemalaHondurasHong KongHungaryIndiaIndonesiaIranIraqIrelandIsraelItalyJamaicaJapanJordanKazakhstanKenyaKoreaKuwaitLaosLatin AmericaLatviaLithuaniaMalaysiaMexicoMiddle AfricaMoroccoNepalNetherlandsNicaraguaNigeriaNorthern AfricaNorthern EuropeOceaniaPakistanPanamaPeruPhilippinesPolandPortugalRomaniaRussiaSaudi ArabiaScotlandSierra LeoneSomaliaSouth AfricaSouth AmericaSouth Central AsiaSouth Eastern AsiaSouthern EuropeSpainSri LankaSudanSyriaTaiwanThailandTrinidad and TobagoTurkeyUgandaUkraineVenezuelaVietnamWestern AfricaWestern AsiaWestern EuropeZaireZimbabwe
Income
Income (Families)
Income (Households)
Poverty
Poverty (Families)
Unemployment
Employment Occupations
Employment Industries
Employer Class
Commute Time
Commute Means
School Enrollment
Education by Degree Field
Occupancy
Finances
Physical Characteristics
Omaha
Compare Zip Codes
Comparison Subject

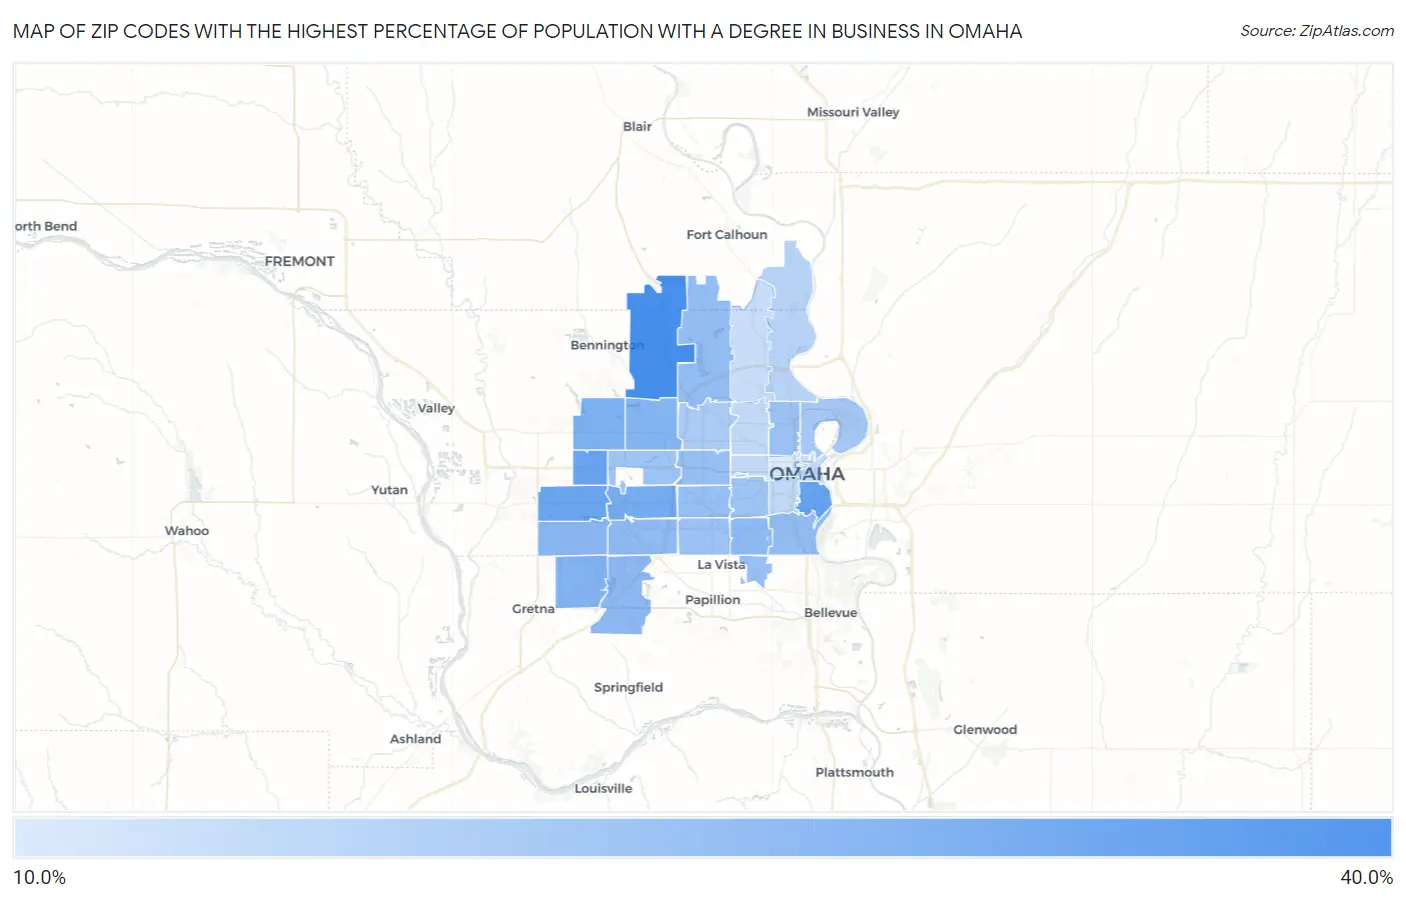
Map of Zip Codes with the Highest Percentage of Population with a Degree in Business in Omaha

0.0%
40.0%
Zip Codes with the Highest Percentage of Population with a Degree in Business in Omaha Map

Zip Codes with the Highest Percentage of Population with a Degree in Business in Omaha, NE

Zip Code % Graduates vs State vs National
1.6814233.8%21.1%(+12.7)#4119.5%(+14.3)#1,918
2.6810829.3%21.1%(+8.24)#6219.5%(+9.80)#3,089
3.6811828.4%21.1%(+7.34)#7219.5%(+8.90)#3,477
4.6813028.1%21.1%(+7.02)#7819.5%(+8.58)#3,637
5.6814426.6%21.1%(+5.51)#9319.5%(+7.07)#4,490
6.6811625.4%21.1%(+4.38)#10919.5%(+5.94)#5,303
7.6816424.6%21.1%(+3.50)#12119.5%(+5.06)#6,070
8.6813624.5%21.1%(+3.49)#12219.5%(+5.04)#6,086
9.6813523.7%21.1%(+2.64)#13619.5%(+4.20)#6,913
10.6813823.2%21.1%(+2.17)#14119.5%(+3.73)#7,424
11.6813723.1%21.1%(+2.05)#14319.5%(+3.61)#7,533
12.6811723.0%21.1%(+1.94)#14719.5%(+3.50)#7,657
13.6812222.5%21.1%(+1.43)#15419.5%(+2.99)#8,208
14.6810722.2%21.1%(+1.15)#16019.5%(+2.70)#8,560
15.6811421.8%21.1%(+0.723)#16619.5%(+2.28)#9,108
16.6815721.6%21.1%(+0.585)#17219.5%(+2.14)#9,271
17.6812421.6%21.1%(+0.562)#17319.5%(+2.12)#9,311
18.6812721.0%21.1%(-0.043)#18319.5%(+1.52)#10,137
19.6811120.9%21.1%(-0.124)#18719.5%(+1.43)#10,235
20.6815420.8%21.1%(-0.269)#19219.5%(+1.29)#10,463
21.6810620.7%21.1%(-0.391)#19819.5%(+1.17)#10,654
22.6811019.8%21.1%(-1.28)#21519.5%(+0.281)#11,950
23.6813419.1%21.1%(-1.95)#23519.5%(-0.394)#12,976
24.6811217.2%21.1%(-3.84)#26919.5%(-2.29)#15,785
25.6810516.3%21.1%(-4.79)#29019.5%(-3.23)#17,229
26.6813215.9%21.1%(-5.18)#29819.5%(-3.62)#17,757
27.6810415.7%21.1%(-5.32)#29919.5%(-3.76)#17,946
28.6810215.5%21.1%(-5.60)#31219.5%(-4.04)#18,331
29.6815215.1%21.1%(-6.00)#32219.5%(-4.44)#18,892
30.6813112.2%21.1%(-8.88)#37519.5%(-7.32)#22,307

Common Questions

What are the Top 10 Zip Codes with the Highest Percentage of Population with a Degree in Business in Omaha, NE?
Top 10 Zip Codes with the Highest Percentage of Population with a Degree in Business in Omaha, NE are:
#1
33.8%
#2
29.3%
#3
28.4%
#4
28.1%
#5
26.6%
#6
25.4%
#7
24.6%
#8
24.5%
#9
23.7%
#10
23.2%
What zip code has the Highest Percentage of Population with a Degree in Business in Omaha, NE?
68142 has the Highest Percentage of Population with a Degree in Business in Omaha, NE with 33.8%.
What is the Percentage of Population with a Degree in Business in Omaha, NE?
Percentage of Population with a Degree in Business in Omaha is 21.9%.
What is the Percentage of Population with a Degree in Business in Nebraska?
Percentage of Population with a Degree in Business in Nebraska is 21.1%.
What is the Percentage of Population with a Degree in Business in the United States?
Percentage of Population with a Degree in Business in the United States is 19.5%.