Zip Codes with the Highest Percentage of Population Employed in Food Preparation & Serving in Omaha, NE

RELATED REPORTS & OPTIONS

Food Preparation & Serving
Population
Families and Households
Female Fertility
Female Fertility (Unmarried)
Race (Community Size)
Race (Percentage)
Ancestry (Community Size)
AfghanAfricanAlbanianAleutAmericanApacheArabArapahoArgentineanArmenianAustralianAustrianBangladeshiBasqueBelgianBhutaneseBlackfeetBolivianBrazilianBritishBulgarianBurmeseCajunCambodianCanadianCarpatho RusynCentral AmericanCentral American IndianCherokeeChickasawChileanChineseChippewaChoctawColombianComancheCosta RicanCreekCroatianCubanCzechCzechoslovakianDanishDominicanDutchEastern EuropeanEcuadorianEgyptianEnglishEthiopianEuropeanFilipinoFinnishFrenchFrench American IndianFrench CanadianGermanGerman RussianGhanaianGreekGuamanian / ChamorroGuatemalanGuyaneseHaitianHonduranHungarianIcelanderIndian (Asian)IndonesianInupiatIranianIraqiIrishIroquoisIsraeliItalianJamaicanJapaneseJordanianKenyanKiowaKoreanLaotianLatvianLebaneseLithuanianLuxembourgerMacedonianMalaysianMexicanMexican American IndianMoroccanNative HawaiianNavajoNicaraguanNigerianNorthern EuropeanNorwegianPakistaniPalestinianPanamanianPennsylvania GermanPeruvianPolishPortuguesePotawatomiPuebloPuerto RicanRomanianRussianSalvadoranSamoanScandinavianScotch-IrishScottishSeminoleSerbianSiouxSlavicSlovakSloveneSomaliSouth AfricanSouth AmericanSpaniardSpanishSri LankanSubsaharan AfricanSudaneseSwedishSwissSyrianThaiTlingit-HaidaTrinidadian and TobagonianTurkishUkrainianVenezuelanVietnameseWelshWest IndianYugoslavianZimbabwean
Ancestry (Percentage)
AfghanAfricanAlbanianAleutAmericanApacheArabArapahoArgentineanArmenianAustralianAustrianBangladeshiBasqueBelgianBhutaneseBlackfeetBolivianBrazilianBritishBulgarianBurmeseCajunCambodianCanadianCarpatho RusynCentral AmericanCentral American IndianCherokeeChickasawChileanChineseChippewaChoctawColombianComancheCosta RicanCreekCroatianCubanCzechCzechoslovakianDanishDominicanDutchEastern EuropeanEcuadorianEgyptianEnglishEthiopianEuropeanFilipinoFinnishFrenchFrench American IndianFrench CanadianGermanGerman RussianGhanaianGreekGuamanian / ChamorroGuatemalanGuyaneseHaitianHonduranHungarianIcelanderIndian (Asian)IndonesianInupiatIranianIraqiIrishIroquoisIsraeliItalianJamaicanJapaneseJordanianKenyanKiowaKoreanLaotianLatvianLebaneseLithuanianLuxembourgerMacedonianMalaysianMexicanMexican American IndianMoroccanNative HawaiianNavajoNicaraguanNigerianNorthern EuropeanNorwegianPakistaniPalestinianPanamanianPennsylvania GermanPeruvianPolishPortuguesePotawatomiPuebloPuerto RicanRomanianRussianSalvadoranSamoanScandinavianScotch-IrishScottishSeminoleSerbianSiouxSlavicSlovakSloveneSomaliSouth AfricanSouth AmericanSpaniardSpanishSri LankanSubsaharan AfricanSudaneseSwedishSwissSyrianThaiTlingit-HaidaTrinidadian and TobagonianTurkishUkrainianVenezuelanVietnameseWelshWest IndianYugoslavianZimbabwean
Immigrant Origin (Total)
AfghanistanAfricaArgentinaAsiaAustraliaBangladeshBarbadosBelarusBosnia and HerzegovinaBrazilBurma / MyanmarCameroonCanadaCaribbeanCentral AmericaChileChinaColombiaCongoCosta RicaCroatiaCubaCzechoslovakiaDominican RepublicEastern AfricaEastern AsiaEastern EuropeEgyptEl SalvadorEnglandEthiopiaEuropeFranceGermanyGhanaGreeceGuatemalaHondurasHong KongHungaryIndiaIndonesiaIranIraqIrelandIsraelItalyJamaicaJapanJordanKazakhstanKenyaKoreaKuwaitLaosLatin AmericaLatviaLithuaniaMalaysiaMexicoMiddle AfricaMoroccoNepalNetherlandsNicaraguaNigeriaNorthern AfricaNorthern EuropeOceaniaPakistanPanamaPeruPhilippinesPolandPortugalRomaniaRussiaSaudi ArabiaScotlandSierra LeoneSomaliaSouth AfricaSouth AmericaSouth Central AsiaSouth Eastern AsiaSouthern EuropeSpainSri LankaSudanSyriaTaiwanThailandTrinidad and TobagoTurkeyUgandaUkraineVenezuelaVietnamWestern AfricaWestern AsiaWestern EuropeZaireZimbabwe
Immigrant Origin (Percentage)
AfghanistanAfricaArgentinaAsiaAustraliaBangladeshBarbadosBelarusBosnia and HerzegovinaBrazilBurma / MyanmarCameroonCanadaCaribbeanCentral AmericaChileChinaColombiaCongoCosta RicaCroatiaCubaCzechoslovakiaDominican RepublicEastern AfricaEastern AsiaEastern EuropeEgyptEl SalvadorEnglandEthiopiaEuropeFranceGermanyGhanaGreeceGuatemalaHondurasHong KongHungaryIndiaIndonesiaIranIraqIrelandIsraelItalyJamaicaJapanJordanKazakhstanKenyaKoreaKuwaitLaosLatin AmericaLatviaLithuaniaMalaysiaMexicoMiddle AfricaMoroccoNepalNetherlandsNicaraguaNigeriaNorthern AfricaNorthern EuropeOceaniaPakistanPanamaPeruPhilippinesPolandPortugalRomaniaRussiaSaudi ArabiaScotlandSierra LeoneSomaliaSouth AfricaSouth AmericaSouth Central AsiaSouth Eastern AsiaSouthern EuropeSpainSri LankaSudanSyriaTaiwanThailandTrinidad and TobagoTurkeyUgandaUkraineVenezuelaVietnamWestern AfricaWestern AsiaWestern EuropeZaireZimbabwe
Income
Income (Families)
Income (Households)
Poverty
Poverty (Families)
Unemployment
Employment Occupations
Employment Industries
Employer Class
Commute Time
Commute Means
School Enrollment
Education by Degree Field
Occupancy
Finances
Physical Characteristics
Omaha
Compare Zip Codes
Comparison Subject

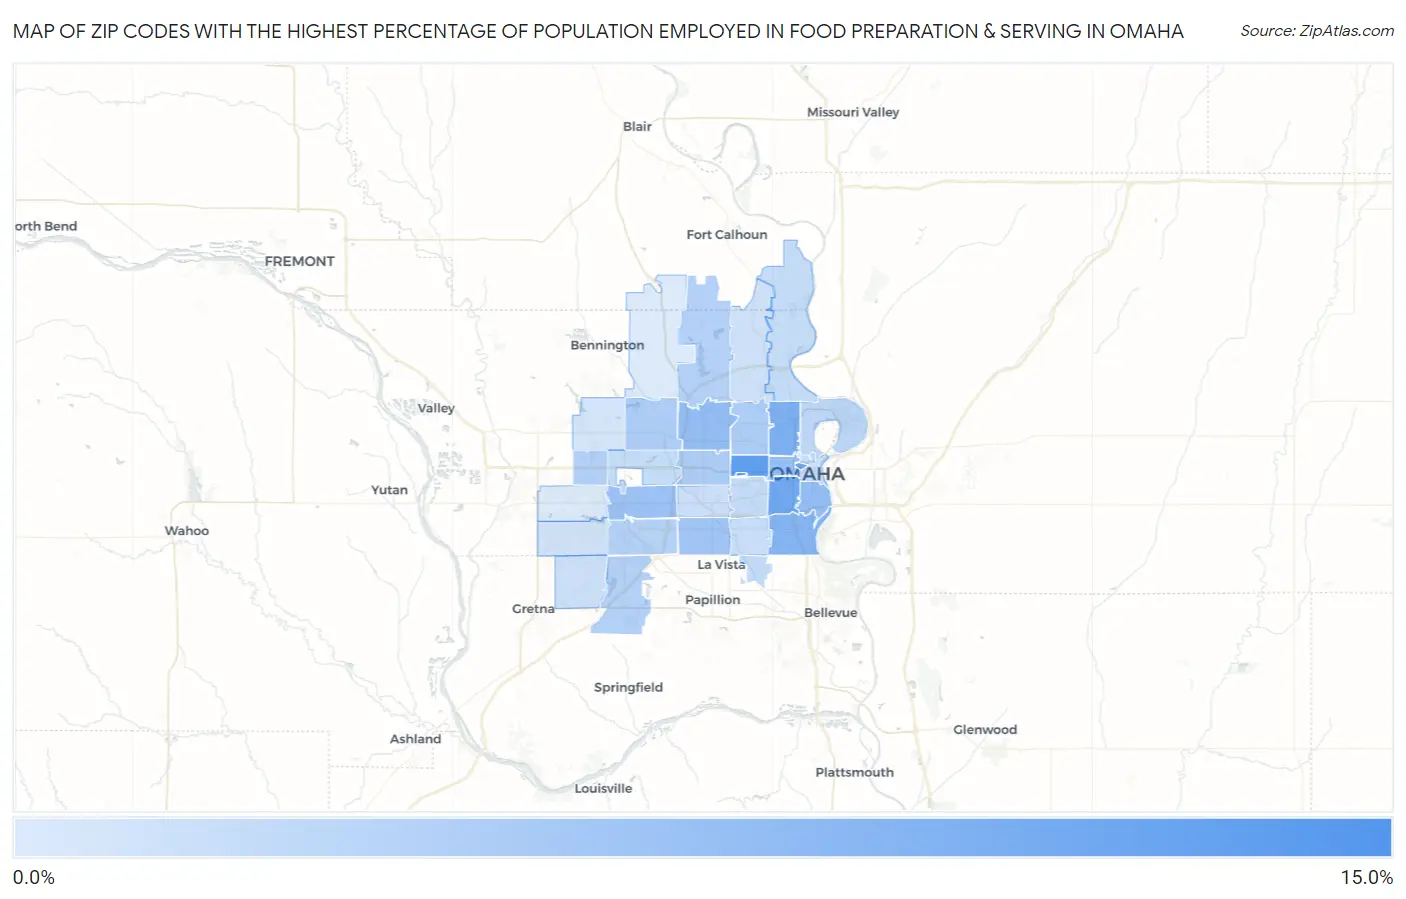
Map of Zip Codes with the Highest Percentage of Population Employed in Food Preparation & Serving in Omaha

0.0%
15.0%
Zip Codes with the Highest Percentage of Population Employed in Food Preparation & Serving in Omaha Map

Zip Codes with the Highest Percentage of Population Employed in Food Preparation & Serving in Omaha, NE

Zip Code % Employed vs State vs National
1.6818212.0%5.1%(+6.89)#185.3%(+6.68)#1,676
2.6813210.2%5.1%(+5.09)#295.3%(+4.88)#2,509
3.681789.4%5.1%(+4.32)#355.3%(+4.11)#3,146
4.681059.2%5.1%(+4.10)#385.3%(+3.89)#3,348
5.681118.4%5.1%(+3.33)#555.3%(+3.12)#4,161
6.681077.8%5.1%(+2.69)#705.3%(+2.48)#5,112
7.681086.9%5.1%(+1.82)#955.3%(+1.61)#6,840
8.681346.8%5.1%(+1.73)#995.3%(+1.52)#7,056
9.681316.6%5.1%(+1.52)#1055.3%(+1.31)#7,619
10.681446.4%5.1%(+1.36)#1095.3%(+1.15)#8,052
11.681275.9%5.1%(+0.837)#1285.3%(+0.627)#9,629
12.681645.3%5.1%(+0.188)#1555.3%(-0.022)#11,882
13.681045.2%5.1%(+0.088)#1615.3%(-0.122)#12,296
14.681145.1%5.1%(+0.052)#1625.3%(-0.157)#12,429
15.681184.8%5.1%(-0.254)#1805.3%(-0.464)#13,670
16.681224.8%5.1%(-0.270)#1815.3%(-0.480)#13,738
17.681384.7%5.1%(-0.380)#1865.3%(-0.589)#14,168
18.681374.6%5.1%(-0.466)#1915.3%(-0.675)#14,546
19.681104.1%5.1%(-0.974)#2195.3%(-1.18)#16,695
20.681063.7%5.1%(-1.33)#2475.3%(-1.54)#18,143
21.681573.7%5.1%(-1.38)#2525.3%(-1.59)#18,388
22.681123.6%5.1%(-1.48)#2625.3%(-1.69)#18,779
23.681543.5%5.1%(-1.55)#2675.3%(-1.76)#19,088
24.681173.4%5.1%(-1.64)#2745.3%(-1.85)#19,458
25.681023.3%5.1%(-1.80)#2905.3%(-2.01)#20,146
26.681243.3%5.1%(-1.82)#2945.3%(-2.03)#20,259
27.681363.1%5.1%(-1.94)#3045.3%(-2.15)#20,694
28.681523.0%5.1%(-2.06)#3145.3%(-2.27)#21,206
29.681352.9%5.1%(-2.19)#3245.3%(-2.40)#21,729
30.681162.6%5.1%(-2.46)#3505.3%(-2.67)#22,703
31.681302.2%5.1%(-2.92)#3945.3%(-3.13)#24,235
32.681422.1%5.1%(-2.97)#3955.3%(-3.18)#24,363

Common Questions

What are the Top 10 Zip Codes with the Highest Percentage of Population Employed in Food Preparation & Serving in Omaha, NE?
Top 10 Zip Codes with the Highest Percentage of Population Employed in Food Preparation & Serving in Omaha, NE are:
#1
12.0%
#2
10.2%
#3
9.4%
#4
9.2%
#5
8.4%
#6
7.8%
#7
6.9%
#8
6.8%
#9
6.6%
#10
6.4%
What zip code has the Highest Percentage of Population Employed in Food Preparation & Serving in Omaha, NE?
68182 has the Highest Percentage of Population Employed in Food Preparation & Serving in Omaha, NE with 12.0%.
What is the Percentage of Population Employed in Food Preparation & Serving in Omaha, NE?
Percentage of Population Employed in Food Preparation & Serving in Omaha is 5.4%.
What is the Percentage of Population Employed in Food Preparation & Serving in Nebraska?
Percentage of Population Employed in Food Preparation & Serving in Nebraska is 5.1%.
What is the Percentage of Population Employed in Food Preparation & Serving in the United States?
Percentage of Population Employed in Food Preparation & Serving in the United States is 5.3%.