Zip Codes with the Highest Percentage of Population with a Degree in Computers and Mathematics in Omaha, NE

RELATED REPORTS & OPTIONS

Computers and Mathematics
Population
Families and Households
Female Fertility
Female Fertility (Unmarried)
Race (Community Size)
Race (Percentage)
Ancestry (Community Size)
AfghanAfricanAlbanianAleutAmericanApacheArabArapahoArgentineanArmenianAustralianAustrianBangladeshiBasqueBelgianBhutaneseBlackfeetBolivianBrazilianBritishBulgarianBurmeseCajunCambodianCanadianCarpatho RusynCentral AmericanCentral American IndianCherokeeChickasawChileanChineseChippewaChoctawColombianComancheCosta RicanCreekCroatianCubanCzechCzechoslovakianDanishDominicanDutchEastern EuropeanEcuadorianEgyptianEnglishEthiopianEuropeanFilipinoFinnishFrenchFrench American IndianFrench CanadianGermanGerman RussianGhanaianGreekGuamanian / ChamorroGuatemalanGuyaneseHaitianHonduranHungarianIcelanderIndian (Asian)IndonesianInupiatIranianIraqiIrishIroquoisIsraeliItalianJamaicanJapaneseJordanianKenyanKiowaKoreanLaotianLatvianLebaneseLithuanianLuxembourgerMacedonianMalaysianMexicanMexican American IndianMoroccanNative HawaiianNavajoNicaraguanNigerianNorthern EuropeanNorwegianPakistaniPalestinianPanamanianPennsylvania GermanPeruvianPolishPortuguesePotawatomiPuebloPuerto RicanRomanianRussianSalvadoranSamoanScandinavianScotch-IrishScottishSeminoleSerbianSiouxSlavicSlovakSloveneSomaliSouth AfricanSouth AmericanSpaniardSpanishSri LankanSubsaharan AfricanSudaneseSwedishSwissSyrianThaiTlingit-HaidaTrinidadian and TobagonianTurkishUkrainianVenezuelanVietnameseWelshWest IndianYugoslavianZimbabwean
Ancestry (Percentage)
AfghanAfricanAlbanianAleutAmericanApacheArabArapahoArgentineanArmenianAustralianAustrianBangladeshiBasqueBelgianBhutaneseBlackfeetBolivianBrazilianBritishBulgarianBurmeseCajunCambodianCanadianCarpatho RusynCentral AmericanCentral American IndianCherokeeChickasawChileanChineseChippewaChoctawColombianComancheCosta RicanCreekCroatianCubanCzechCzechoslovakianDanishDominicanDutchEastern EuropeanEcuadorianEgyptianEnglishEthiopianEuropeanFilipinoFinnishFrenchFrench American IndianFrench CanadianGermanGerman RussianGhanaianGreekGuamanian / ChamorroGuatemalanGuyaneseHaitianHonduranHungarianIcelanderIndian (Asian)IndonesianInupiatIranianIraqiIrishIroquoisIsraeliItalianJamaicanJapaneseJordanianKenyanKiowaKoreanLaotianLatvianLebaneseLithuanianLuxembourgerMacedonianMalaysianMexicanMexican American IndianMoroccanNative HawaiianNavajoNicaraguanNigerianNorthern EuropeanNorwegianPakistaniPalestinianPanamanianPennsylvania GermanPeruvianPolishPortuguesePotawatomiPuebloPuerto RicanRomanianRussianSalvadoranSamoanScandinavianScotch-IrishScottishSeminoleSerbianSiouxSlavicSlovakSloveneSomaliSouth AfricanSouth AmericanSpaniardSpanishSri LankanSubsaharan AfricanSudaneseSwedishSwissSyrianThaiTlingit-HaidaTrinidadian and TobagonianTurkishUkrainianVenezuelanVietnameseWelshWest IndianYugoslavianZimbabwean
Immigrant Origin (Total)
AfghanistanAfricaArgentinaAsiaAustraliaBangladeshBarbadosBelarusBosnia and HerzegovinaBrazilBurma / MyanmarCameroonCanadaCaribbeanCentral AmericaChileChinaColombiaCongoCosta RicaCroatiaCubaCzechoslovakiaDominican RepublicEastern AfricaEastern AsiaEastern EuropeEgyptEl SalvadorEnglandEthiopiaEuropeFranceGermanyGhanaGreeceGuatemalaHondurasHong KongHungaryIndiaIndonesiaIranIraqIrelandIsraelItalyJamaicaJapanJordanKazakhstanKenyaKoreaKuwaitLaosLatin AmericaLatviaLithuaniaMalaysiaMexicoMiddle AfricaMoroccoNepalNetherlandsNicaraguaNigeriaNorthern AfricaNorthern EuropeOceaniaPakistanPanamaPeruPhilippinesPolandPortugalRomaniaRussiaSaudi ArabiaScotlandSierra LeoneSomaliaSouth AfricaSouth AmericaSouth Central AsiaSouth Eastern AsiaSouthern EuropeSpainSri LankaSudanSyriaTaiwanThailandTrinidad and TobagoTurkeyUgandaUkraineVenezuelaVietnamWestern AfricaWestern AsiaWestern EuropeZaireZimbabwe
Immigrant Origin (Percentage)
AfghanistanAfricaArgentinaAsiaAustraliaBangladeshBarbadosBelarusBosnia and HerzegovinaBrazilBurma / MyanmarCameroonCanadaCaribbeanCentral AmericaChileChinaColombiaCongoCosta RicaCroatiaCubaCzechoslovakiaDominican RepublicEastern AfricaEastern AsiaEastern EuropeEgyptEl SalvadorEnglandEthiopiaEuropeFranceGermanyGhanaGreeceGuatemalaHondurasHong KongHungaryIndiaIndonesiaIranIraqIrelandIsraelItalyJamaicaJapanJordanKazakhstanKenyaKoreaKuwaitLaosLatin AmericaLatviaLithuaniaMalaysiaMexicoMiddle AfricaMoroccoNepalNetherlandsNicaraguaNigeriaNorthern AfricaNorthern EuropeOceaniaPakistanPanamaPeruPhilippinesPolandPortugalRomaniaRussiaSaudi ArabiaScotlandSierra LeoneSomaliaSouth AfricaSouth AmericaSouth Central AsiaSouth Eastern AsiaSouthern EuropeSpainSri LankaSudanSyriaTaiwanThailandTrinidad and TobagoTurkeyUgandaUkraineVenezuelaVietnamWestern AfricaWestern AsiaWestern EuropeZaireZimbabwe
Income
Income (Families)
Income (Households)
Poverty
Poverty (Families)
Unemployment
Employment Occupations
Employment Industries
Employer Class
Commute Time
Commute Means
School Enrollment
Education by Degree Field
Occupancy
Finances
Physical Characteristics
Omaha
Compare Zip Codes
Comparison Subject

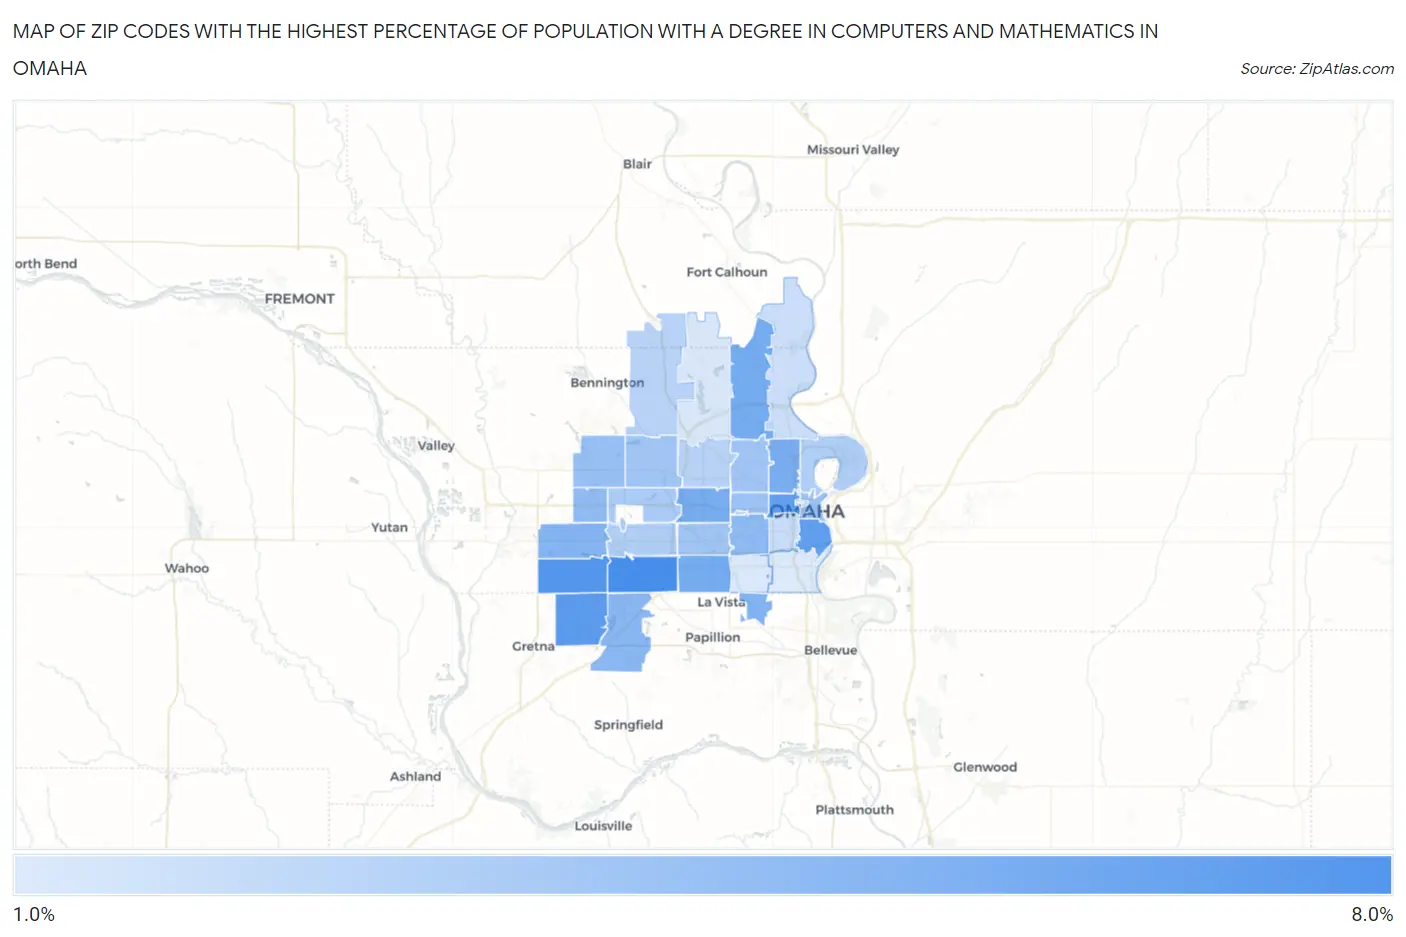
Map of Zip Codes with the Highest Percentage of Population with a Degree in Computers and Mathematics in Omaha

0.0%
8.0%
Zip Codes with the Highest Percentage of Population with a Degree in Computers and Mathematics in Omaha Map

Zip Codes with the Highest Percentage of Population with a Degree in Computers and Mathematics in Omaha, NE

Zip Code % Graduates vs State vs National
1.681377.0%3.8%(+3.20)#484.9%(+2.10)#3,836
2.681356.5%3.8%(+2.70)#504.9%(+1.60)#4,475
3.681366.2%3.8%(+2.42)#564.9%(+1.32)#4,916
4.681086.0%3.8%(+2.24)#644.9%(+1.14)#5,245
5.681316.0%3.8%(+2.18)#654.9%(+1.08)#5,334
6.681275.4%3.8%(+1.57)#744.9%(+0.472)#6,590
7.681525.3%3.8%(+1.50)#764.9%(+0.405)#6,755
8.681145.2%3.8%(+1.44)#774.9%(+0.345)#6,909
9.681115.2%3.8%(+1.38)#794.9%(+0.282)#7,030
10.681574.8%3.8%(+0.993)#924.9%(-0.104)#8,015
11.681304.7%3.8%(+0.932)#944.9%(-0.164)#8,186
12.681384.6%3.8%(+0.787)#994.9%(-0.310)#8,607
13.681064.4%3.8%(+0.610)#1034.9%(-0.487)#9,178
14.681184.3%3.8%(+0.538)#1084.9%(-0.559)#9,411
15.681164.1%3.8%(+0.262)#1174.9%(-0.835)#10,280
16.681324.0%3.8%(+0.244)#1194.9%(-0.853)#10,332
17.681024.0%3.8%(+0.205)#1244.9%(-0.892)#10,449
18.681643.8%3.8%(+0.001)#1304.9%(-1.10)#11,191
19.681243.8%3.8%(-0.027)#1354.9%(-1.12)#11,290
20.681043.7%3.8%(-0.048)#1364.9%(-1.14)#11,372
21.681543.4%3.8%(-0.351)#1474.9%(-1.45)#12,499
22.681443.3%3.8%(-0.491)#1524.9%(-1.59)#13,000
23.681103.2%3.8%(-0.638)#1604.9%(-1.73)#13,517
24.681343.0%3.8%(-0.844)#1734.9%(-1.94)#14,233
25.681423.0%3.8%(-0.846)#1744.9%(-1.94)#14,240
26.681052.4%3.8%(-1.44)#1934.9%(-2.54)#16,408
27.681122.3%3.8%(-1.47)#1954.9%(-2.56)#16,484
28.681221.8%3.8%(-1.98)#2204.9%(-3.08)#18,178
29.681171.7%3.8%(-2.08)#2284.9%(-3.17)#18,468
30.681071.7%3.8%(-2.13)#2364.9%(-3.23)#18,635

Common Questions

What are the Top 10 Zip Codes with the Highest Percentage of Population with a Degree in Computers and Mathematics in Omaha, NE?
Top 10 Zip Codes with the Highest Percentage of Population with a Degree in Computers and Mathematics in Omaha, NE are:
#1
7.0%
#2
6.5%
#3
6.2%
#4
6.0%
#5
6.0%
#6
5.4%
#7
5.3%
#8
5.2%
#9
5.2%
#10
4.8%
What zip code has the Highest Percentage of Population with a Degree in Computers and Mathematics in Omaha, NE?
68137 has the Highest Percentage of Population with a Degree in Computers and Mathematics in Omaha, NE with 7.0%.
What is the Percentage of Population with a Degree in Computers and Mathematics in Omaha, NE?
Percentage of Population with a Degree in Computers and Mathematics in Omaha is 4.3%.
What is the Percentage of Population with a Degree in Computers and Mathematics in Nebraska?
Percentage of Population with a Degree in Computers and Mathematics in Nebraska is 3.8%.
What is the Percentage of Population with a Degree in Computers and Mathematics in the United States?
Percentage of Population with a Degree in Computers and Mathematics in the United States is 4.9%.