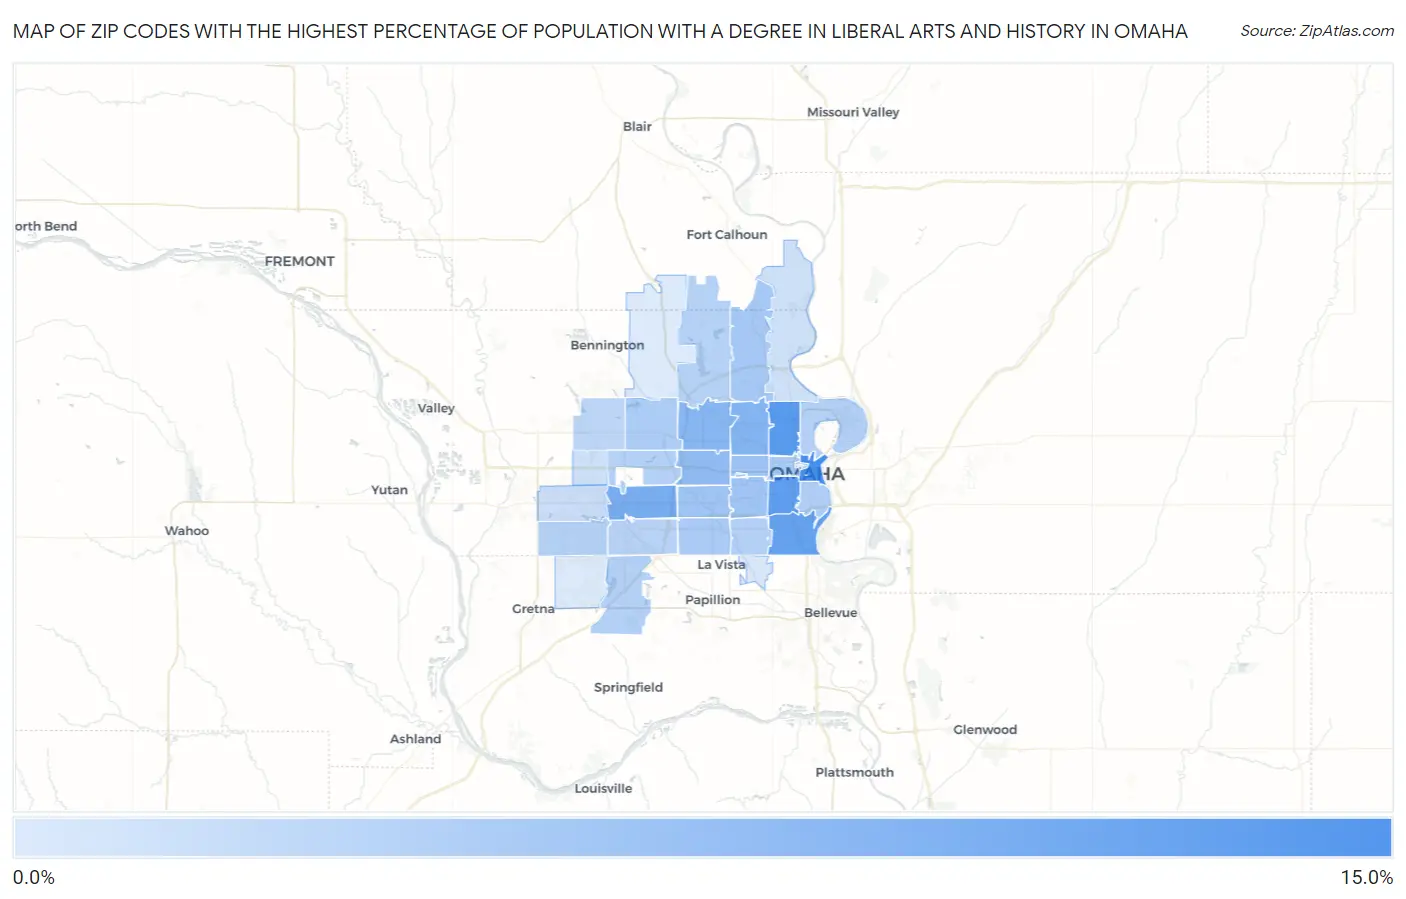
Zip Codes with the Highest Percentage of Population with a Degree in Liberal Arts and History in Omaha, NE
RELATED REPORTS & OPTIONS
Liberal Arts and History
Omaha
Compare Zip Codes
Map of Zip Codes with the Highest Percentage of Population with a Degree in Liberal Arts and History in Omaha
1.3%
10.6%
Zip Codes with the Highest Percentage of Population with a Degree in Liberal Arts and History in Omaha, NE
| Zip Code | % Graduates | vs State | vs National | |
| 1. | 68102 | 10.6% | 4.0%(+6.66)#34 | 4.9%(+5.77)#2,740 |
| 2. | 68111 | 9.6% | 4.0%(+5.58)#42 | 4.9%(+4.68)#3,405 |
| 3. | 68105 | 9.0% | 4.0%(+5.03)#49 | 4.9%(+4.14)#3,847 |
| 4. | 68107 | 8.6% | 4.0%(+4.66)#53 | 4.9%(+3.76)#4,196 |
| 5. | 68144 | 7.5% | 4.0%(+3.51)#67 | 4.9%(+2.61)#5,606 |
| 6. | 68104 | 6.7% | 4.0%(+2.76)#74 | 4.9%(+1.86)#6,864 |
| 7. | 68134 | 6.5% | 4.0%(+2.53)#78 | 4.9%(+1.63)#7,337 |
| 8. | 68114 | 6.0% | 4.0%(+2.02)#85 | 4.9%(+1.12)#8,543 |
| 9. | 68132 | 5.2% | 4.0%(+1.26)#106 | 4.9%(+0.366)#10,625 |
| 10. | 68106 | 5.0% | 4.0%(+1.01)#116 | 4.9%(+0.108)#11,409 |
| 11. | 68124 | 5.0% | 4.0%(+1.01)#117 | 4.9%(+0.107)#11,410 |
| 12. | 68152 | 4.7% | 4.0%(+0.696)#134 | 4.9%(-0.203)#12,427 |
| 13. | 68127 | 4.4% | 4.0%(+0.455)#143 | 4.9%(-0.444)#13,194 |
| 14. | 68131 | 4.4% | 4.0%(+0.387)#145 | 4.9%(-0.512)#13,418 |
| 15. | 68164 | 4.2% | 4.0%(+0.202)#158 | 4.9%(-0.697)#14,113 |
| 16. | 68108 | 4.1% | 4.0%(+0.140)#161 | 4.9%(-0.759)#14,353 |
| 17. | 68110 | 3.8% | 4.0%(-0.127)#176 | 4.9%(-1.03)#15,341 |
| 18. | 68138 | 3.8% | 4.0%(-0.136)#177 | 4.9%(-1.04)#15,390 |
| 19. | 68117 | 3.8% | 4.0%(-0.160)#180 | 4.9%(-1.06)#15,470 |
| 20. | 68154 | 3.8% | 4.0%(-0.208)#183 | 4.9%(-1.11)#15,653 |
| 21. | 68122 | 3.6% | 4.0%(-0.338)#189 | 4.9%(-1.24)#16,119 |
| 22. | 68135 | 3.6% | 4.0%(-0.352)#191 | 4.9%(-1.25)#16,172 |
| 23. | 68137 | 3.6% | 4.0%(-0.403)#195 | 4.9%(-1.30)#16,352 |
| 24. | 68116 | 3.3% | 4.0%(-0.664)#210 | 4.9%(-1.56)#17,287 |
| 25. | 68130 | 2.4% | 4.0%(-1.59)#270 | 4.9%(-2.49)#20,330 |
| 26. | 68112 | 2.1% | 4.0%(-1.89)#283 | 4.9%(-2.79)#21,137 |
| 27. | 68118 | 2.1% | 4.0%(-1.90)#284 | 4.9%(-2.80)#21,179 |
| 28. | 68157 | 1.6% | 4.0%(-2.35)#308 | 4.9%(-3.25)#22,241 |
| 29. | 68142 | 1.4% | 4.0%(-2.62)#330 | 4.9%(-3.52)#22,775 |
| 30. | 68136 | 1.3% | 4.0%(-2.68)#334 | 4.9%(-3.57)#22,873 |
1
Common Questions
What are the Top 10 Zip Codes with the Highest Percentage of Population with a Degree in Liberal Arts and History in Omaha, NE?
Top 10 Zip Codes with the Highest Percentage of Population with a Degree in Liberal Arts and History in Omaha, NE are:
What zip code has the Highest Percentage of Population with a Degree in Liberal Arts and History in Omaha, NE?
68102 has the Highest Percentage of Population with a Degree in Liberal Arts and History in Omaha, NE with 10.6%.
What is the Percentage of Population with a Degree in Liberal Arts and History in Omaha, NE?
Percentage of Population with a Degree in Liberal Arts and History in Omaha is 4.9%.
What is the Percentage of Population with a Degree in Liberal Arts and History in Nebraska?
Percentage of Population with a Degree in Liberal Arts and History in Nebraska is 4.0%.
What is the Percentage of Population with a Degree in Liberal Arts and History in the United States?
Percentage of Population with a Degree in Liberal Arts and History in the United States is 4.9%.