Zip Codes with the Highest Percentage of Households with Income Below $10,000 in Lincoln, NE

RELATED REPORTS & OPTIONS

Household Income | $0-10k
Population
Families and Households
Female Fertility
Female Fertility (Unmarried)
Race (Community Size)
Race (Percentage)
Ancestry (Community Size)
AfghanAfricanAlaska NativeAlbanianAmericanApacheArabArgentineanArmenianAustralianAustrianBangladeshiBelgianBhutaneseBlackfeetBrazilianBritishBritish West IndianBulgarianBurmeseCanadianCelticCentral AmericanCentral American IndianCherokeeChileanChippewaChoctawColombianCosta RicanCreekCroatianCubanCzechCzechoslovakianDanishDominicanDutchEastern EuropeanEcuadorianEgyptianEnglishEthiopianEuropeanFilipinoFinnishFrenchFrench American IndianFrench CanadianGermanGerman RussianGhanaianGreekGuamanian / ChamorroGuatemalanHaitianHonduranHungarianIcelanderIndian (Asian)IndonesianIranianIraqiIrishIroquoisItalianJamaicanJapaneseJordanianKenyanKoreanLaotianLatvianLebaneseLithuanianLuxembourgerMalaysianMexicanMexican American IndianMongolianMoroccanNative HawaiianNavajoNicaraguanNigerianNorthern EuropeanNorwegianPakistaniPalestinianPanamanianPennsylvania GermanPeruvianPolishPortuguesePotawatomiPuerto RicanRomanianRussianSalvadoranSamoanScandinavianScotch-IrishScottishSerbianSiouxSlavicSlovakSomaliSouth AmericanSouth American IndianSpaniardSpanishSri LankanSubsaharan AfricanSudaneseSwedishSwissSyrianThaiTrinidadian and TobagonianTurkishUkrainianVenezuelanVietnameseWelshWest IndianYugoslavian
Ancestry (Percentage)
AfghanAfricanAlaska NativeAlbanianAmericanApacheArabArgentineanArmenianAustralianAustrianBangladeshiBelgianBhutaneseBlackfeetBrazilianBritishBritish West IndianBulgarianBurmeseCanadianCelticCentral AmericanCentral American IndianCherokeeChileanChippewaChoctawColombianCosta RicanCreekCroatianCubanCzechCzechoslovakianDanishDominicanDutchEastern EuropeanEcuadorianEgyptianEnglishEthiopianEuropeanFilipinoFinnishFrenchFrench American IndianFrench CanadianGermanGerman RussianGhanaianGreekGuamanian / ChamorroGuatemalanHaitianHonduranHungarianIcelanderIndian (Asian)IndonesianIranianIraqiIrishIroquoisItalianJamaicanJapaneseJordanianKenyanKoreanLaotianLatvianLebaneseLithuanianLuxembourgerMalaysianMexicanMexican American IndianMongolianMoroccanNative HawaiianNavajoNicaraguanNigerianNorthern EuropeanNorwegianPakistaniPalestinianPanamanianPennsylvania GermanPeruvianPolishPortuguesePotawatomiPuerto RicanRomanianRussianSalvadoranSamoanScandinavianScotch-IrishScottishSerbianSiouxSlavicSlovakSomaliSouth AmericanSouth American IndianSpaniardSpanishSri LankanSubsaharan AfricanSudaneseSwedishSwissSyrianThaiTrinidadian and TobagonianTurkishUkrainianVenezuelanVietnameseWelshWest IndianYugoslavian
Immigrant Origin (Total)
AfghanistanAfricaArgentinaAsiaAustraliaAustriaBangladeshBelarusBelgiumBosnia and HerzegovinaBrazilBurma / MyanmarCambodiaCameroonCanadaCaribbeanCentral AmericaChinaColombiaCosta RicaCubaDominican RepublicEastern AfricaEastern AsiaEastern EuropeEl SalvadorEnglandEthiopiaEuropeFranceGermanyGhanaGreeceGuatemalaHaitiHondurasHong KongHungaryIndiaIndonesiaIranIraqItalyJamaicaJapanJordanKazakhstanKenyaKoreaKuwaitLaosLatin AmericaLatviaLebanonLiberiaMalaysiaMexicoMiddle AfricaMoldovaMoroccoNepalNetherlandsNigeriaNorthern AfricaNorthern EuropeOceaniaPakistanPanamaPeruPhilippinesPolandRomaniaRussiaSaudi ArabiaScotlandSerbiaSomaliaSouth AmericaSouth Central AsiaSouth Eastern AsiaSouthern EuropeSpainSudanSwedenSyriaTaiwanThailandTrinidad and TobagoUgandaUkraineUzbekistanVenezuelaVietnamWestern AfricaWestern AsiaWestern EuropeZaire
Immigrant Origin (Percentage)
AfghanistanAfricaArgentinaAsiaAustraliaAustriaBangladeshBelarusBelgiumBosnia and HerzegovinaBrazilBurma / MyanmarCambodiaCameroonCanadaCaribbeanCentral AmericaChinaColombiaCosta RicaCubaDominican RepublicEastern AfricaEastern AsiaEastern EuropeEl SalvadorEnglandEthiopiaEuropeFranceGermanyGhanaGreeceGuatemalaHaitiHondurasHong KongHungaryIndiaIndonesiaIranIraqItalyJamaicaJapanJordanKazakhstanKenyaKoreaKuwaitLaosLatin AmericaLatviaLebanonLiberiaMalaysiaMexicoMiddle AfricaMoldovaMoroccoNepalNetherlandsNigeriaNorthern AfricaNorthern EuropeOceaniaPakistanPanamaPeruPhilippinesPolandRomaniaRussiaSaudi ArabiaScotlandSerbiaSomaliaSouth AmericaSouth Central AsiaSouth Eastern AsiaSouthern EuropeSpainSudanSwedenSyriaTaiwanThailandTrinidad and TobagoUgandaUkraineUzbekistanVenezuelaVietnamWestern AfricaWestern AsiaWestern EuropeZaire
Income
Income (Families)
Income (Households)
Poverty
Poverty (Families)
Unemployment
Employment Occupations
Employment Industries
Employer Class
Commute Time
Commute Means
School Enrollment
Education by Degree Field
Occupancy
Finances
Physical Characteristics
Lincoln
Compare Zip Codes
Comparison Subject

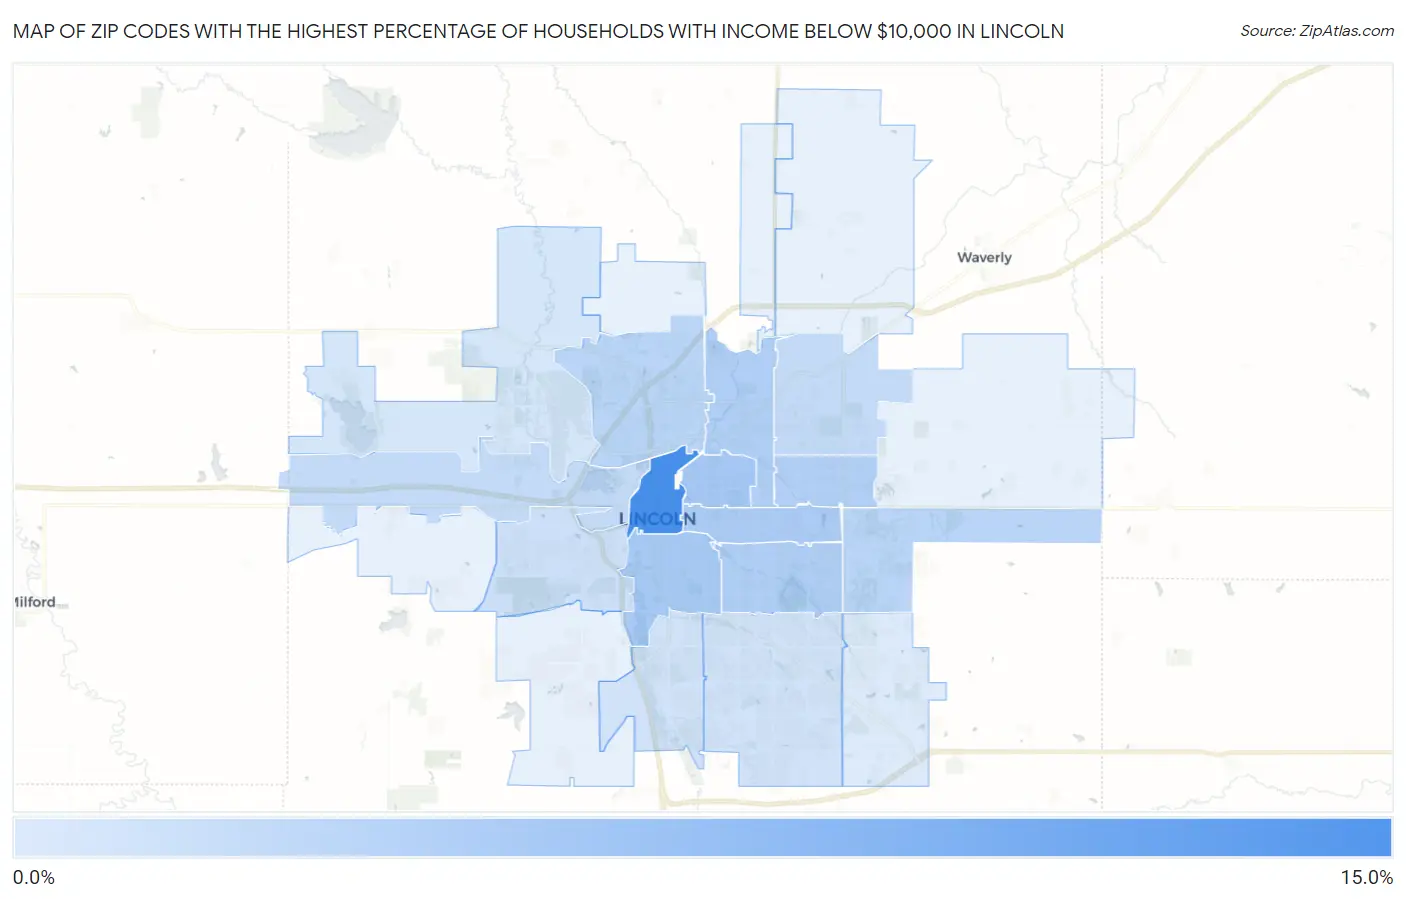
Map of Zip Codes with the Highest Percentage of Households with Income Below $10,000 in Lincoln

0.0%
15.0%
Zip Codes with the Highest Percentage of Households with Income Below $10,000 in Lincoln Map

Zip Codes with the Highest Percentage of Households with Income Below $10,000 in Lincoln, NE

Zip Code Households with Income < $10k vs State vs National
1.6850814.1%4.2%(+9.90)#124.9%(+9.20)#1,742
2.685035.9%4.2%(+1.70)#1014.9%(+1.00)#9,262
3.685025.7%4.2%(+1.50)#1094.9%(+0.800)#9,723
4.685105.4%4.2%(+1.20)#1174.9%(+0.500)#10,497
5.685045.1%4.2%(+0.900)#1314.9%(+0.200)#11,410
6.685065.0%4.2%(+0.800)#1364.9%(+0.100)#11,689
7.685054.8%4.2%(+0.600)#1494.9%(-0.100)#12,358
8.685204.3%4.2%(+0.100)#1814.9%(-0.600)#14,308
9.685214.2%4.2%(=0.000)#1894.9%(-0.700)#14,465
10.685283.6%4.2%(-0.600)#2454.9%(-1.30)#16,967
11.685073.5%4.2%(-0.700)#2514.9%(-1.40)#17,318
12.685222.7%4.2%(-1.50)#3144.9%(-2.20)#20,784
13.685162.5%4.2%(-1.70)#3264.9%(-2.40)#21,543
14.685122.4%4.2%(-1.80)#3354.9%(-2.50)#22,105
15.685242.0%4.2%(-2.20)#3684.9%(-2.90)#23,739
16.685261.5%4.2%(-2.70)#4024.9%(-3.40)#25,491

Common Questions

What are the Top 10 Zip Codes with the Highest Percentage of Households with Income Below $10,000 in Lincoln, NE?
Top 10 Zip Codes with the Highest Percentage of Households with Income Below $10,000 in Lincoln, NE are:
#1
14.1%
#2
5.9%
#3
5.7%
#4
5.4%
#5
5.1%
#6
5.0%
#7
4.8%
#8
4.3%
#9
4.2%
#10
3.6%
What zip code has the Highest Percentage of Households with Income Below $10,000 in Lincoln, NE?
68508 has the Highest Percentage of Households with Income Below $10,000 in Lincoln, NE with 14.1%.
What is the Percentage of Households with Income Below $10,000 in Lincoln, NE?
Percentage of Households with Income Below $10,000 in Lincoln is 4.7%.
What is the Percentage of Households with Income Below $10,000 in Nebraska?
Percentage of Households with Income Below $10,000 in Nebraska is 4.2%.
What is the Percentage of Households with Income Below $10,000 in the United States?
Percentage of Households with Income Below $10,000 in the United States is 4.9%.