Zip Codes with the Highest Percentage of Population Employed in Real Estate, Rental & Leasing in Omaha, NE

RELATED REPORTS & OPTIONS

Real Estate, Rental & Leasing
Population
Families and Households
Female Fertility
Female Fertility (Unmarried)
Race (Community Size)
Race (Percentage)
Ancestry (Community Size)
AfghanAfricanAlbanianAleutAmericanApacheArabArapahoArgentineanArmenianAustralianAustrianBangladeshiBasqueBelgianBhutaneseBlackfeetBolivianBrazilianBritishBulgarianBurmeseCajunCambodianCanadianCarpatho RusynCentral AmericanCentral American IndianCherokeeChickasawChileanChineseChippewaChoctawColombianComancheCosta RicanCreekCroatianCubanCzechCzechoslovakianDanishDominicanDutchEastern EuropeanEcuadorianEgyptianEnglishEthiopianEuropeanFilipinoFinnishFrenchFrench American IndianFrench CanadianGermanGerman RussianGhanaianGreekGuamanian / ChamorroGuatemalanGuyaneseHaitianHonduranHungarianIcelanderIndian (Asian)IndonesianInupiatIranianIraqiIrishIroquoisIsraeliItalianJamaicanJapaneseJordanianKenyanKiowaKoreanLaotianLatvianLebaneseLithuanianLuxembourgerMacedonianMalaysianMexicanMexican American IndianMoroccanNative HawaiianNavajoNicaraguanNigerianNorthern EuropeanNorwegianPakistaniPalestinianPanamanianPennsylvania GermanPeruvianPolishPortuguesePotawatomiPuebloPuerto RicanRomanianRussianSalvadoranSamoanScandinavianScotch-IrishScottishSeminoleSerbianSiouxSlavicSlovakSloveneSomaliSouth AfricanSouth AmericanSpaniardSpanishSri LankanSubsaharan AfricanSudaneseSwedishSwissSyrianThaiTlingit-HaidaTrinidadian and TobagonianTurkishUkrainianVenezuelanVietnameseWelshWest IndianYugoslavianZimbabwean
Ancestry (Percentage)
AfghanAfricanAlbanianAleutAmericanApacheArabArapahoArgentineanArmenianAustralianAustrianBangladeshiBasqueBelgianBhutaneseBlackfeetBolivianBrazilianBritishBulgarianBurmeseCajunCambodianCanadianCarpatho RusynCentral AmericanCentral American IndianCherokeeChickasawChileanChineseChippewaChoctawColombianComancheCosta RicanCreekCroatianCubanCzechCzechoslovakianDanishDominicanDutchEastern EuropeanEcuadorianEgyptianEnglishEthiopianEuropeanFilipinoFinnishFrenchFrench American IndianFrench CanadianGermanGerman RussianGhanaianGreekGuamanian / ChamorroGuatemalanGuyaneseHaitianHonduranHungarianIcelanderIndian (Asian)IndonesianInupiatIranianIraqiIrishIroquoisIsraeliItalianJamaicanJapaneseJordanianKenyanKiowaKoreanLaotianLatvianLebaneseLithuanianLuxembourgerMacedonianMalaysianMexicanMexican American IndianMoroccanNative HawaiianNavajoNicaraguanNigerianNorthern EuropeanNorwegianPakistaniPalestinianPanamanianPennsylvania GermanPeruvianPolishPortuguesePotawatomiPuebloPuerto RicanRomanianRussianSalvadoranSamoanScandinavianScotch-IrishScottishSeminoleSerbianSiouxSlavicSlovakSloveneSomaliSouth AfricanSouth AmericanSpaniardSpanishSri LankanSubsaharan AfricanSudaneseSwedishSwissSyrianThaiTlingit-HaidaTrinidadian and TobagonianTurkishUkrainianVenezuelanVietnameseWelshWest IndianYugoslavianZimbabwean
Immigrant Origin (Total)
AfghanistanAfricaArgentinaAsiaAustraliaBangladeshBarbadosBelarusBosnia and HerzegovinaBrazilBurma / MyanmarCameroonCanadaCaribbeanCentral AmericaChileChinaColombiaCongoCosta RicaCroatiaCubaCzechoslovakiaDominican RepublicEastern AfricaEastern AsiaEastern EuropeEgyptEl SalvadorEnglandEthiopiaEuropeFranceGermanyGhanaGreeceGuatemalaHondurasHong KongHungaryIndiaIndonesiaIranIraqIrelandIsraelItalyJamaicaJapanJordanKazakhstanKenyaKoreaKuwaitLaosLatin AmericaLatviaLithuaniaMalaysiaMexicoMiddle AfricaMoroccoNepalNetherlandsNicaraguaNigeriaNorthern AfricaNorthern EuropeOceaniaPakistanPanamaPeruPhilippinesPolandPortugalRomaniaRussiaSaudi ArabiaScotlandSierra LeoneSomaliaSouth AfricaSouth AmericaSouth Central AsiaSouth Eastern AsiaSouthern EuropeSpainSri LankaSudanSyriaTaiwanThailandTrinidad and TobagoTurkeyUgandaUkraineVenezuelaVietnamWestern AfricaWestern AsiaWestern EuropeZaireZimbabwe
Immigrant Origin (Percentage)
AfghanistanAfricaArgentinaAsiaAustraliaBangladeshBarbadosBelarusBosnia and HerzegovinaBrazilBurma / MyanmarCameroonCanadaCaribbeanCentral AmericaChileChinaColombiaCongoCosta RicaCroatiaCubaCzechoslovakiaDominican RepublicEastern AfricaEastern AsiaEastern EuropeEgyptEl SalvadorEnglandEthiopiaEuropeFranceGermanyGhanaGreeceGuatemalaHondurasHong KongHungaryIndiaIndonesiaIranIraqIrelandIsraelItalyJamaicaJapanJordanKazakhstanKenyaKoreaKuwaitLaosLatin AmericaLatviaLithuaniaMalaysiaMexicoMiddle AfricaMoroccoNepalNetherlandsNicaraguaNigeriaNorthern AfricaNorthern EuropeOceaniaPakistanPanamaPeruPhilippinesPolandPortugalRomaniaRussiaSaudi ArabiaScotlandSierra LeoneSomaliaSouth AfricaSouth AmericaSouth Central AsiaSouth Eastern AsiaSouthern EuropeSpainSri LankaSudanSyriaTaiwanThailandTrinidad and TobagoTurkeyUgandaUkraineVenezuelaVietnamWestern AfricaWestern AsiaWestern EuropeZaireZimbabwe
Income
Income (Families)
Income (Households)
Poverty
Poverty (Families)
Unemployment
Employment Occupations
Employment Industries
Employer Class
Commute Time
Commute Means
School Enrollment
Education by Degree Field
Occupancy
Finances
Physical Characteristics
Omaha
Compare Zip Codes
Comparison Subject

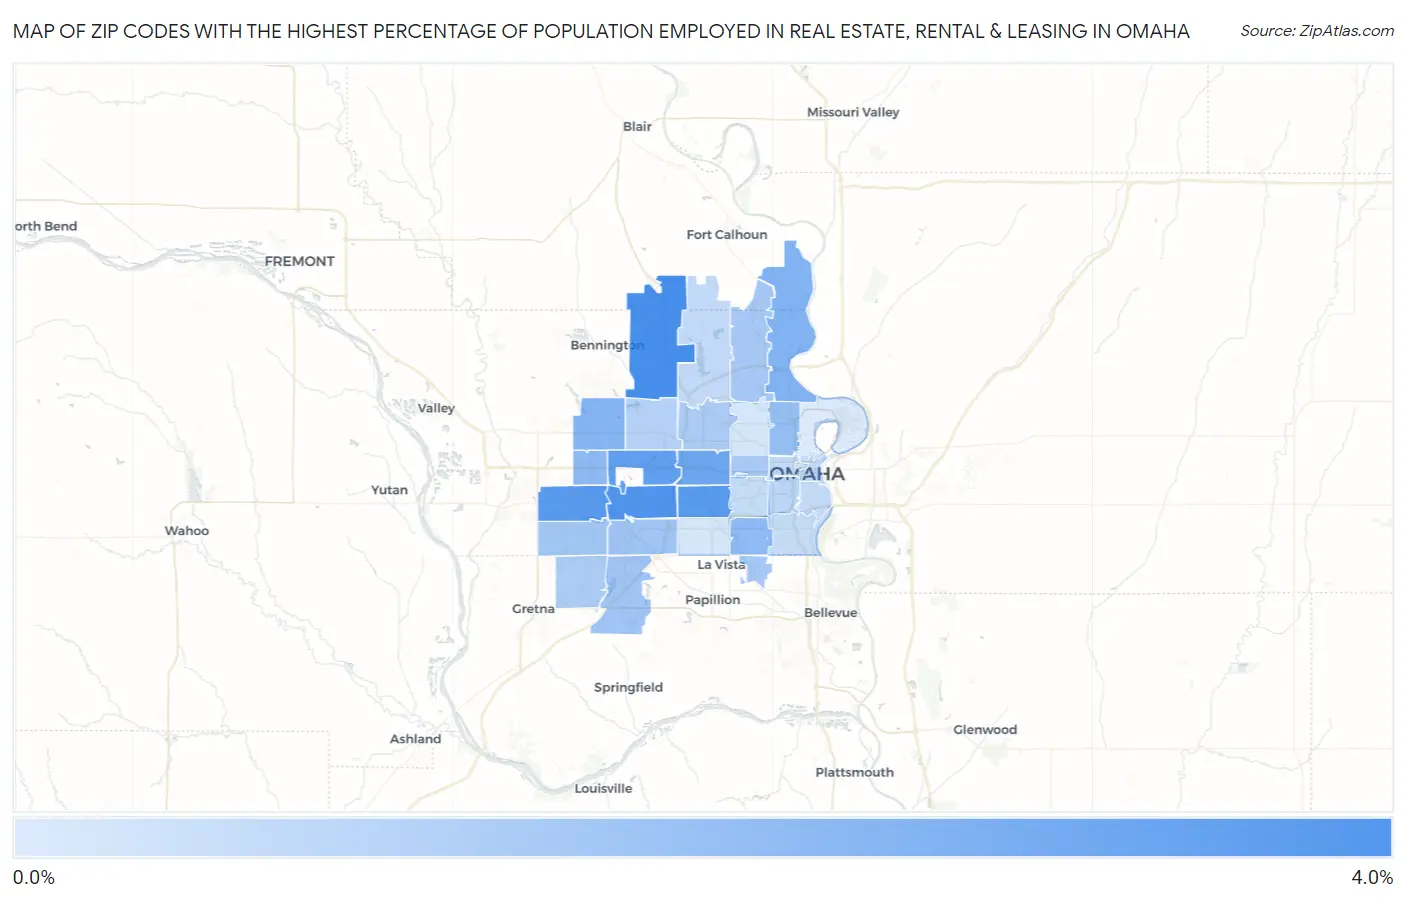
Map of Zip Codes with the Highest Percentage of Population Employed in Real Estate, Rental & Leasing in Omaha

0.0%
4.0%
Zip Codes with the Highest Percentage of Population Employed in Real Estate, Rental & Leasing in Omaha Map

Zip Codes with the Highest Percentage of Population Employed in Real Estate, Rental & Leasing in Omaha, NE

Zip Code % Employed vs State vs National
1.681423.1%1.2%(+1.90)#251.9%(+1.19)#3,660
2.681442.9%1.2%(+1.74)#311.9%(+1.03)#4,096
3.681302.8%1.2%(+1.62)#351.9%(+0.913)#4,426
4.681242.8%1.2%(+1.62)#361.9%(+0.911)#4,430
5.681542.6%1.2%(+1.45)#401.9%(+0.739)#4,998
6.681142.4%1.2%(+1.22)#441.9%(+0.512)#5,883
7.681122.1%1.2%(+0.904)#491.9%(+0.196)#7,386
8.681162.0%1.2%(+0.822)#541.9%(+0.114)#7,803
9.681181.9%1.2%(+0.673)#611.9%(-0.035)#8,736
10.681171.8%1.2%(+0.658)#641.9%(-0.050)#8,849
11.681111.7%1.2%(+0.535)#721.9%(-0.173)#9,629
12.681381.6%1.2%(+0.373)#791.9%(-0.335)#10,742
13.681371.5%1.2%(+0.356)#801.9%(-0.352)#10,861
14.681351.5%1.2%(+0.308)#841.9%(-0.400)#11,223
15.681571.5%1.2%(+0.287)#861.9%(-0.422)#11,395
16.681521.5%1.2%(+0.277)#871.9%(-0.431)#11,476
17.681321.4%1.2%(+0.251)#901.9%(-0.457)#11,713
18.681341.4%1.2%(+0.193)#951.9%(-0.515)#12,166
19.681361.4%1.2%(+0.172)#991.9%(-0.537)#12,308
20.681641.2%1.2%(+0.044)#1071.9%(-0.664)#13,261
21.681051.1%1.2%(-0.072)#1221.9%(-0.780)#14,187
22.681021.0%1.2%(-0.146)#1371.9%(-0.854)#14,822
23.681221.0%1.2%(-0.178)#1431.9%(-0.886)#15,114
24.681311.00%1.2%(-0.188)#1461.9%(-0.896)#15,203
25.681080.97%1.2%(-0.213)#1501.9%(-0.922)#15,397
26.681060.92%1.2%(-0.265)#1581.9%(-0.973)#15,808
27.681070.90%1.2%(-0.282)#1611.9%(-0.990)#15,942
28.681780.73%1.2%(-0.453)#1841.9%(-1.16)#17,240
29.681270.64%1.2%(-0.547)#2071.9%(-1.25)#17,979
30.681040.63%1.2%(-0.558)#2081.9%(-1.27)#18,064
31.681100.52%1.2%(-0.660)#2241.9%(-1.37)#18,899

Common Questions

What are the Top 10 Zip Codes with the Highest Percentage of Population Employed in Real Estate, Rental & Leasing in Omaha, NE?
Top 10 Zip Codes with the Highest Percentage of Population Employed in Real Estate, Rental & Leasing in Omaha, NE are:
#1
3.1%
#2
2.9%
#3
2.8%
#4
2.8%
#5
2.6%
#6
2.4%
#7
2.1%
#8
2.0%
#9
1.9%
#10
1.8%
What zip code has the Highest Percentage of Population Employed in Real Estate, Rental & Leasing in Omaha, NE?
68142 has the Highest Percentage of Population Employed in Real Estate, Rental & Leasing in Omaha, NE with 3.1%.
What is the Percentage of Population Employed in Real Estate, Rental & Leasing in Omaha, NE?
Percentage of Population Employed in Real Estate, Rental & Leasing in Omaha is 1.6%.
What is the Percentage of Population Employed in Real Estate, Rental & Leasing in Nebraska?
Percentage of Population Employed in Real Estate, Rental & Leasing in Nebraska is 1.2%.
What is the Percentage of Population Employed in Real Estate, Rental & Leasing in the United States?
Percentage of Population Employed in Real Estate, Rental & Leasing in the United States is 1.9%.