Zip Codes with the Highest Poverty Level Among Children Under the Age of 5 in Omaha, NE

RELATED REPORTS & OPTIONS

Highest Poverty | Child 0-5
Population
Families and Households
Female Fertility
Female Fertility (Unmarried)
Race (Community Size)
Race (Percentage)
Ancestry (Community Size)
AfghanAfricanAlbanianAleutAmericanApacheArabArapahoArgentineanArmenianAustralianAustrianBangladeshiBasqueBelgianBhutaneseBlackfeetBolivianBrazilianBritishBulgarianBurmeseCajunCambodianCanadianCarpatho RusynCentral AmericanCentral American IndianCherokeeChickasawChileanChineseChippewaChoctawColombianComancheCosta RicanCreekCroatianCubanCzechCzechoslovakianDanishDominicanDutchEastern EuropeanEcuadorianEgyptianEnglishEthiopianEuropeanFilipinoFinnishFrenchFrench American IndianFrench CanadianGermanGerman RussianGhanaianGreekGuamanian / ChamorroGuatemalanGuyaneseHaitianHonduranHungarianIcelanderIndian (Asian)IndonesianInupiatIranianIraqiIrishIroquoisIsraeliItalianJamaicanJapaneseJordanianKenyanKiowaKoreanLaotianLatvianLebaneseLithuanianLuxembourgerMacedonianMalaysianMexicanMexican American IndianMoroccanNative HawaiianNavajoNicaraguanNigerianNorthern EuropeanNorwegianPakistaniPalestinianPanamanianPennsylvania GermanPeruvianPolishPortuguesePotawatomiPuebloPuerto RicanRomanianRussianSalvadoranSamoanScandinavianScotch-IrishScottishSeminoleSerbianSiouxSlavicSlovakSloveneSomaliSouth AfricanSouth AmericanSpaniardSpanishSri LankanSubsaharan AfricanSudaneseSwedishSwissSyrianThaiTlingit-HaidaTrinidadian and TobagonianTurkishUkrainianVenezuelanVietnameseWelshWest IndianYugoslavianZimbabwean
Ancestry (Percentage)
AfghanAfricanAlbanianAleutAmericanApacheArabArapahoArgentineanArmenianAustralianAustrianBangladeshiBasqueBelgianBhutaneseBlackfeetBolivianBrazilianBritishBulgarianBurmeseCajunCambodianCanadianCarpatho RusynCentral AmericanCentral American IndianCherokeeChickasawChileanChineseChippewaChoctawColombianComancheCosta RicanCreekCroatianCubanCzechCzechoslovakianDanishDominicanDutchEastern EuropeanEcuadorianEgyptianEnglishEthiopianEuropeanFilipinoFinnishFrenchFrench American IndianFrench CanadianGermanGerman RussianGhanaianGreekGuamanian / ChamorroGuatemalanGuyaneseHaitianHonduranHungarianIcelanderIndian (Asian)IndonesianInupiatIranianIraqiIrishIroquoisIsraeliItalianJamaicanJapaneseJordanianKenyanKiowaKoreanLaotianLatvianLebaneseLithuanianLuxembourgerMacedonianMalaysianMexicanMexican American IndianMoroccanNative HawaiianNavajoNicaraguanNigerianNorthern EuropeanNorwegianPakistaniPalestinianPanamanianPennsylvania GermanPeruvianPolishPortuguesePotawatomiPuebloPuerto RicanRomanianRussianSalvadoranSamoanScandinavianScotch-IrishScottishSeminoleSerbianSiouxSlavicSlovakSloveneSomaliSouth AfricanSouth AmericanSpaniardSpanishSri LankanSubsaharan AfricanSudaneseSwedishSwissSyrianThaiTlingit-HaidaTrinidadian and TobagonianTurkishUkrainianVenezuelanVietnameseWelshWest IndianYugoslavianZimbabwean
Immigrant Origin (Total)
AfghanistanAfricaArgentinaAsiaAustraliaBangladeshBarbadosBelarusBosnia and HerzegovinaBrazilBurma / MyanmarCameroonCanadaCaribbeanCentral AmericaChileChinaColombiaCongoCosta RicaCroatiaCubaCzechoslovakiaDominican RepublicEastern AfricaEastern AsiaEastern EuropeEgyptEl SalvadorEnglandEthiopiaEuropeFranceGermanyGhanaGreeceGuatemalaHondurasHong KongHungaryIndiaIndonesiaIranIraqIrelandIsraelItalyJamaicaJapanJordanKazakhstanKenyaKoreaKuwaitLaosLatin AmericaLatviaLithuaniaMalaysiaMexicoMiddle AfricaMoroccoNepalNetherlandsNicaraguaNigeriaNorthern AfricaNorthern EuropeOceaniaPakistanPanamaPeruPhilippinesPolandPortugalRomaniaRussiaSaudi ArabiaScotlandSierra LeoneSomaliaSouth AfricaSouth AmericaSouth Central AsiaSouth Eastern AsiaSouthern EuropeSpainSri LankaSudanSyriaTaiwanThailandTrinidad and TobagoTurkeyUgandaUkraineVenezuelaVietnamWestern AfricaWestern AsiaWestern EuropeZaireZimbabwe
Immigrant Origin (Percentage)
AfghanistanAfricaArgentinaAsiaAustraliaBangladeshBarbadosBelarusBosnia and HerzegovinaBrazilBurma / MyanmarCameroonCanadaCaribbeanCentral AmericaChileChinaColombiaCongoCosta RicaCroatiaCubaCzechoslovakiaDominican RepublicEastern AfricaEastern AsiaEastern EuropeEgyptEl SalvadorEnglandEthiopiaEuropeFranceGermanyGhanaGreeceGuatemalaHondurasHong KongHungaryIndiaIndonesiaIranIraqIrelandIsraelItalyJamaicaJapanJordanKazakhstanKenyaKoreaKuwaitLaosLatin AmericaLatviaLithuaniaMalaysiaMexicoMiddle AfricaMoroccoNepalNetherlandsNicaraguaNigeriaNorthern AfricaNorthern EuropeOceaniaPakistanPanamaPeruPhilippinesPolandPortugalRomaniaRussiaSaudi ArabiaScotlandSierra LeoneSomaliaSouth AfricaSouth AmericaSouth Central AsiaSouth Eastern AsiaSouthern EuropeSpainSri LankaSudanSyriaTaiwanThailandTrinidad and TobagoTurkeyUgandaUkraineVenezuelaVietnamWestern AfricaWestern AsiaWestern EuropeZaireZimbabwe
Income
Income (Families)
Income (Households)
Poverty
Poverty (Families)
Unemployment
Employment Occupations
Employment Industries
Employer Class
Commute Time
Commute Means
School Enrollment
Education by Degree Field
Occupancy
Finances
Physical Characteristics
Omaha
Compare Zip Codes
Comparison Subject

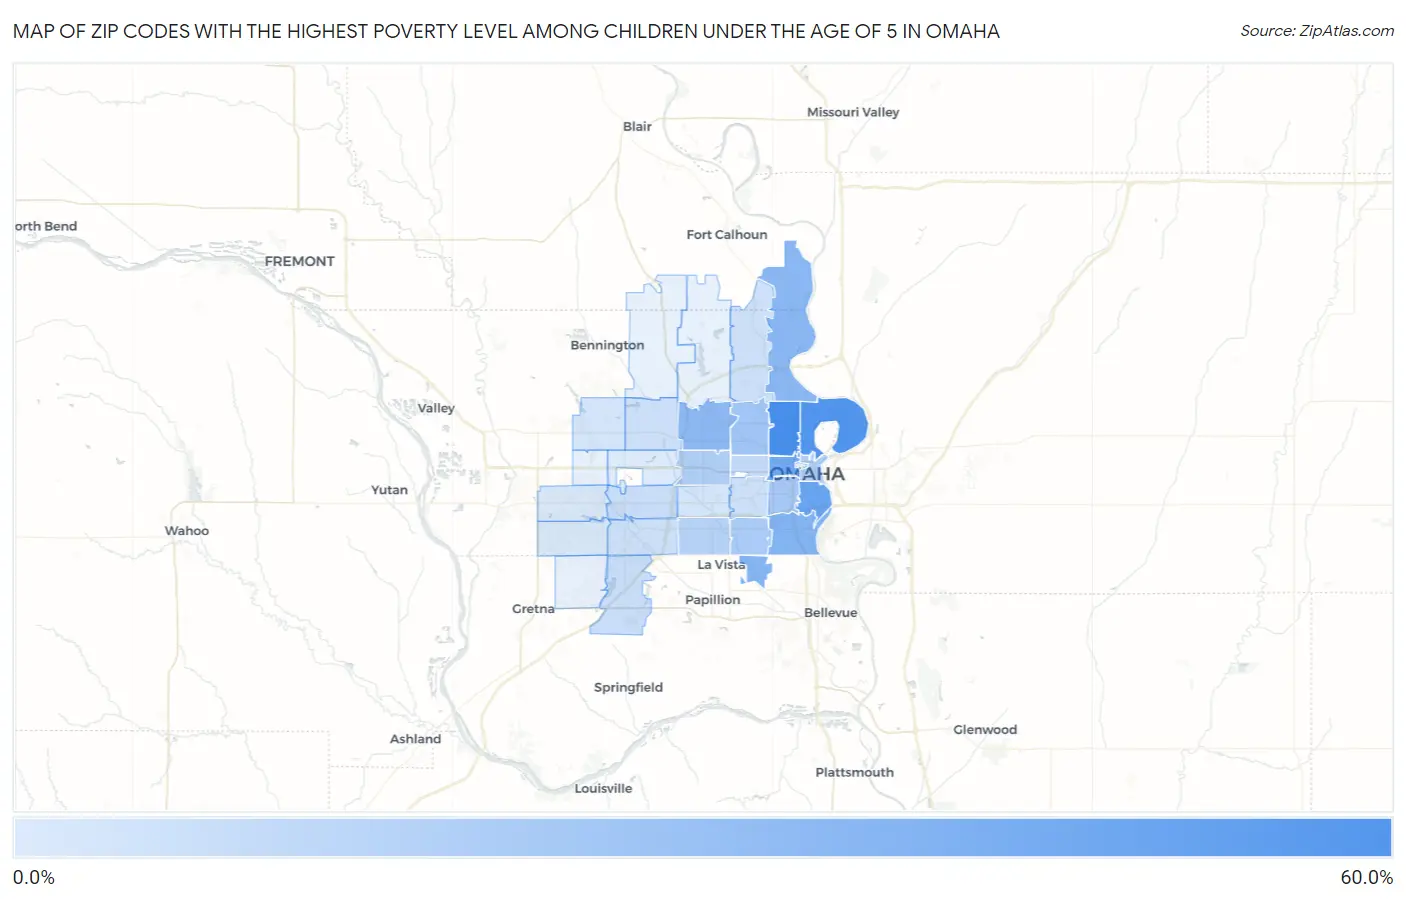
Map of Zip Codes with the Highest Poverty Level Among Children Under the Age of 5 in Omaha

0.0%
60.0%
Zip Codes with the Highest Poverty Level Among Children Under the Age of 5 in Omaha Map

Zip Codes with the Highest Poverty Level Among Children Under the Age of 5 in Omaha, NE

Zip Code Child Poverty vs State vs National
1.6811151.6%13.8%(+37.8)#2418.1%(+33.5)#2,376
2.6811047.2%13.8%(+33.4)#3018.1%(+29.1)#2,903
3.6810837.6%13.8%(+23.8)#4618.1%(+19.5)#4,479
4.6813134.3%13.8%(+20.5)#5518.1%(+16.2)#5,235
5.6810728.4%13.8%(+14.7)#8218.1%(+10.4)#6,841
6.6815727.9%13.8%(+14.1)#8518.1%(+9.84)#6,982
7.6811226.3%13.8%(+12.5)#10018.1%(+8.23)#7,549
8.6813425.8%13.8%(+12.0)#10318.1%(+7.72)#7,717
9.6810419.0%13.8%(+5.19)#13518.1%(+0.897)#10,514
10.6810517.2%13.8%(+3.48)#14518.1%(-0.815)#11,299
11.6811715.8%13.8%(+2.06)#15818.1%(-2.23)#12,000
12.6810214.3%13.8%(+0.514)#16918.1%(-3.78)#12,826
13.6811414.1%13.8%(+0.279)#17718.1%(-4.01)#13,006
14.6812712.1%13.8%(-1.63)#19818.1%(-5.92)#14,132
15.681328.6%13.8%(-5.19)#23918.1%(-9.48)#16,360
16.681386.8%13.8%(-6.97)#25118.1%(-11.3)#17,523
17.681446.5%13.8%(-7.30)#25418.1%(-11.6)#17,753
18.681525.3%13.8%(-8.48)#27718.1%(-12.8)#18,579
19.681645.2%13.8%(-8.55)#27918.1%(-12.8)#18,622
20.681375.0%13.8%(-8.73)#28018.1%(-13.0)#18,740
21.681064.9%13.8%(-8.84)#28318.1%(-13.1)#18,814
22.681243.4%13.8%(-10.3)#30218.1%(-14.6)#19,882
23.681163.1%13.8%(-10.7)#30618.1%(-15.0)#20,120
24.681352.0%13.8%(-11.8)#32018.1%(-16.1)#20,858
25.681301.7%13.8%(-12.0)#32318.1%(-16.3)#21,006
26.681540.72%13.8%(-13.1)#32818.1%(-17.3)#21,534

Common Questions

What are the Top 10 Zip Codes with the Highest Poverty Level Among Children Under the Age of 5 in Omaha, NE?
Top 10 Zip Codes with the Highest Poverty Level Among Children Under the Age of 5 in Omaha, NE are:
#1
51.6%
#2
47.2%
#3
37.6%
#4
34.3%
#5
28.4%
#6
27.9%
#7
26.3%
#8
25.8%
#9
19.0%
#10
17.2%
What zip code has the Highest Poverty Level Among Children Under the Age of 5 in Omaha, NE?
68111 has the Highest Poverty Level Among Children Under the Age of 5 in Omaha, NE with 51.6%.
What is the Poverty Level Among Children Under the Age of 5 in Omaha, NE?
Poverty Level Among Children Under the Age of 5 in Omaha is 16.4%.
What is the Poverty Level Among Children Under the Age of 5 in Nebraska?
Poverty Level Among Children Under the Age of 5 in Nebraska is 13.8%.
What is the Poverty Level Among Children Under the Age of 5 in the United States?
Poverty Level Among Children Under the Age of 5 in the United States is 18.1%.