Zip Codes with the Highest Percentage of Households with Income Below $10,000 in Montana
RELATED REPORTS & OPTIONS
Household Income | $0-10k
Montana
Compare Zip Codes
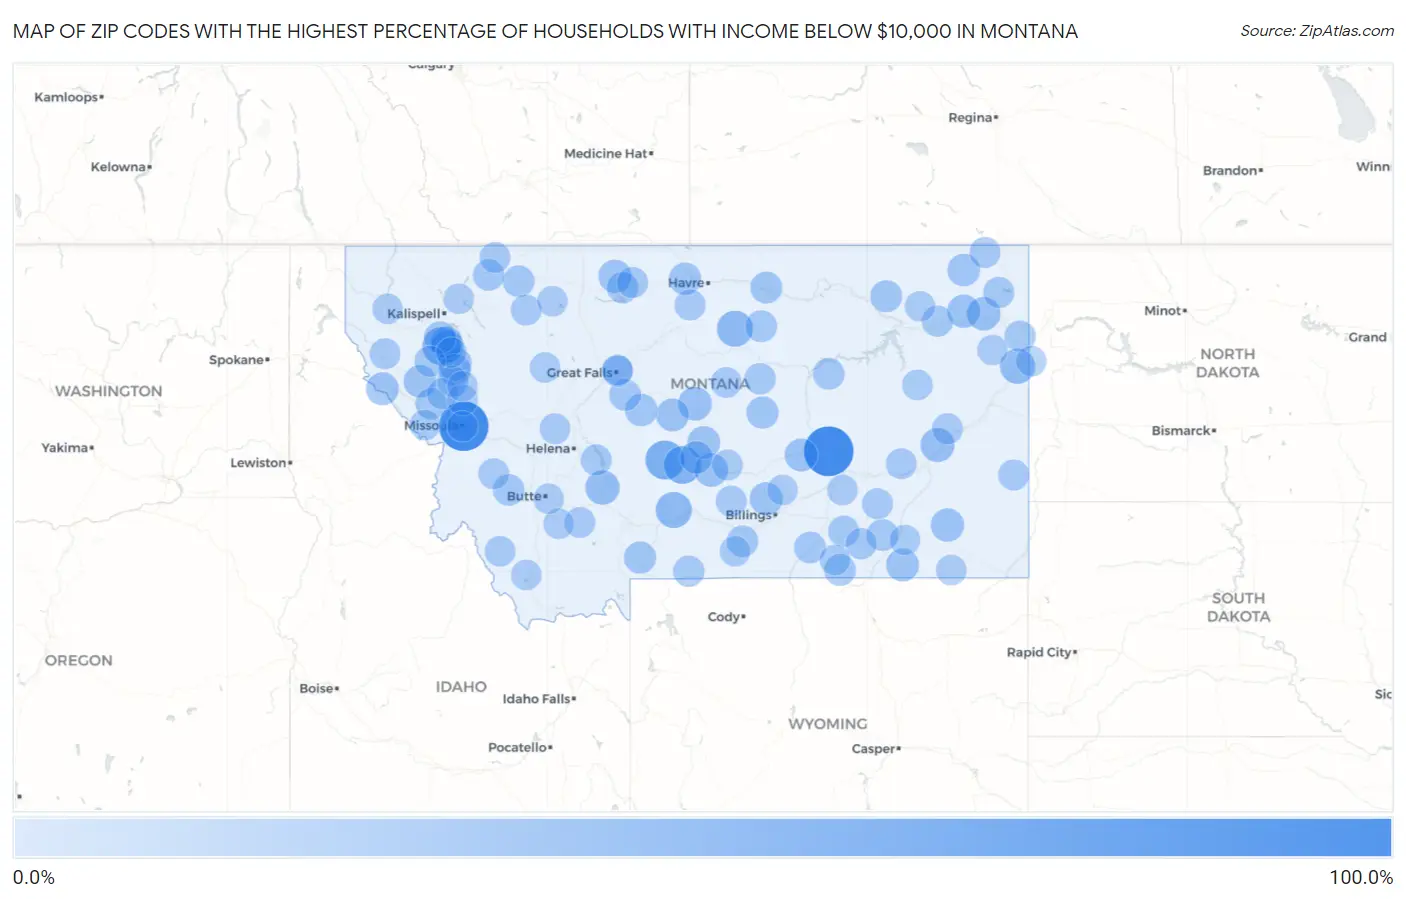
Map of Zip Codes with the Highest Percentage of Households with Income Below $10,000 in Montana
0.0%
100.0%
Zip Codes with the Highest Percentage of Households with Income Below $10,000 in Montana
| Zip Code | Households with Income < $10k | vs State | vs National | |
| 1. | 59812 | 100.0% | 4.6%(+95.4)#1 | 4.9%(+95.1)#8 |
| 2. | 59083 | 100.0% | 4.6%(+95.4)#2 | 4.9%(+95.1)#35 |
| 3. | 59053 | 47.7% | 4.6%(+43.1)#3 | 4.9%(+42.8)#124 |
| 4. | 59915 | 42.6% | 4.6%(+38.0)#4 | 4.9%(+37.7)#155 |
| 5. | 59085 | 41.4% | 4.6%(+36.8)#5 | 4.9%(+36.5)#162 |
| 6. | 59535 | 33.3% | 4.6%(+28.7)#6 | 4.9%(+28.4)#256 |
| 7. | 59082 | 33.3% | 4.6%(+28.7)#7 | 4.9%(+28.4)#257 |
| 8. | 59217 | 28.8% | 4.6%(+24.2)#8 | 4.9%(+23.9)#355 |
| 9. | 59643 | 24.8% | 4.6%(+20.2)#9 | 4.9%(+19.9)#497 |
| 10. | 59338 | 23.5% | 4.6%(+18.9)#10 | 4.9%(+18.6)#561 |
| 11. | 59462 | 21.9% | 4.6%(+17.3)#11 | 4.9%(+17.0)#645 |
| 12. | 59213 | 21.0% | 4.6%(+16.4)#12 | 4.9%(+16.1)#708 |
| 13. | 59078 | 20.9% | 4.6%(+16.3)#13 | 4.9%(+16.0)#713 |
| 14. | 59855 | 20.7% | 4.6%(+16.1)#14 | 4.9%(+15.8)#733 |
| 15. | 59343 | 20.0% | 4.6%(+15.4)#15 | 4.9%(+15.1)#802 |
| 16. | 59255 | 19.3% | 4.6%(+14.7)#16 | 4.9%(+14.4)#867 |
| 17. | 59444 | 19.3% | 4.6%(+14.7)#17 | 4.9%(+14.4)#873 |
| 18. | 59002 | 18.9% | 4.6%(+14.3)#18 | 4.9%(+14.0)#914 |
| 19. | 59059 | 18.6% | 4.6%(+14.0)#19 | 4.9%(+13.7)#945 |
| 20. | 59479 | 18.2% | 4.6%(+13.6)#20 | 4.9%(+13.3)#1,002 |
| 21. | 59062 | 18.2% | 4.6%(+13.6)#21 | 4.9%(+13.3)#1,009 |
| 22. | 59842 | 17.9% | 4.6%(+13.3)#22 | 4.9%(+13.0)#1,041 |
| 23. | 59910 | 17.4% | 4.6%(+12.8)#23 | 4.9%(+12.5)#1,105 |
| 24. | 59453 | 17.4% | 4.6%(+12.8)#24 | 4.9%(+12.5)#1,109 |
| 25. | 59036 | 17.2% | 4.6%(+12.6)#25 | 4.9%(+12.3)#1,129 |
| 26. | 59856 | 16.9% | 4.6%(+12.3)#26 | 4.9%(+12.0)#1,180 |
| 27. | 59463 | 16.2% | 4.6%(+11.6)#27 | 4.9%(+11.3)#1,315 |
| 28. | 59222 | 16.0% | 4.6%(+11.4)#28 | 4.9%(+11.1)#1,350 |
| 29. | 59532 | 15.3% | 4.6%(+10.7)#29 | 4.9%(+10.4)#1,470 |
| 30. | 59027 | 14.8% | 4.6%(+10.2)#30 | 4.9%(+9.90)#1,579 |
| 31. | 59032 | 14.4% | 4.6%(+9.80)#31 | 4.9%(+9.50)#1,682 |
| 32. | 59914 | 14.4% | 4.6%(+9.80)#32 | 4.9%(+9.50)#1,684 |
| 33. | 59929 | 14.3% | 4.6%(+9.70)#33 | 4.9%(+9.40)#1,705 |
| 34. | 59864 | 13.9% | 4.6%(+9.30)#34 | 4.9%(+9.00)#1,800 |
| 35. | 59231 | 13.4% | 4.6%(+8.80)#35 | 4.9%(+8.50)#1,964 |
| 36. | 59526 | 13.1% | 4.6%(+8.50)#36 | 4.9%(+8.20)#2,041 |
| 37. | 59043 | 12.9% | 4.6%(+8.30)#37 | 4.9%(+8.00)#2,128 |
| 38. | 59075 | 12.7% | 4.6%(+8.10)#38 | 4.9%(+7.80)#2,222 |
| 39. | 59846 | 12.6% | 4.6%(+8.00)#39 | 4.9%(+7.70)#2,240 |
| 40. | 59527 | 12.4% | 4.6%(+7.80)#40 | 4.9%(+7.50)#2,312 |
| 41. | 59089 | 12.2% | 4.6%(+7.60)#41 | 4.9%(+7.30)#2,391 |
| 42. | 59417 | 12.0% | 4.6%(+7.40)#42 | 4.9%(+7.10)#2,462 |
| 43. | 59434 | 12.0% | 4.6%(+7.40)#43 | 4.9%(+7.10)#2,488 |
| 44. | 59318 | 12.0% | 4.6%(+7.40)#44 | 4.9%(+7.10)#2,495 |
| 45. | 59480 | 11.5% | 4.6%(+6.90)#45 | 4.9%(+6.60)#2,717 |
| 46. | 59013 | 11.4% | 4.6%(+6.80)#46 | 4.9%(+6.50)#2,777 |
| 47. | 59711 | 11.3% | 4.6%(+6.70)#47 | 4.9%(+6.40)#2,793 |
| 48. | 59471 | 11.0% | 4.6%(+6.40)#48 | 4.9%(+6.10)#2,990 |
| 49. | 59022 | 10.8% | 4.6%(+6.20)#49 | 4.9%(+5.90)#3,087 |
| 50. | 59461 | 10.7% | 4.6%(+6.10)#50 | 4.9%(+5.80)#3,166 |
| 51. | 59020 | 10.4% | 4.6%(+5.80)#51 | 4.9%(+5.50)#3,356 |
| 52. | 59221 | 10.0% | 4.6%(+5.40)#52 | 4.9%(+5.10)#3,602 |
| 53. | 59201 | 9.8% | 4.6%(+5.20)#53 | 4.9%(+4.90)#3,743 |
| 54. | 59016 | 9.5% | 4.6%(+4.90)#54 | 4.9%(+4.60)#3,999 |
| 55. | 59242 | 9.4% | 4.6%(+4.80)#55 | 4.9%(+4.50)#4,090 |
| 56. | 59522 | 9.3% | 4.6%(+4.70)#56 | 4.9%(+4.40)#4,157 |
| 57. | 59845 | 9.3% | 4.6%(+4.70)#57 | 4.9%(+4.40)#4,159 |
| 58. | 59831 | 9.3% | 4.6%(+4.70)#58 | 4.9%(+4.40)#4,179 |
| 59. | 59647 | 9.3% | 4.6%(+4.70)#59 | 4.9%(+4.40)#4,182 |
| 60. | 59521 | 9.2% | 4.6%(+4.60)#60 | 4.9%(+4.30)#4,242 |
| 61. | 59323 | 9.2% | 4.6%(+4.60)#61 | 4.9%(+4.30)#4,250 |
| 62. | 59313 | 9.2% | 4.6%(+4.60)#62 | 4.9%(+4.30)#4,251 |
| 63. | 59824 | 9.2% | 4.6%(+4.60)#63 | 4.9%(+4.30)#4,266 |
| 64. | 59821 | 9.1% | 4.6%(+4.50)#64 | 4.9%(+4.20)#4,339 |
| 65. | 59067 | 9.1% | 4.6%(+4.50)#65 | 4.9%(+4.20)#4,384 |
| 66. | 59252 | 9.1% | 4.6%(+4.50)#66 | 4.9%(+4.20)#4,388 |
| 67. | 59448 | 8.9% | 4.6%(+4.30)#67 | 4.9%(+4.00)#4,579 |
| 68. | 59401 | 8.7% | 4.6%(+4.10)#68 | 4.9%(+3.80)#4,741 |
| 69. | 59074 | 8.6% | 4.6%(+4.00)#69 | 4.9%(+3.70)#4,897 |
| 70. | 59349 | 8.5% | 4.6%(+3.90)#70 | 4.9%(+3.60)#4,993 |
| 71. | 59873 | 8.4% | 4.6%(+3.80)#71 | 4.9%(+3.50)#5,084 |
| 72. | 59858 | 8.3% | 4.6%(+3.70)#72 | 4.9%(+3.40)#5,236 |
| 73. | 59747 | 8.3% | 4.6%(+3.70)#73 | 4.9%(+3.40)#5,278 |
| 74. | 59347 | 8.2% | 4.6%(+3.60)#74 | 4.9%(+3.30)#5,394 |
| 75. | 59411 | 7.9% | 4.6%(+3.30)#75 | 4.9%(+3.00)#5,770 |
| 76. | 59451 | 7.9% | 4.6%(+3.30)#76 | 4.9%(+3.00)#5,784 |
| 77. | 59801 | 7.6% | 4.6%(+3.00)#77 | 4.9%(+2.70)#6,063 |
| 78. | 59414 | 7.6% | 4.6%(+3.00)#78 | 4.9%(+2.70)#6,172 |
| 79. | 59633 | 7.6% | 4.6%(+3.00)#79 | 4.9%(+2.70)#6,181 |
| 80. | 59736 | 7.6% | 4.6%(+3.00)#80 | 4.9%(+2.70)#6,185 |
| 81. | 59214 | 7.4% | 4.6%(+2.80)#81 | 4.9%(+2.50)#6,467 |
| 82. | 59270 | 7.2% | 4.6%(+2.60)#82 | 4.9%(+2.30)#6,679 |
| 83. | 59820 | 7.2% | 4.6%(+2.60)#83 | 4.9%(+2.30)#6,724 |
| 84. | 59751 | 7.1% | 4.6%(+2.50)#84 | 4.9%(+2.20)#6,928 |
| 85. | 59050 | 6.9% | 4.6%(+2.30)#85 | 4.9%(+2.00)#7,238 |
| 86. | 59486 | 6.9% | 4.6%(+2.30)#86 | 4.9%(+2.00)#7,249 |
| 87. | 59410 | 6.8% | 4.6%(+2.20)#87 | 4.9%(+1.90)#7,488 |
| 88. | 59919 | 6.7% | 4.6%(+2.10)#88 | 4.9%(+1.80)#7,661 |
| 89. | 59038 | 6.7% | 4.6%(+2.10)#89 | 4.9%(+1.80)#7,670 |
| 90. | 59314 | 6.7% | 4.6%(+2.10)#90 | 4.9%(+1.80)#7,689 |
| 91. | 59701 | 6.6% | 4.6%(+2.00)#91 | 4.9%(+1.70)#7,716 |
| 92. | 59865 | 6.6% | 4.6%(+2.00)#92 | 4.9%(+1.70)#7,803 |
| 93. | 59070 | 6.6% | 4.6%(+2.00)#93 | 4.9%(+1.70)#7,843 |
| 94. | 59860 | 6.5% | 4.6%(+1.90)#94 | 4.9%(+1.60)#7,950 |
| 95. | 59725 | 6.5% | 4.6%(+1.90)#95 | 4.9%(+1.60)#7,965 |
| 96. | 59079 | 6.5% | 4.6%(+1.90)#96 | 4.9%(+1.60)#8,004 |
| 97. | 59225 | 6.5% | 4.6%(+1.90)#97 | 4.9%(+1.60)#8,058 |
| 98. | 59243 | 6.5% | 4.6%(+1.90)#98 | 4.9%(+1.60)#8,069 |
| 99. | 59923 | 6.4% | 4.6%(+1.80)#99 | 4.9%(+1.50)#8,167 |
| 100. | 59003 | 6.4% | 4.6%(+1.80)#100 | 4.9%(+1.50)#8,254 |
Common Questions
What are the Top 10 Zip Codes with the Highest Percentage of Households with Income Below $10,000 in Montana?
Top 10 Zip Codes with the Highest Percentage of Households with Income Below $10,000 in Montana are:
What zip code has the Highest Percentage of Households with Income Below $10,000 in Montana?
59812 has the Highest Percentage of Households with Income Below $10,000 in Montana with 100.0%.
What is the Percentage of Households with Income Below $10,000 in the State of Montana?
Percentage of Households with Income Below $10,000 in Montana is 4.6%.
What is the Percentage of Households with Income Below $10,000 in the United States?
Percentage of Households with Income Below $10,000 in the United States is 4.9%.