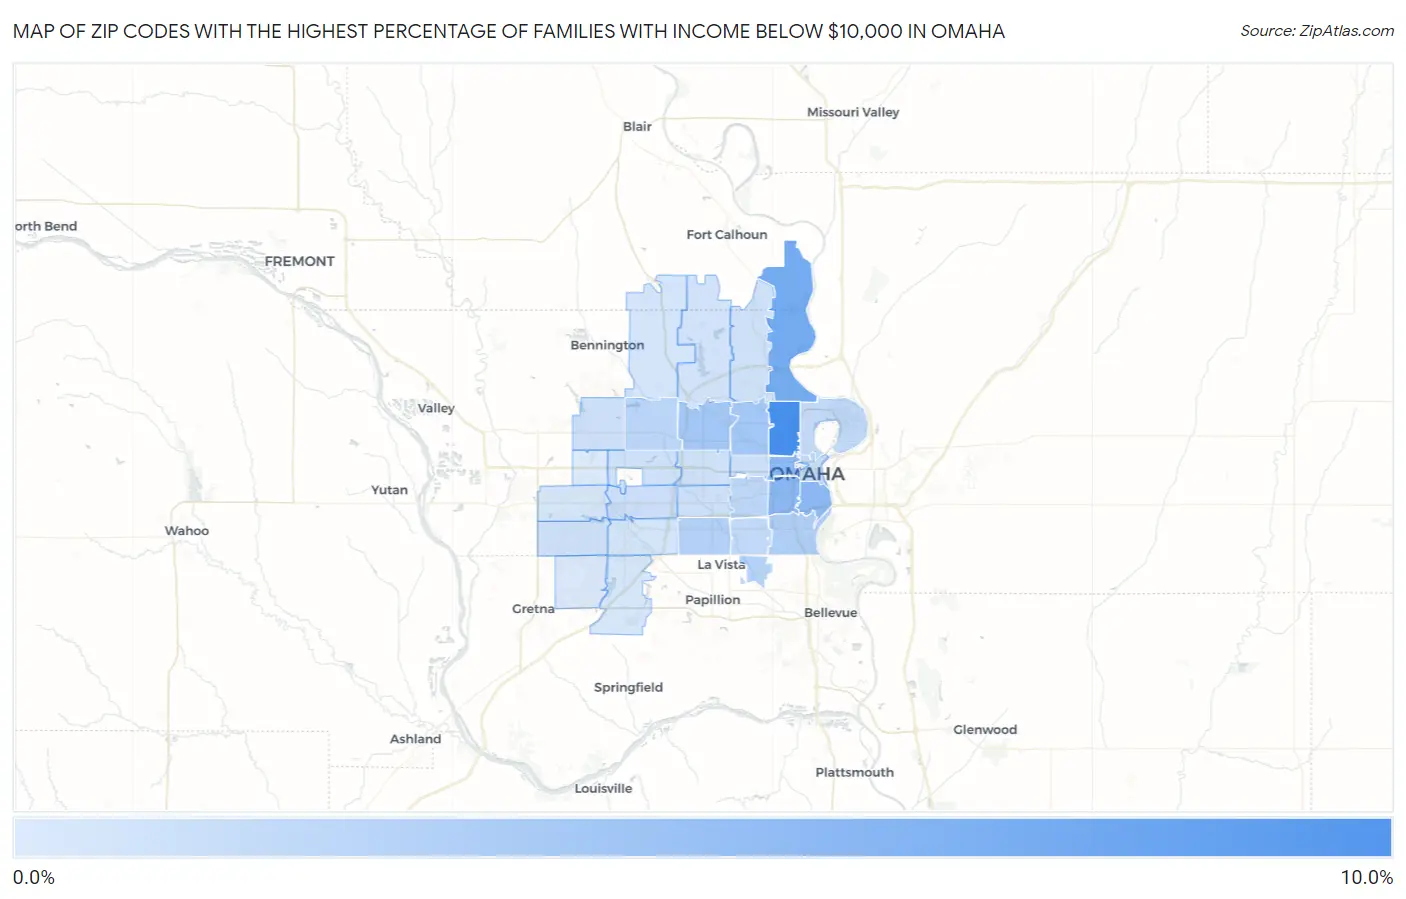
Zip Codes with the Highest Percentage of Families with Income Below $10,000 in Omaha, NE
RELATED REPORTS & OPTIONS
Family Income | $0-10k
Omaha
Compare Zip Codes
Map of Zip Codes with the Highest Percentage of Families with Income Below $10,000 in Omaha
0.30%
8.7%
Zip Codes with the Highest Percentage of Families with Income Below $10,000 in Omaha, NE
| Zip Code | Families with Income < $10k | vs State | vs National | |
| 1. | 68111 | 8.7% | 2.1%(+6.60)#21 | 3.1%(+5.60)#2,510 |
| 2. | 68112 | 6.1% | 2.1%(+4.00)#37 | 3.1%(+3.00)#4,567 |
| 3. | 68105 | 4.9% | 2.1%(+2.80)#63 | 3.1%(+1.80)#6,284 |
| 4. | 68108 | 4.7% | 2.1%(+2.60)#71 | 3.1%(+1.60)#6,664 |
| 5. | 68131 | 4.6% | 2.1%(+2.50)#74 | 3.1%(+1.50)#6,861 |
| 6. | 68134 | 3.5% | 2.1%(+1.40)#108 | 3.1%(+0.400)#9,519 |
| 7. | 68104 | 3.4% | 2.1%(+1.30)#113 | 3.1%(+0.300)#9,789 |
| 8. | 68107 | 2.8% | 2.1%(+0.700)#139 | 3.1%(-0.300)#11,878 |
| 9. | 68127 | 2.6% | 2.1%(+0.500)#147 | 3.1%(-0.500)#12,720 |
| 10. | 68157 | 2.4% | 2.1%(+0.300)#156 | 3.1%(-0.700)#13,653 |
| 11. | 68164 | 2.2% | 2.1%(+0.100)#167 | 3.1%(-0.900)#14,386 |
| 12. | 68106 | 2.1% | 2.1%(=0.000)#173 | 3.1%(-1.000)#14,903 |
| 13. | 68110 | 1.8% | 2.1%(-0.300)#203 | 3.1%(-1.30)#16,437 |
| 14. | 68117 | 1.8% | 2.1%(-0.300)#205 | 3.1%(-1.30)#16,447 |
| 15. | 68102 | 1.6% | 2.1%(-0.500)#217 | 3.1%(-1.50)#17,397 |
| 16. | 68144 | 1.3% | 2.1%(-0.800)#238 | 3.1%(-1.80)#18,772 |
| 17. | 68116 | 1.2% | 2.1%(-0.900)#244 | 3.1%(-1.90)#19,250 |
| 18. | 68124 | 1.2% | 2.1%(-0.900)#245 | 3.1%(-1.90)#19,371 |
| 19. | 68132 | 1.2% | 2.1%(-0.900)#246 | 3.1%(-1.90)#19,372 |
| 20. | 68135 | 1.1% | 2.1%(-1.000)#253 | 3.1%(-2.00)#19,754 |
| 21. | 68114 | 1.1% | 2.1%(-1.000)#255 | 3.1%(-2.00)#19,823 |
| 22. | 68154 | 1.0% | 2.1%(-1.10)#267 | 3.1%(-2.10)#20,297 |
| 23. | 68152 | 1.0% | 2.1%(-1.10)#269 | 3.1%(-2.10)#20,439 |
| 24. | 68122 | 0.90% | 2.1%(-1.20)#279 | 3.1%(-2.20)#20,867 |
| 25. | 68137 | 0.80% | 2.1%(-1.30)#286 | 3.1%(-2.30)#21,268 |
| 26. | 68142 | 0.80% | 2.1%(-1.30)#288 | 3.1%(-2.30)#21,424 |
| 27. | 68130 | 0.70% | 2.1%(-1.40)#298 | 3.1%(-2.40)#21,728 |
| 28. | 68138 | 0.70% | 2.1%(-1.40)#301 | 3.1%(-2.40)#21,801 |
| 29. | 68136 | 0.40% | 2.1%(-1.70)#334 | 3.1%(-2.70)#23,041 |
| 30. | 68118 | 0.30% | 2.1%(-1.80)#340 | 3.1%(-2.80)#23,451 |
1
Common Questions
What are the Top 10 Zip Codes with the Highest Percentage of Families with Income Below $10,000 in Omaha, NE?
Top 10 Zip Codes with the Highest Percentage of Families with Income Below $10,000 in Omaha, NE are:
What zip code has the Highest Percentage of Families with Income Below $10,000 in Omaha, NE?
68111 has the Highest Percentage of Families with Income Below $10,000 in Omaha, NE with 8.7%.
What is the Percentage of Families with Income Below $10,000 in Omaha, NE?
Percentage of Families with Income Below $10,000 in Omaha is 2.4%.
What is the Percentage of Families with Income Below $10,000 in Nebraska?
Percentage of Families with Income Below $10,000 in Nebraska is 2.1%.
What is the Percentage of Families with Income Below $10,000 in the United States?
Percentage of Families with Income Below $10,000 in the United States is 3.1%.