Zip Codes with the Highest Percentage of Households with Income Below $10,000 in Ohio
RELATED REPORTS & OPTIONS
Household Income | $0-10k
Ohio
Compare Zip Codes
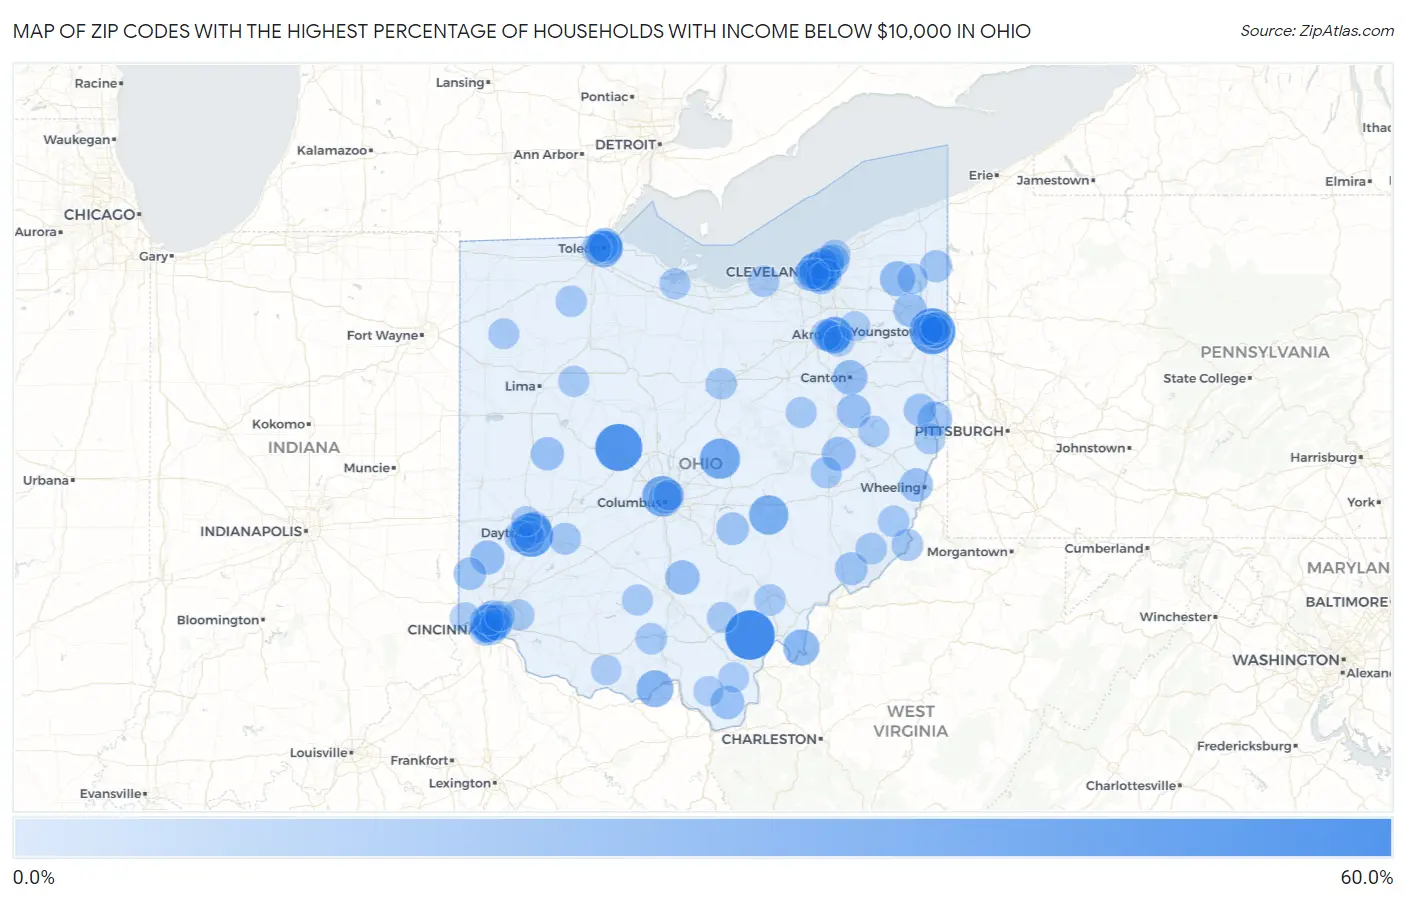
Map of Zip Codes with the Highest Percentage of Households with Income Below $10,000 in Ohio
0.0%
60.0%
Zip Codes with the Highest Percentage of Households with Income Below $10,000 in Ohio
| Zip Code | Households with Income < $10k | vs State | vs National | |
| 1. | 45741 | 53.0% | 5.2%(+47.8)#1 | 4.9%(+48.1)#98 |
| 2. | 43007 | 47.4% | 5.2%(+42.2)#2 | 4.9%(+42.5)#128 |
| 3. | 44503 | 44.6% | 5.2%(+39.4)#3 | 4.9%(+39.7)#139 |
| 4. | 45469 | 40.0% | 5.2%(+34.8)#4 | 4.9%(+35.1)#172 |
| 5. | 43210 | 32.9% | 5.2%(+27.7)#5 | 4.9%(+28.0)#269 |
| 6. | 43027 | 32.3% | 5.2%(+27.1)#6 | 4.9%(+27.4)#283 |
| 7. | 43791 | 30.3% | 5.2%(+25.1)#7 | 4.9%(+25.4)#325 |
| 8. | 44115 | 29.9% | 5.2%(+24.7)#8 | 4.9%(+25.0)#331 |
| 9. | 43604 | 26.0% | 5.2%(+20.8)#9 | 4.9%(+21.1)#439 |
| 10. | 45225 | 26.0% | 5.2%(+20.8)#10 | 4.9%(+21.1)#440 |
| 11. | 45630 | 25.0% | 5.2%(+19.8)#11 | 4.9%(+20.1)#487 |
| 12. | 45770 | 23.3% | 5.2%(+18.1)#12 | 4.9%(+18.4)#573 |
| 13. | 44308 | 21.8% | 5.2%(+16.6)#13 | 4.9%(+16.9)#648 |
| 14. | 44439 | 21.1% | 5.2%(+15.9)#14 | 4.9%(+16.2)#700 |
| 15. | 44104 | 20.7% | 5.2%(+15.5)#15 | 4.9%(+15.8)#729 |
| 16. | 44702 | 20.3% | 5.2%(+15.1)#16 | 4.9%(+15.4)#775 |
| 17. | 45644 | 19.5% | 5.2%(+14.3)#17 | 4.9%(+14.6)#841 |
| 18. | 43961 | 19.3% | 5.2%(+14.1)#18 | 4.9%(+14.4)#872 |
| 19. | 44304 | 19.1% | 5.2%(+13.9)#19 | 4.9%(+14.2)#894 |
| 20. | 43608 | 19.0% | 5.2%(+13.8)#20 | 4.9%(+14.1)#898 |
| 21. | 45070 | 18.9% | 5.2%(+13.7)#21 | 4.9%(+14.0)#916 |
| 22. | 44103 | 18.6% | 5.2%(+13.4)#22 | 4.9%(+13.7)#936 |
| 23. | 44656 | 18.5% | 5.2%(+13.3)#23 | 4.9%(+13.6)#949 |
| 24. | 43837 | 18.4% | 5.2%(+13.2)#24 | 4.9%(+13.5)#960 |
| 25. | 44106 | 18.1% | 5.2%(+12.9)#25 | 4.9%(+13.2)#1,010 |
| 26. | 45232 | 18.1% | 5.2%(+12.9)#26 | 4.9%(+13.2)#1,011 |
| 27. | 44117 | 17.8% | 5.2%(+12.6)#27 | 4.9%(+12.9)#1,044 |
| 28. | 45696 | 17.7% | 5.2%(+12.5)#28 | 4.9%(+12.8)#1,061 |
| 29. | 44485 | 17.6% | 5.2%(+12.4)#29 | 4.9%(+12.7)#1,068 |
| 30. | 45229 | 17.5% | 5.2%(+12.3)#30 | 4.9%(+12.6)#1,088 |
| 31. | 43934 | 17.5% | 5.2%(+12.3)#31 | 4.9%(+12.6)#1,095 |
| 32. | 44112 | 17.2% | 5.2%(+12.0)#32 | 4.9%(+12.3)#1,123 |
| 33. | 45353 | 17.1% | 5.2%(+11.9)#33 | 4.9%(+12.2)#1,153 |
| 34. | 43605 | 17.0% | 5.2%(+11.8)#34 | 4.9%(+12.1)#1,160 |
| 35. | 44114 | 16.4% | 5.2%(+11.2)#35 | 4.9%(+11.5)#1,261 |
| 36. | 44510 | 16.2% | 5.2%(+11.0)#36 | 4.9%(+11.3)#1,301 |
| 37. | 45788 | 16.2% | 5.2%(+11.0)#37 | 4.9%(+11.3)#1,306 |
| 38. | 44502 | 16.0% | 5.2%(+10.8)#38 | 4.9%(+11.1)#1,335 |
| 39. | 44504 | 15.9% | 5.2%(+10.7)#39 | 4.9%(+11.0)#1,358 |
| 40. | 43150 | 15.9% | 5.2%(+10.7)#40 | 4.9%(+11.0)#1,363 |
| 41. | 43930 | 15.8% | 5.2%(+10.6)#41 | 4.9%(+10.9)#1,381 |
| 42. | 44127 | 15.7% | 5.2%(+10.5)#42 | 4.9%(+10.8)#1,396 |
| 43. | 43201 | 15.5% | 5.2%(+10.3)#43 | 4.9%(+10.6)#1,422 |
| 44. | 45056 | 15.5% | 5.2%(+10.3)#44 | 4.9%(+10.6)#1,423 |
| 45. | 45219 | 14.8% | 5.2%(+9.60)#45 | 4.9%(+9.90)#1,562 |
| 46. | 44311 | 14.8% | 5.2%(+9.60)#46 | 4.9%(+9.90)#1,568 |
| 47. | 45203 | 14.8% | 5.2%(+9.60)#47 | 4.9%(+9.90)#1,571 |
| 48. | 44093 | 14.6% | 5.2%(+9.40)#48 | 4.9%(+9.70)#1,632 |
| 49. | 45214 | 14.5% | 5.2%(+9.30)#49 | 4.9%(+9.60)#1,647 |
| 50. | 45404 | 14.3% | 5.2%(+9.10)#50 | 4.9%(+9.40)#1,690 |
| 51. | 44506 | 14.1% | 5.2%(+8.90)#51 | 4.9%(+9.20)#1,749 |
| 52. | 44110 | 14.0% | 5.2%(+8.80)#52 | 4.9%(+9.10)#1,762 |
| 53. | 45384 | 14.0% | 5.2%(+8.80)#53 | 4.9%(+9.10)#1,770 |
| 54. | 43931 | 14.0% | 5.2%(+8.80)#54 | 4.9%(+9.10)#1,791 |
| 55. | 44509 | 13.5% | 5.2%(+8.30)#55 | 4.9%(+8.60)#1,912 |
| 56. | 44307 | 13.5% | 5.2%(+8.30)#56 | 4.9%(+8.60)#1,917 |
| 57. | 44055 | 13.4% | 5.2%(+8.20)#57 | 4.9%(+8.50)#1,943 |
| 58. | 45661 | 13.4% | 5.2%(+8.20)#58 | 4.9%(+8.50)#1,946 |
| 59. | 45734 | 13.4% | 5.2%(+8.20)#59 | 4.9%(+8.50)#1,969 |
| 60. | 45701 | 13.3% | 5.2%(+8.10)#60 | 4.9%(+8.40)#1,974 |
| 61. | 43620 | 13.3% | 5.2%(+8.10)#61 | 4.9%(+8.40)#1,984 |
| 62. | 44320 | 13.2% | 5.2%(+8.00)#62 | 4.9%(+8.30)#1,998 |
| 63. | 45402 | 13.2% | 5.2%(+8.00)#63 | 4.9%(+8.30)#2,003 |
| 64. | 45417 | 13.1% | 5.2%(+7.90)#64 | 4.9%(+8.20)#2,024 |
| 65. | 43716 | 13.1% | 5.2%(+7.90)#65 | 4.9%(+8.20)#2,045 |
| 66. | 43541 | 13.1% | 5.2%(+7.90)#66 | 4.9%(+8.20)#2,058 |
| 67. | 43749 | 13.0% | 5.2%(+7.80)#67 | 4.9%(+8.10)#2,083 |
| 68. | 44102 | 12.9% | 5.2%(+7.70)#68 | 4.9%(+8.00)#2,107 |
| 69. | 45204 | 12.9% | 5.2%(+7.70)#69 | 4.9%(+8.00)#2,120 |
| 70. | 44108 | 12.8% | 5.2%(+7.60)#70 | 4.9%(+7.90)#2,155 |
| 71. | 45205 | 12.8% | 5.2%(+7.60)#71 | 4.9%(+7.90)#2,158 |
| 72. | 45111 | 12.8% | 5.2%(+7.60)#72 | 4.9%(+7.90)#2,183 |
| 73. | 44505 | 12.7% | 5.2%(+7.50)#73 | 4.9%(+7.80)#2,195 |
| 74. | 44902 | 12.7% | 5.2%(+7.50)#74 | 4.9%(+7.80)#2,200 |
| 75. | 45810 | 12.5% | 5.2%(+7.30)#75 | 4.9%(+7.60)#2,259 |
| 76. | 45634 | 12.5% | 5.2%(+7.30)#76 | 4.9%(+7.60)#2,265 |
| 77. | 44105 | 12.4% | 5.2%(+7.20)#77 | 4.9%(+7.50)#2,293 |
| 78. | 45681 | 12.4% | 5.2%(+7.20)#78 | 4.9%(+7.50)#2,309 |
| 79. | 45206 | 12.3% | 5.2%(+7.10)#79 | 4.9%(+7.40)#2,334 |
| 80. | 44695 | 12.3% | 5.2%(+7.10)#80 | 4.9%(+7.40)#2,347 |
| 81. | 44610 | 12.3% | 5.2%(+7.10)#81 | 4.9%(+7.40)#2,357 |
| 82. | 43464 | 12.2% | 5.2%(+7.00)#82 | 4.9%(+7.30)#2,386 |
| 83. | 43952 | 12.1% | 5.2%(+6.90)#83 | 4.9%(+7.20)#2,411 |
| 84. | 44120 | 12.0% | 5.2%(+6.80)#84 | 4.9%(+7.10)#2,454 |
| 85. | 43211 | 12.0% | 5.2%(+6.80)#85 | 4.9%(+7.10)#2,456 |
| 86. | 44450 | 12.0% | 5.2%(+6.80)#86 | 4.9%(+7.10)#2,473 |
| 87. | 45861 | 12.0% | 5.2%(+6.80)#87 | 4.9%(+7.10)#2,490 |
| 88. | 44132 | 11.9% | 5.2%(+6.70)#88 | 4.9%(+7.00)#2,509 |
| 89. | 45223 | 11.7% | 5.2%(+6.50)#89 | 4.9%(+6.80)#2,587 |
| 90. | 45409 | 11.6% | 5.2%(+6.40)#90 | 4.9%(+6.70)#2,630 |
| 91. | 44113 | 11.3% | 5.2%(+6.10)#91 | 4.9%(+6.40)#2,788 |
| 92. | 45658 | 11.2% | 5.2%(+6.00)#92 | 4.9%(+6.30)#2,864 |
| 93. | 44306 | 11.1% | 5.2%(+5.90)#93 | 4.9%(+6.20)#2,886 |
| 94. | 45237 | 11.0% | 5.2%(+5.80)#94 | 4.9%(+6.10)#2,951 |
| 95. | 45659 | 10.9% | 5.2%(+5.70)#95 | 4.9%(+6.00)#3,023 |
| 96. | 45033 | 10.9% | 5.2%(+5.70)#96 | 4.9%(+6.00)#3,044 |
| 97. | 44240 | 10.8% | 5.2%(+5.60)#97 | 4.9%(+5.90)#3,056 |
| 98. | 43607 | 10.7% | 5.2%(+5.50)#98 | 4.9%(+5.80)#3,118 |
| 99. | 45414 | 10.7% | 5.2%(+5.50)#99 | 4.9%(+5.80)#3,120 |
| 100. | 45693 | 10.7% | 5.2%(+5.50)#100 | 4.9%(+5.80)#3,129 |
Common Questions
What are the Top 10 Zip Codes with the Highest Percentage of Households with Income Below $10,000 in Ohio?
Top 10 Zip Codes with the Highest Percentage of Households with Income Below $10,000 in Ohio are:
What zip code has the Highest Percentage of Households with Income Below $10,000 in Ohio?
45741 has the Highest Percentage of Households with Income Below $10,000 in Ohio with 53.0%.
What is the Percentage of Households with Income Below $10,000 in the State of Ohio?
Percentage of Households with Income Below $10,000 in Ohio is 5.2%.
What is the Percentage of Households with Income Below $10,000 in the United States?
Percentage of Households with Income Below $10,000 in the United States is 4.9%.