Zip Codes with the Highest Percentage of Population with a Degree in Arts and Humanities in Omaha, NE

RELATED REPORTS & OPTIONS

Arts and Humanities
Population
Families and Households
Female Fertility
Female Fertility (Unmarried)
Race (Community Size)
Race (Percentage)
Ancestry (Community Size)
AfghanAfricanAlbanianAleutAmericanApacheArabArapahoArgentineanArmenianAustralianAustrianBangladeshiBasqueBelgianBhutaneseBlackfeetBolivianBrazilianBritishBulgarianBurmeseCajunCambodianCanadianCarpatho RusynCentral AmericanCentral American IndianCherokeeChickasawChileanChineseChippewaChoctawColombianComancheCosta RicanCreekCroatianCubanCzechCzechoslovakianDanishDominicanDutchEastern EuropeanEcuadorianEgyptianEnglishEthiopianEuropeanFilipinoFinnishFrenchFrench American IndianFrench CanadianGermanGerman RussianGhanaianGreekGuamanian / ChamorroGuatemalanGuyaneseHaitianHonduranHungarianIcelanderIndian (Asian)IndonesianInupiatIranianIraqiIrishIroquoisIsraeliItalianJamaicanJapaneseJordanianKenyanKiowaKoreanLaotianLatvianLebaneseLithuanianLuxembourgerMacedonianMalaysianMexicanMexican American IndianMoroccanNative HawaiianNavajoNicaraguanNigerianNorthern EuropeanNorwegianPakistaniPalestinianPanamanianPennsylvania GermanPeruvianPolishPortuguesePotawatomiPuebloPuerto RicanRomanianRussianSalvadoranSamoanScandinavianScotch-IrishScottishSeminoleSerbianSiouxSlavicSlovakSloveneSomaliSouth AfricanSouth AmericanSpaniardSpanishSri LankanSubsaharan AfricanSudaneseSwedishSwissSyrianThaiTlingit-HaidaTrinidadian and TobagonianTurkishUkrainianVenezuelanVietnameseWelshWest IndianYugoslavianZimbabwean
Ancestry (Percentage)
AfghanAfricanAlbanianAleutAmericanApacheArabArapahoArgentineanArmenianAustralianAustrianBangladeshiBasqueBelgianBhutaneseBlackfeetBolivianBrazilianBritishBulgarianBurmeseCajunCambodianCanadianCarpatho RusynCentral AmericanCentral American IndianCherokeeChickasawChileanChineseChippewaChoctawColombianComancheCosta RicanCreekCroatianCubanCzechCzechoslovakianDanishDominicanDutchEastern EuropeanEcuadorianEgyptianEnglishEthiopianEuropeanFilipinoFinnishFrenchFrench American IndianFrench CanadianGermanGerman RussianGhanaianGreekGuamanian / ChamorroGuatemalanGuyaneseHaitianHonduranHungarianIcelanderIndian (Asian)IndonesianInupiatIranianIraqiIrishIroquoisIsraeliItalianJamaicanJapaneseJordanianKenyanKiowaKoreanLaotianLatvianLebaneseLithuanianLuxembourgerMacedonianMalaysianMexicanMexican American IndianMoroccanNative HawaiianNavajoNicaraguanNigerianNorthern EuropeanNorwegianPakistaniPalestinianPanamanianPennsylvania GermanPeruvianPolishPortuguesePotawatomiPuebloPuerto RicanRomanianRussianSalvadoranSamoanScandinavianScotch-IrishScottishSeminoleSerbianSiouxSlavicSlovakSloveneSomaliSouth AfricanSouth AmericanSpaniardSpanishSri LankanSubsaharan AfricanSudaneseSwedishSwissSyrianThaiTlingit-HaidaTrinidadian and TobagonianTurkishUkrainianVenezuelanVietnameseWelshWest IndianYugoslavianZimbabwean
Immigrant Origin (Total)
AfghanistanAfricaArgentinaAsiaAustraliaBangladeshBarbadosBelarusBosnia and HerzegovinaBrazilBurma / MyanmarCameroonCanadaCaribbeanCentral AmericaChileChinaColombiaCongoCosta RicaCroatiaCubaCzechoslovakiaDominican RepublicEastern AfricaEastern AsiaEastern EuropeEgyptEl SalvadorEnglandEthiopiaEuropeFranceGermanyGhanaGreeceGuatemalaHondurasHong KongHungaryIndiaIndonesiaIranIraqIrelandIsraelItalyJamaicaJapanJordanKazakhstanKenyaKoreaKuwaitLaosLatin AmericaLatviaLithuaniaMalaysiaMexicoMiddle AfricaMoroccoNepalNetherlandsNicaraguaNigeriaNorthern AfricaNorthern EuropeOceaniaPakistanPanamaPeruPhilippinesPolandPortugalRomaniaRussiaSaudi ArabiaScotlandSierra LeoneSomaliaSouth AfricaSouth AmericaSouth Central AsiaSouth Eastern AsiaSouthern EuropeSpainSri LankaSudanSyriaTaiwanThailandTrinidad and TobagoTurkeyUgandaUkraineVenezuelaVietnamWestern AfricaWestern AsiaWestern EuropeZaireZimbabwe
Immigrant Origin (Percentage)
AfghanistanAfricaArgentinaAsiaAustraliaBangladeshBarbadosBelarusBosnia and HerzegovinaBrazilBurma / MyanmarCameroonCanadaCaribbeanCentral AmericaChileChinaColombiaCongoCosta RicaCroatiaCubaCzechoslovakiaDominican RepublicEastern AfricaEastern AsiaEastern EuropeEgyptEl SalvadorEnglandEthiopiaEuropeFranceGermanyGhanaGreeceGuatemalaHondurasHong KongHungaryIndiaIndonesiaIranIraqIrelandIsraelItalyJamaicaJapanJordanKazakhstanKenyaKoreaKuwaitLaosLatin AmericaLatviaLithuaniaMalaysiaMexicoMiddle AfricaMoroccoNepalNetherlandsNicaraguaNigeriaNorthern AfricaNorthern EuropeOceaniaPakistanPanamaPeruPhilippinesPolandPortugalRomaniaRussiaSaudi ArabiaScotlandSierra LeoneSomaliaSouth AfricaSouth AmericaSouth Central AsiaSouth Eastern AsiaSouthern EuropeSpainSri LankaSudanSyriaTaiwanThailandTrinidad and TobagoTurkeyUgandaUkraineVenezuelaVietnamWestern AfricaWestern AsiaWestern EuropeZaireZimbabwe
Income
Income (Families)
Income (Households)
Poverty
Poverty (Families)
Unemployment
Employment Occupations
Employment Industries
Employer Class
Commute Time
Commute Means
School Enrollment
Education by Degree Field
Occupancy
Finances
Physical Characteristics
Omaha
Compare Zip Codes
Comparison Subject

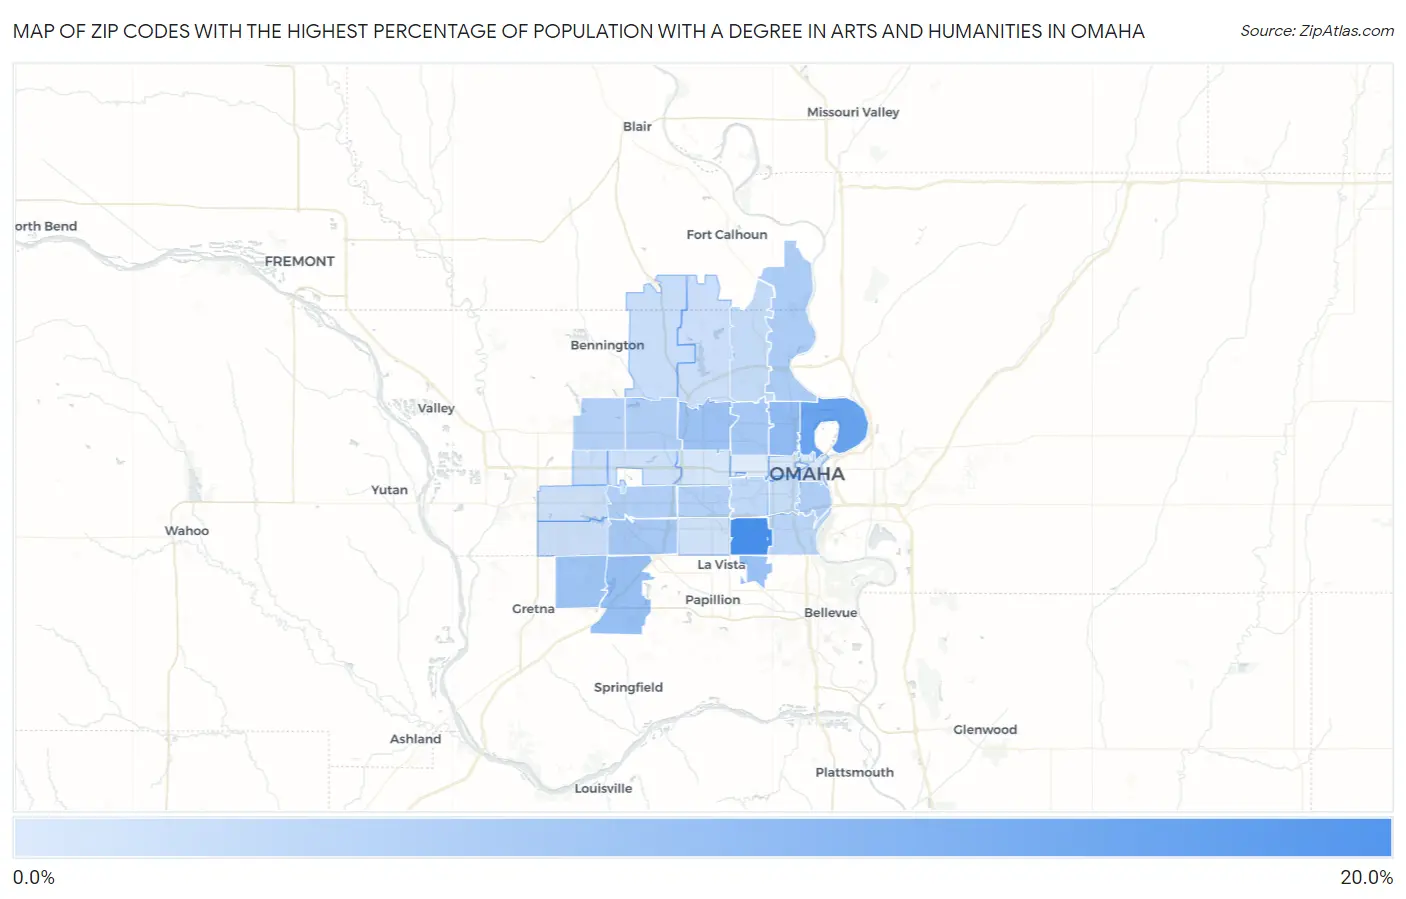
Map of Zip Codes with the Highest Percentage of Population with a Degree in Arts and Humanities in Omaha

0.0%
20.0%
Zip Codes with the Highest Percentage of Population with a Degree in Arts and Humanities in Omaha Map

Zip Codes with the Highest Percentage of Population with a Degree in Arts and Humanities in Omaha, NE

Zip Code % Graduates vs State vs National
1.6811717.8%7.6%(+10.2)#416.0%(+11.8)#1,883
2.6811014.6%7.6%(+6.95)#656.0%(+8.56)#2,851
3.6811110.8%7.6%(+3.20)#1156.0%(+4.81)#5,312
4.6813810.2%7.6%(+2.54)#1356.0%(+4.16)#6,050
5.681579.9%7.6%(+2.31)#1466.0%(+3.93)#6,357
6.681349.6%7.6%(+2.04)#1546.0%(+3.65)#6,710
7.681369.5%7.6%(+1.92)#1576.0%(+3.54)#6,877
8.681049.0%7.6%(+1.36)#1786.0%(+2.98)#7,791
9.681378.8%7.6%(+1.23)#1816.0%(+2.85)#7,994
10.681128.4%7.6%(+0.772)#1936.0%(+2.39)#8,844
11.681088.0%7.6%(+0.433)#2026.0%(+2.05)#9,575
12.681648.0%7.6%(+0.373)#2056.0%(+1.99)#9,704
13.681447.8%7.6%(+0.231)#2116.0%(+1.85)#9,977
14.681167.7%7.6%(+0.076)#2256.0%(+1.69)#10,332
15.681247.6%7.6%(-0.054)#2296.0%(+1.56)#10,584
16.681077.1%7.6%(-0.527)#2426.0%(+1.09)#11,749
17.681066.6%7.6%(-0.966)#2636.0%(+0.649)#12,895
18.681526.2%7.6%(-1.42)#2836.0%(+0.195)#14,127
19.681056.1%7.6%(-1.55)#2906.0%(+0.064)#14,505
20.681425.9%7.6%(-1.71)#2966.0%(-0.093)#14,946
21.681225.7%7.6%(-1.91)#3056.0%(-0.296)#15,544
22.681355.7%7.6%(-1.95)#3096.0%(-0.339)#15,674
23.681185.6%7.6%(-2.04)#3116.0%(-0.422)#15,918
24.681545.5%7.6%(-2.12)#3176.0%(-0.501)#16,139
25.681305.3%7.6%(-2.30)#3246.0%(-0.689)#16,687
26.681275.3%7.6%(-2.33)#3256.0%(-0.716)#16,786
27.681144.7%7.6%(-2.94)#3356.0%(-1.32)#18,526
28.681314.3%7.6%(-3.27)#3476.0%(-1.66)#19,468
29.681024.3%7.6%(-3.32)#3506.0%(-1.70)#19,574
30.681324.0%7.6%(-3.61)#3576.0%(-2.00)#20,361

Common Questions

What are the Top 10 Zip Codes with the Highest Percentage of Population with a Degree in Arts and Humanities in Omaha, NE?
Top 10 Zip Codes with the Highest Percentage of Population with a Degree in Arts and Humanities in Omaha, NE are:
#1
17.8%
#2
14.6%
#3
10.8%
#4
10.2%
#5
9.9%
#6
9.6%
#7
9.5%
#8
9.0%
#9
8.8%
#10
8.4%
What zip code has the Highest Percentage of Population with a Degree in Arts and Humanities in Omaha, NE?
68117 has the Highest Percentage of Population with a Degree in Arts and Humanities in Omaha, NE with 17.8%.
What is the Percentage of Population with a Degree in Arts and Humanities in Omaha, NE?
Percentage of Population with a Degree in Arts and Humanities in Omaha is 6.9%.
What is the Percentage of Population with a Degree in Arts and Humanities in Nebraska?
Percentage of Population with a Degree in Arts and Humanities in Nebraska is 7.6%.
What is the Percentage of Population with a Degree in Arts and Humanities in the United States?
Percentage of Population with a Degree in Arts and Humanities in the United States is 6.0%.