Zip Codes with the Highest Percentage of Households with Income Below $10,000 in Minnesota
RELATED REPORTS & OPTIONS
Household Income | $0-10k
Minnesota
Compare Zip Codes
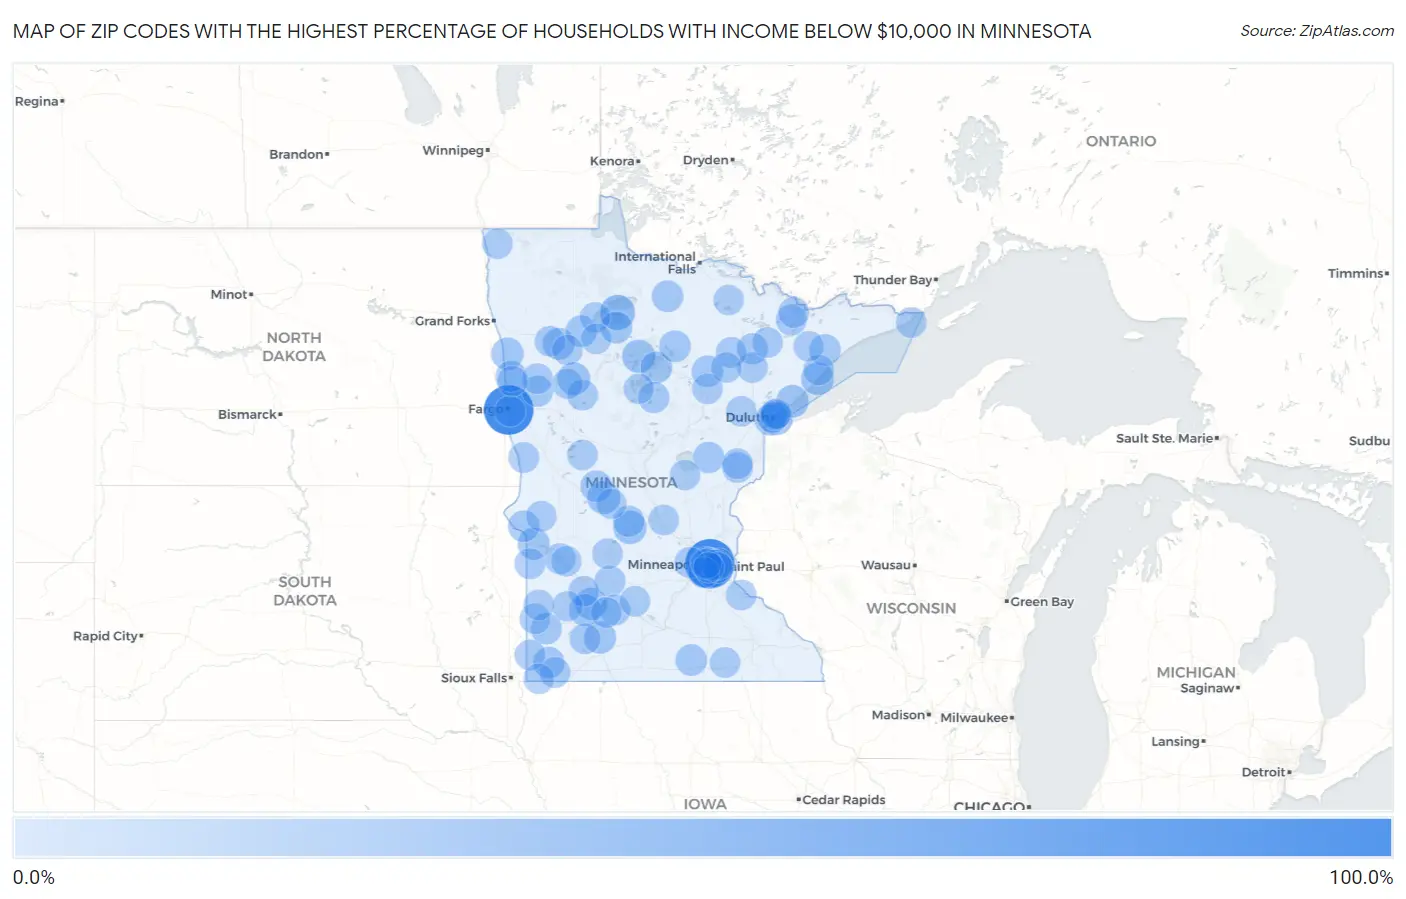
Map of Zip Codes with the Highest Percentage of Households with Income Below $10,000 in Minnesota
0.0%
100.0%
Zip Codes with the Highest Percentage of Households with Income Below $10,000 in Minnesota
| Zip Code | Households with Income < $10k | vs State | vs National | |
| 1. | 55455 | 100.0% | 3.6%(+96.4)#1 | 4.9%(+95.1)#1 |
| 2. | 56562 | 100.0% | 3.6%(+96.4)#2 | 4.9%(+95.1)#10 |
| 3. | 56666 | 28.8% | 3.6%(+25.2)#3 | 4.9%(+23.9)#352 |
| 4. | 56663 | 20.0% | 3.6%(+16.4)#4 | 4.9%(+15.1)#799 |
| 5. | 56371 | 20.0% | 3.6%(+16.4)#5 | 4.9%(+15.1)#801 |
| 6. | 56389 | 18.8% | 3.6%(+15.2)#6 | 4.9%(+13.9)#925 |
| 7. | 55802 | 18.4% | 3.6%(+14.8)#7 | 4.9%(+13.5)#958 |
| 8. | 56566 | 18.3% | 3.6%(+14.7)#8 | 4.9%(+13.4)#982 |
| 9. | 55601 | 17.6% | 3.6%(+14.0)#9 | 4.9%(+12.7)#1,084 |
| 10. | 55609 | 16.9% | 3.6%(+13.3)#10 | 4.9%(+12.0)#1,183 |
| 11. | 56145 | 15.3% | 3.6%(+11.7)#11 | 4.9%(+10.4)#1,465 |
| 12. | 56568 | 15.3% | 3.6%(+11.7)#12 | 4.9%(+10.4)#1,469 |
| 13. | 55111 | 15.0% | 3.6%(+11.4)#13 | 4.9%(+10.1)#1,533 |
| 14. | 56287 | 14.8% | 3.6%(+11.2)#14 | 4.9%(+9.90)#1,587 |
| 15. | 56255 | 14.0% | 3.6%(+10.4)#15 | 4.9%(+9.10)#1,787 |
| 16. | 56276 | 13.8% | 3.6%(+10.2)#16 | 4.9%(+8.90)#1,840 |
| 17. | 56670 | 13.6% | 3.6%(+10.00)#17 | 4.9%(+8.70)#1,894 |
| 18. | 56626 | 13.5% | 3.6%(+9.90)#18 | 4.9%(+8.60)#1,937 |
| 19. | 56556 | 13.1% | 3.6%(+9.50)#19 | 4.9%(+8.20)#2,050 |
| 20. | 56355 | 12.4% | 3.6%(+8.80)#20 | 4.9%(+7.50)#2,317 |
| 21. | 56627 | 12.4% | 3.6%(+8.80)#21 | 4.9%(+7.50)#2,323 |
| 22. | 56637 | 12.2% | 3.6%(+8.60)#22 | 4.9%(+7.30)#2,398 |
| 23. | 55454 | 12.0% | 3.6%(+8.40)#23 | 4.9%(+7.10)#2,460 |
| 24. | 56644 | 12.0% | 3.6%(+8.40)#24 | 4.9%(+7.10)#2,483 |
| 25. | 55603 | 12.0% | 3.6%(+8.40)#25 | 4.9%(+7.10)#2,489 |
| 26. | 55414 | 11.8% | 3.6%(+8.20)#26 | 4.9%(+6.90)#2,540 |
| 27. | 55716 | 11.8% | 3.6%(+8.20)#27 | 4.9%(+6.90)#2,577 |
| 28. | 56225 | 11.6% | 3.6%(+8.00)#28 | 4.9%(+6.70)#2,659 |
| 29. | 56032 | 11.6% | 3.6%(+8.00)#29 | 4.9%(+6.70)#2,665 |
| 30. | 56350 | 11.2% | 3.6%(+7.60)#30 | 4.9%(+6.30)#2,875 |
| 31. | 56147 | 11.1% | 3.6%(+7.50)#31 | 4.9%(+6.20)#2,935 |
| 32. | 55404 | 10.9% | 3.6%(+7.30)#32 | 4.9%(+6.00)#3,000 |
| 33. | 56550 | 10.8% | 3.6%(+7.20)#33 | 4.9%(+5.90)#3,106 |
| 34. | 56585 | 10.4% | 3.6%(+6.80)#34 | 4.9%(+5.50)#3,335 |
| 35. | 56376 | 10.2% | 3.6%(+6.60)#35 | 4.9%(+5.30)#3,484 |
| 36. | 56655 | 10.1% | 3.6%(+6.50)#36 | 4.9%(+5.20)#3,540 |
| 37. | 55411 | 10.0% | 3.6%(+6.40)#37 | 4.9%(+5.10)#3,567 |
| 38. | 56170 | 9.7% | 3.6%(+6.10)#38 | 4.9%(+4.80)#3,852 |
| 39. | 55792 | 9.4% | 3.6%(+5.80)#39 | 4.9%(+4.50)#4,038 |
| 40. | 55807 | 9.0% | 3.6%(+5.40)#40 | 4.9%(+4.10)#4,427 |
| 41. | 55130 | 8.9% | 3.6%(+5.30)#41 | 4.9%(+4.00)#4,514 |
| 42. | 56277 | 8.8% | 3.6%(+5.20)#42 | 4.9%(+3.90)#4,657 |
| 43. | 56575 | 8.6% | 3.6%(+5.00)#43 | 4.9%(+3.70)#4,895 |
| 44. | 56295 | 8.6% | 3.6%(+5.00)#44 | 4.9%(+3.70)#4,903 |
| 45. | 55796 | 8.6% | 3.6%(+5.00)#45 | 4.9%(+3.70)#4,907 |
| 46. | 55114 | 8.5% | 3.6%(+4.90)#46 | 4.9%(+3.60)#4,963 |
| 47. | 56266 | 8.5% | 3.6%(+4.90)#47 | 4.9%(+3.60)#4,981 |
| 48. | 55356 | 8.4% | 3.6%(+4.80)#48 | 4.9%(+3.50)#5,060 |
| 49. | 56560 | 8.3% | 3.6%(+4.70)#49 | 4.9%(+3.40)#5,153 |
| 50. | 55731 | 8.3% | 3.6%(+4.70)#50 | 4.9%(+3.40)#5,207 |
| 51. | 56110 | 8.3% | 3.6%(+4.70)#51 | 4.9%(+3.40)#5,237 |
| 52. | 55103 | 8.1% | 3.6%(+4.50)#52 | 4.9%(+3.20)#5,430 |
| 53. | 56257 | 8.1% | 3.6%(+4.50)#53 | 4.9%(+3.20)#5,523 |
| 54. | 56144 | 8.0% | 3.6%(+4.40)#54 | 4.9%(+3.10)#5,637 |
| 55. | 55107 | 7.9% | 3.6%(+4.30)#55 | 4.9%(+3.00)#5,697 |
| 56. | 56520 | 7.9% | 3.6%(+4.30)#56 | 4.9%(+3.00)#5,727 |
| 57. | 55734 | 7.8% | 3.6%(+4.20)#57 | 4.9%(+2.90)#5,844 |
| 58. | 55719 | 7.8% | 3.6%(+4.20)#58 | 4.9%(+2.90)#5,849 |
| 59. | 55614 | 7.8% | 3.6%(+4.20)#59 | 4.9%(+2.90)#5,883 |
| 60. | 56183 | 7.8% | 3.6%(+4.20)#60 | 4.9%(+2.90)#5,899 |
| 61. | 56237 | 7.8% | 3.6%(+4.20)#61 | 4.9%(+2.90)#5,915 |
| 62. | 55072 | 7.7% | 3.6%(+4.10)#62 | 4.9%(+2.80)#5,971 |
| 63. | 56584 | 7.7% | 3.6%(+4.10)#63 | 4.9%(+2.80)#6,004 |
| 64. | 56149 | 7.7% | 3.6%(+4.10)#64 | 4.9%(+2.80)#6,009 |
| 65. | 56221 | 7.6% | 3.6%(+4.00)#65 | 4.9%(+2.70)#6,168 |
| 66. | 55435 | 7.5% | 3.6%(+3.90)#66 | 4.9%(+2.60)#6,230 |
| 67. | 56535 | 7.5% | 3.6%(+3.90)#67 | 4.9%(+2.60)#6,293 |
| 68. | 55704 | 7.5% | 3.6%(+3.90)#68 | 4.9%(+2.60)#6,298 |
| 69. | 56304 | 7.4% | 3.6%(+3.80)#69 | 4.9%(+2.50)#6,369 |
| 70. | 55089 | 7.4% | 3.6%(+3.80)#70 | 4.9%(+2.50)#6,421 |
| 71. | 55732 | 7.4% | 3.6%(+3.80)#71 | 4.9%(+2.50)#6,431 |
| 72. | 56142 | 7.3% | 3.6%(+3.70)#72 | 4.9%(+2.40)#6,578 |
| 73. | 56671 | 7.2% | 3.6%(+3.60)#73 | 4.9%(+2.30)#6,708 |
| 74. | 55605 | 7.2% | 3.6%(+3.60)#74 | 4.9%(+2.30)#6,745 |
| 75. | 55403 | 7.1% | 3.6%(+3.50)#75 | 4.9%(+2.20)#6,803 |
| 76. | 55793 | 7.1% | 3.6%(+3.50)#76 | 4.9%(+2.20)#6,907 |
| 77. | 56652 | 7.1% | 3.6%(+3.50)#77 | 4.9%(+2.20)#6,920 |
| 78. | 56224 | 7.1% | 3.6%(+3.50)#78 | 4.9%(+2.20)#6,926 |
| 79. | 55806 | 7.0% | 3.6%(+3.40)#79 | 4.9%(+2.10)#7,007 |
| 80. | 55711 | 7.0% | 3.6%(+3.40)#80 | 4.9%(+2.10)#7,074 |
| 81. | 56574 | 7.0% | 3.6%(+3.40)#81 | 4.9%(+2.10)#7,086 |
| 82. | 56201 | 6.9% | 3.6%(+3.30)#82 | 4.9%(+2.00)#7,119 |
| 83. | 55335 | 6.9% | 3.6%(+3.30)#83 | 4.9%(+2.00)#7,235 |
| 84. | 55407 | 6.8% | 3.6%(+3.20)#84 | 4.9%(+1.90)#7,309 |
| 85. | 55746 | 6.8% | 3.6%(+3.20)#85 | 4.9%(+1.90)#7,356 |
| 86. | 56258 | 6.8% | 3.6%(+3.20)#86 | 4.9%(+1.90)#7,358 |
| 87. | 56265 | 6.8% | 3.6%(+3.20)#87 | 4.9%(+1.90)#7,391 |
| 88. | 56542 | 6.8% | 3.6%(+3.20)#88 | 4.9%(+1.90)#7,429 |
| 89. | 56551 | 6.8% | 3.6%(+3.20)#89 | 4.9%(+1.90)#7,437 |
| 90. | 56728 | 6.8% | 3.6%(+3.20)#90 | 4.9%(+1.90)#7,468 |
| 91. | 55950 | 6.8% | 3.6%(+3.20)#91 | 4.9%(+1.90)#7,511 |
| 92. | 55805 | 6.6% | 3.6%(+3.00)#92 | 4.9%(+1.70)#7,759 |
| 93. | 56359 | 6.5% | 3.6%(+2.90)#93 | 4.9%(+1.60)#8,002 |
| 94. | 56173 | 6.5% | 3.6%(+2.90)#94 | 4.9%(+1.60)#8,076 |
| 95. | 55607 | 6.5% | 3.6%(+2.90)#95 | 4.9%(+1.60)#8,077 |
| 96. | 55812 | 6.4% | 3.6%(+2.80)#96 | 4.9%(+1.50)#8,153 |
| 97. | 56378 | 6.4% | 3.6%(+2.80)#97 | 4.9%(+1.50)#8,175 |
| 98. | 56484 | 6.4% | 3.6%(+2.80)#98 | 4.9%(+1.50)#8,213 |
| 99. | 56589 | 6.4% | 3.6%(+2.80)#99 | 4.9%(+1.50)#8,240 |
| 100. | 55771 | 6.4% | 3.6%(+2.80)#100 | 4.9%(+1.50)#8,246 |
Common Questions
What are the Top 10 Zip Codes with the Highest Percentage of Households with Income Below $10,000 in Minnesota?
Top 10 Zip Codes with the Highest Percentage of Households with Income Below $10,000 in Minnesota are:
What zip code has the Highest Percentage of Households with Income Below $10,000 in Minnesota?
55455 has the Highest Percentage of Households with Income Below $10,000 in Minnesota with 100.0%.
What is the Percentage of Households with Income Below $10,000 in the State of Minnesota?
Percentage of Households with Income Below $10,000 in Minnesota is 3.6%.
What is the Percentage of Households with Income Below $10,000 in the United States?
Percentage of Households with Income Below $10,000 in the United States is 4.9%.