Zip Codes with the Highest Percentage of Population Employed in Accommodation & Food Services in Omaha, NE
RELATED REPORTS & OPTIONS
Accommodation & Food Services
Omaha
Compare Zip Codes
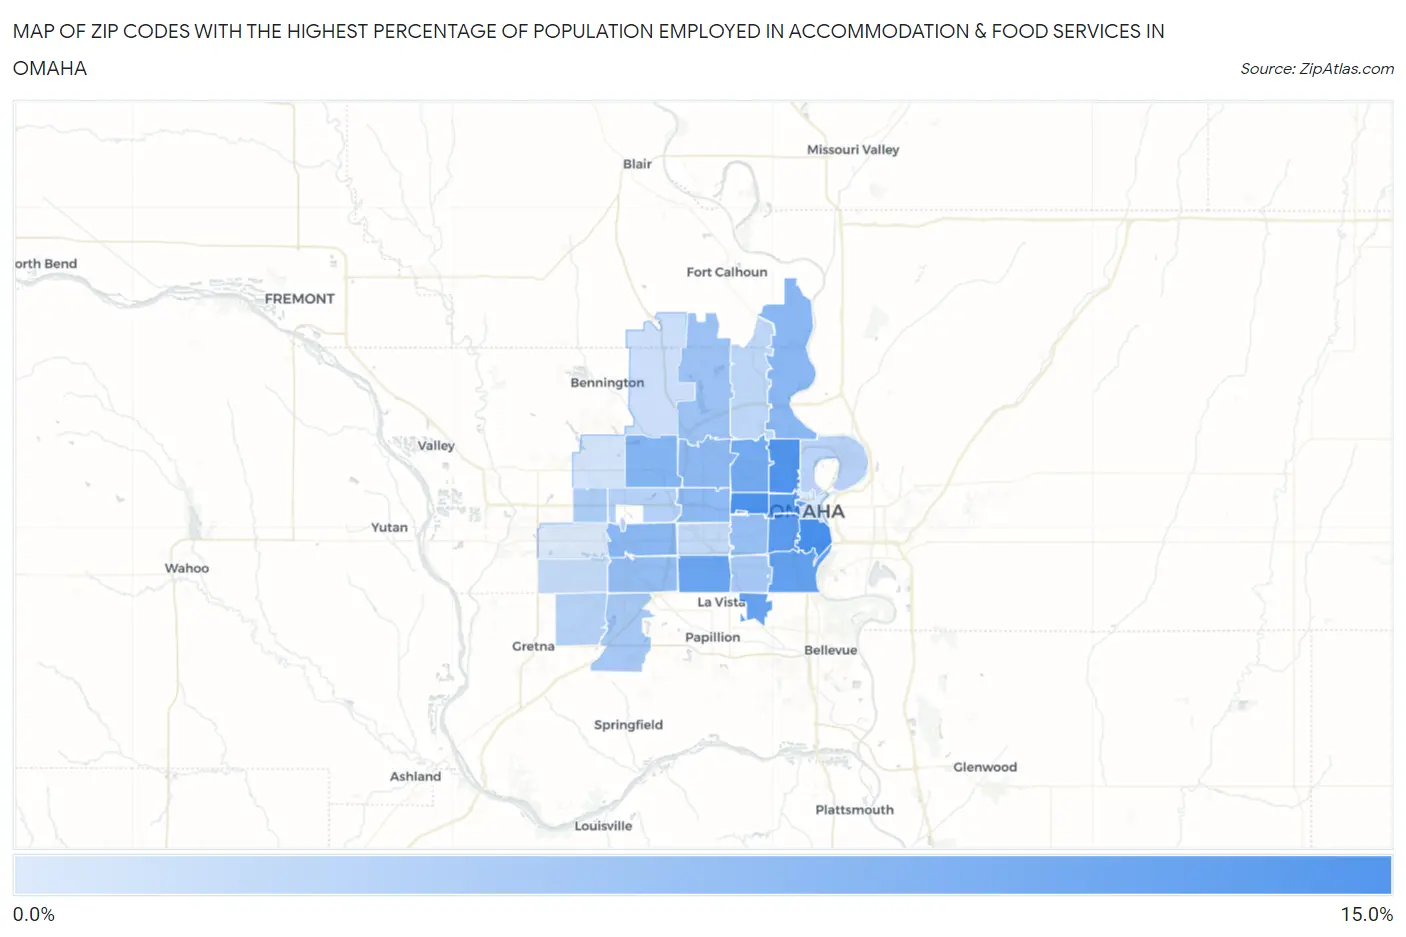
Map of Zip Codes with the Highest Percentage of Population Employed in Accommodation & Food Services in Omaha
2.7%
10.3%
Zip Codes with the Highest Percentage of Population Employed in Accommodation & Food Services in Omaha, NE
| Zip Code | % Employed | vs State | vs National | |
| 1. | 68108 | 10.3% | 5.7%(+4.63)#31 | 6.9%(+3.43)#4,185 |
| 2. | 68132 | 10.0% | 5.7%(+4.35)#37 | 6.9%(+3.16)#4,475 |
| 3. | 68111 | 9.9% | 5.7%(+4.21)#39 | 6.9%(+3.02)#4,666 |
| 4. | 68182 | 9.8% | 5.7%(+4.15)#40 | 6.9%(+2.96)#4,732 |
| 5. | 68131 | 9.5% | 5.7%(+3.78)#46 | 6.9%(+2.58)#5,258 |
| 6. | 68105 | 9.2% | 5.7%(+3.50)#50 | 6.9%(+2.30)#5,675 |
| 7. | 68107 | 8.9% | 5.7%(+3.25)#54 | 6.9%(+2.05)#6,069 |
| 8. | 68157 | 8.6% | 5.7%(+2.93)#61 | 6.9%(+1.73)#6,610 |
| 9. | 68127 | 8.5% | 5.7%(+2.85)#63 | 6.9%(+1.65)#6,755 |
| 10. | 68178 | 8.1% | 5.7%(+2.45)#70 | 6.9%(+1.26)#7,556 |
| 11. | 68104 | 8.0% | 5.7%(+2.31)#72 | 6.9%(+1.12)#7,822 |
| 12. | 68164 | 7.2% | 5.7%(+1.51)#84 | 6.9%(+0.316)#9,813 |
| 13. | 68112 | 6.9% | 5.7%(+1.17)#91 | 6.9%(-0.022)#10,691 |
| 14. | 68144 | 6.8% | 5.7%(+1.16)#92 | 6.9%(-0.035)#10,737 |
| 15. | 68134 | 6.7% | 5.7%(+1.05)#96 | 6.9%(-0.148)#11,103 |
| 16. | 68114 | 6.7% | 5.7%(+0.976)#103 | 6.9%(-0.218)#11,320 |
| 17. | 68137 | 6.4% | 5.7%(+0.727)#115 | 6.9%(-0.466)#12,108 |
| 18. | 68106 | 6.2% | 5.7%(+0.465)#123 | 6.9%(-0.729)#12,959 |
| 19. | 68122 | 6.1% | 5.7%(+0.373)#129 | 6.9%(-0.821)#13,273 |
| 20. | 68117 | 5.4% | 5.7%(-0.260)#144 | 6.9%(-1.45)#15,304 |
| 21. | 68138 | 5.4% | 5.7%(-0.268)#146 | 6.9%(-1.46)#15,340 |
| 22. | 68118 | 5.1% | 5.7%(-0.562)#163 | 6.9%(-1.76)#16,372 |
| 23. | 68154 | 4.7% | 5.7%(-0.944)#177 | 6.9%(-2.14)#17,682 |
| 24. | 68136 | 4.7% | 5.7%(-0.967)#179 | 6.9%(-2.16)#17,743 |
| 25. | 68110 | 4.5% | 5.7%(-1.17)#193 | 6.9%(-2.37)#18,443 |
| 26. | 68152 | 4.4% | 5.7%(-1.34)#203 | 6.9%(-2.53)#18,992 |
| 27. | 68124 | 4.1% | 5.7%(-1.57)#215 | 6.9%(-2.76)#19,763 |
| 28. | 68135 | 4.0% | 5.7%(-1.67)#223 | 6.9%(-2.87)#20,121 |
| 29. | 68142 | 3.7% | 5.7%(-2.00)#247 | 6.9%(-3.20)#21,177 |
| 30. | 68116 | 3.3% | 5.7%(-2.40)#279 | 6.9%(-3.60)#22,443 |
| 31. | 68130 | 2.9% | 5.7%(-2.78)#301 | 6.9%(-3.98)#23,479 |
| 32. | 68102 | 2.7% | 5.7%(-2.94)#315 | 6.9%(-4.14)#23,906 |
1
Common Questions
What are the Top 10 Zip Codes with the Highest Percentage of Population Employed in Accommodation & Food Services in Omaha, NE?
Top 10 Zip Codes with the Highest Percentage of Population Employed in Accommodation & Food Services in Omaha, NE are:
What zip code has the Highest Percentage of Population Employed in Accommodation & Food Services in Omaha, NE?
68108 has the Highest Percentage of Population Employed in Accommodation & Food Services in Omaha, NE with 10.3%.
What is the Percentage of Population Employed in Accommodation & Food Services in Omaha, NE?
Percentage of Population Employed in Accommodation & Food Services in Omaha is 6.7%.
What is the Percentage of Population Employed in Accommodation & Food Services in Nebraska?
Percentage of Population Employed in Accommodation & Food Services in Nebraska is 5.7%.
What is the Percentage of Population Employed in Accommodation & Food Services in the United States?
Percentage of Population Employed in Accommodation & Food Services in the United States is 6.9%.