Zip Codes with the Highest Percentage of Population Employed in Arts, Media & Entertainment in Omaha, NE

RELATED REPORTS & OPTIONS

Arts, Media & Entertainment
Population
Families and Households
Female Fertility
Female Fertility (Unmarried)
Race (Community Size)
Race (Percentage)
Ancestry (Community Size)
AfghanAfricanAlbanianAleutAmericanApacheArabArapahoArgentineanArmenianAustralianAustrianBangladeshiBasqueBelgianBhutaneseBlackfeetBolivianBrazilianBritishBulgarianBurmeseCajunCambodianCanadianCarpatho RusynCentral AmericanCentral American IndianCherokeeChickasawChileanChineseChippewaChoctawColombianComancheCosta RicanCreekCroatianCubanCzechCzechoslovakianDanishDominicanDutchEastern EuropeanEcuadorianEgyptianEnglishEthiopianEuropeanFilipinoFinnishFrenchFrench American IndianFrench CanadianGermanGerman RussianGhanaianGreekGuamanian / ChamorroGuatemalanGuyaneseHaitianHonduranHungarianIcelanderIndian (Asian)IndonesianInupiatIranianIraqiIrishIroquoisIsraeliItalianJamaicanJapaneseJordanianKenyanKiowaKoreanLaotianLatvianLebaneseLithuanianLuxembourgerMacedonianMalaysianMexicanMexican American IndianMoroccanNative HawaiianNavajoNicaraguanNigerianNorthern EuropeanNorwegianPakistaniPalestinianPanamanianPennsylvania GermanPeruvianPolishPortuguesePotawatomiPuebloPuerto RicanRomanianRussianSalvadoranSamoanScandinavianScotch-IrishScottishSeminoleSerbianSiouxSlavicSlovakSloveneSomaliSouth AfricanSouth AmericanSpaniardSpanishSri LankanSubsaharan AfricanSudaneseSwedishSwissSyrianThaiTlingit-HaidaTrinidadian and TobagonianTurkishUkrainianVenezuelanVietnameseWelshWest IndianYugoslavianZimbabwean
Ancestry (Percentage)
AfghanAfricanAlbanianAleutAmericanApacheArabArapahoArgentineanArmenianAustralianAustrianBangladeshiBasqueBelgianBhutaneseBlackfeetBolivianBrazilianBritishBulgarianBurmeseCajunCambodianCanadianCarpatho RusynCentral AmericanCentral American IndianCherokeeChickasawChileanChineseChippewaChoctawColombianComancheCosta RicanCreekCroatianCubanCzechCzechoslovakianDanishDominicanDutchEastern EuropeanEcuadorianEgyptianEnglishEthiopianEuropeanFilipinoFinnishFrenchFrench American IndianFrench CanadianGermanGerman RussianGhanaianGreekGuamanian / ChamorroGuatemalanGuyaneseHaitianHonduranHungarianIcelanderIndian (Asian)IndonesianInupiatIranianIraqiIrishIroquoisIsraeliItalianJamaicanJapaneseJordanianKenyanKiowaKoreanLaotianLatvianLebaneseLithuanianLuxembourgerMacedonianMalaysianMexicanMexican American IndianMoroccanNative HawaiianNavajoNicaraguanNigerianNorthern EuropeanNorwegianPakistaniPalestinianPanamanianPennsylvania GermanPeruvianPolishPortuguesePotawatomiPuebloPuerto RicanRomanianRussianSalvadoranSamoanScandinavianScotch-IrishScottishSeminoleSerbianSiouxSlavicSlovakSloveneSomaliSouth AfricanSouth AmericanSpaniardSpanishSri LankanSubsaharan AfricanSudaneseSwedishSwissSyrianThaiTlingit-HaidaTrinidadian and TobagonianTurkishUkrainianVenezuelanVietnameseWelshWest IndianYugoslavianZimbabwean
Immigrant Origin (Total)
AfghanistanAfricaArgentinaAsiaAustraliaBangladeshBarbadosBelarusBosnia and HerzegovinaBrazilBurma / MyanmarCameroonCanadaCaribbeanCentral AmericaChileChinaColombiaCongoCosta RicaCroatiaCubaCzechoslovakiaDominican RepublicEastern AfricaEastern AsiaEastern EuropeEgyptEl SalvadorEnglandEthiopiaEuropeFranceGermanyGhanaGreeceGuatemalaHondurasHong KongHungaryIndiaIndonesiaIranIraqIrelandIsraelItalyJamaicaJapanJordanKazakhstanKenyaKoreaKuwaitLaosLatin AmericaLatviaLithuaniaMalaysiaMexicoMiddle AfricaMoroccoNepalNetherlandsNicaraguaNigeriaNorthern AfricaNorthern EuropeOceaniaPakistanPanamaPeruPhilippinesPolandPortugalRomaniaRussiaSaudi ArabiaScotlandSierra LeoneSomaliaSouth AfricaSouth AmericaSouth Central AsiaSouth Eastern AsiaSouthern EuropeSpainSri LankaSudanSyriaTaiwanThailandTrinidad and TobagoTurkeyUgandaUkraineVenezuelaVietnamWestern AfricaWestern AsiaWestern EuropeZaireZimbabwe
Immigrant Origin (Percentage)
AfghanistanAfricaArgentinaAsiaAustraliaBangladeshBarbadosBelarusBosnia and HerzegovinaBrazilBurma / MyanmarCameroonCanadaCaribbeanCentral AmericaChileChinaColombiaCongoCosta RicaCroatiaCubaCzechoslovakiaDominican RepublicEastern AfricaEastern AsiaEastern EuropeEgyptEl SalvadorEnglandEthiopiaEuropeFranceGermanyGhanaGreeceGuatemalaHondurasHong KongHungaryIndiaIndonesiaIranIraqIrelandIsraelItalyJamaicaJapanJordanKazakhstanKenyaKoreaKuwaitLaosLatin AmericaLatviaLithuaniaMalaysiaMexicoMiddle AfricaMoroccoNepalNetherlandsNicaraguaNigeriaNorthern AfricaNorthern EuropeOceaniaPakistanPanamaPeruPhilippinesPolandPortugalRomaniaRussiaSaudi ArabiaScotlandSierra LeoneSomaliaSouth AfricaSouth AmericaSouth Central AsiaSouth Eastern AsiaSouthern EuropeSpainSri LankaSudanSyriaTaiwanThailandTrinidad and TobagoTurkeyUgandaUkraineVenezuelaVietnamWestern AfricaWestern AsiaWestern EuropeZaireZimbabwe
Income
Income (Families)
Income (Households)
Poverty
Poverty (Families)
Unemployment
Employment Occupations
Employment Industries
Employer Class
Commute Time
Commute Means
School Enrollment
Education by Degree Field
Occupancy
Finances
Physical Characteristics
Omaha
Compare Zip Codes
Comparison Subject

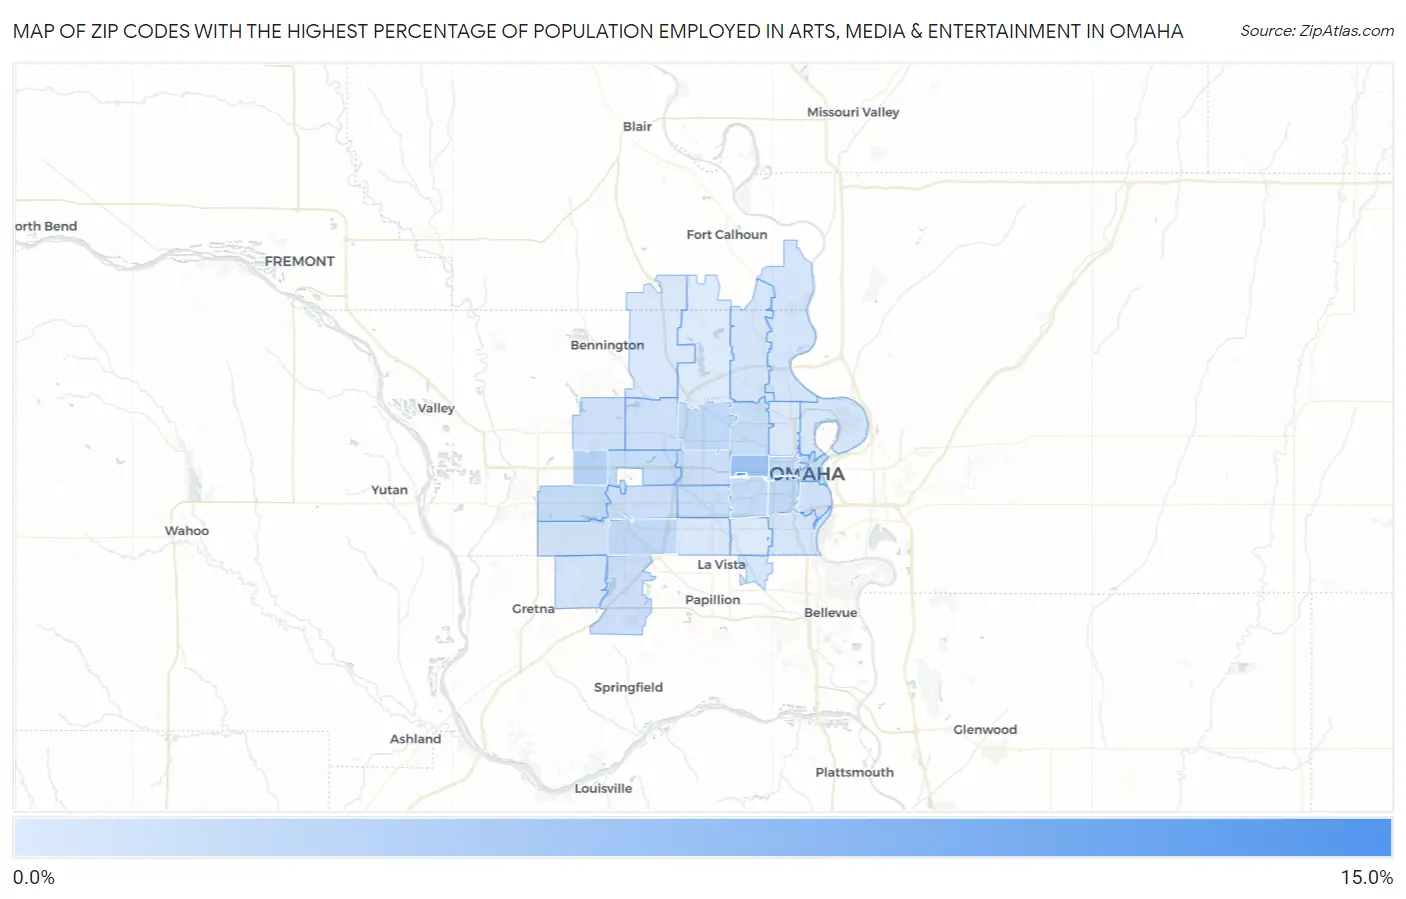
Map of Zip Codes with the Highest Percentage of Population Employed in Arts, Media & Entertainment in Omaha

0.0%
15.0%
Zip Codes with the Highest Percentage of Population Employed in Arts, Media & Entertainment in Omaha Map

Zip Codes with the Highest Percentage of Population Employed in Arts, Media & Entertainment in Omaha, NE

Zip Code % Employed vs State vs National
1.6818211.4%1.5%(+9.94)#22.1%(+9.38)#284
2.681325.0%1.5%(+3.54)#142.1%(+2.98)#1,474
3.681183.2%1.5%(+1.75)#302.1%(+1.19)#3,514
4.681342.7%1.5%(+1.16)#512.1%(+0.594)#5,046
5.681312.6%1.5%(+1.10)#532.1%(+0.538)#5,237
6.681052.5%1.5%(+1.04)#542.1%(+0.478)#5,422
7.681372.5%1.5%(+0.971)#602.1%(+0.410)#5,652
8.681062.2%1.5%(+0.705)#712.1%(+0.144)#6,800
9.681022.1%1.5%(+0.613)#742.1%(+0.052)#7,203
10.681542.1%1.5%(+0.605)#752.1%(+0.044)#7,257
11.681042.1%1.5%(+0.567)#802.1%(+0.006)#7,454
12.681302.0%1.5%(+0.522)#842.1%(-0.039)#7,698
13.681242.0%1.5%(+0.470)#892.1%(-0.091)#7,978
14.681141.8%1.5%(+0.260)#1052.1%(-0.301)#9,213
15.681441.7%1.5%(+0.226)#1102.1%(-0.335)#9,433
16.681381.7%1.5%(+0.212)#1112.1%(-0.349)#9,532
17.681641.6%1.5%(+0.063)#1252.1%(-0.498)#10,561
18.681161.5%1.5%(+0.028)#1292.1%(-0.533)#10,791
19.681081.4%1.5%(-0.112)#1362.1%(-0.673)#11,795
20.681781.4%1.5%(-0.143)#1382.1%(-0.704)#12,025
21.681351.3%1.5%(-0.192)#1412.1%(-0.753)#12,395
22.681361.2%1.5%(-0.342)#1582.1%(-0.903)#13,525
23.681071.1%1.5%(-0.363)#1602.1%(-0.924)#13,687
24.681521.1%1.5%(-0.443)#1692.1%(-1.00)#14,345
25.681121.1%1.5%(-0.446)#1702.1%(-1.01)#14,375
26.681100.99%1.5%(-0.509)#1812.1%(-1.07)#14,881
27.681570.96%1.5%(-0.543)#1842.1%(-1.10)#15,172
28.681270.73%1.5%(-0.772)#2182.1%(-1.33)#17,004
29.681420.72%1.5%(-0.776)#2202.1%(-1.34)#17,031
30.681110.60%1.5%(-0.898)#2432.1%(-1.46)#18,040
31.681220.50%1.5%(-1.00)#2562.1%(-1.57)#18,889
32.681170.49%1.5%(-1.01)#2572.1%(-1.57)#18,925

Common Questions

What are the Top 10 Zip Codes with the Highest Percentage of Population Employed in Arts, Media & Entertainment in Omaha, NE?
Top 10 Zip Codes with the Highest Percentage of Population Employed in Arts, Media & Entertainment in Omaha, NE are:
#1
11.4%
#2
5.0%
#3
3.2%
#4
2.7%
#5
2.6%
#6
2.5%
#7
2.5%
#8
2.2%
#9
2.1%
#10
2.1%
What zip code has the Highest Percentage of Population Employed in Arts, Media & Entertainment in Omaha, NE?
68182 has the Highest Percentage of Population Employed in Arts, Media & Entertainment in Omaha, NE with 11.4%.
What is the Percentage of Population Employed in Arts, Media & Entertainment in Omaha, NE?
Percentage of Population Employed in Arts, Media & Entertainment in Omaha is 2.0%.
What is the Percentage of Population Employed in Arts, Media & Entertainment in Nebraska?
Percentage of Population Employed in Arts, Media & Entertainment in Nebraska is 1.5%.
What is the Percentage of Population Employed in Arts, Media & Entertainment in the United States?
Percentage of Population Employed in Arts, Media & Entertainment in the United States is 2.1%.