Zip Codes with the Highest Percentage of Households with Income Below $10,000 in Louisiana
RELATED REPORTS & OPTIONS
Household Income | $0-10k
Louisiana
Compare Zip Codes
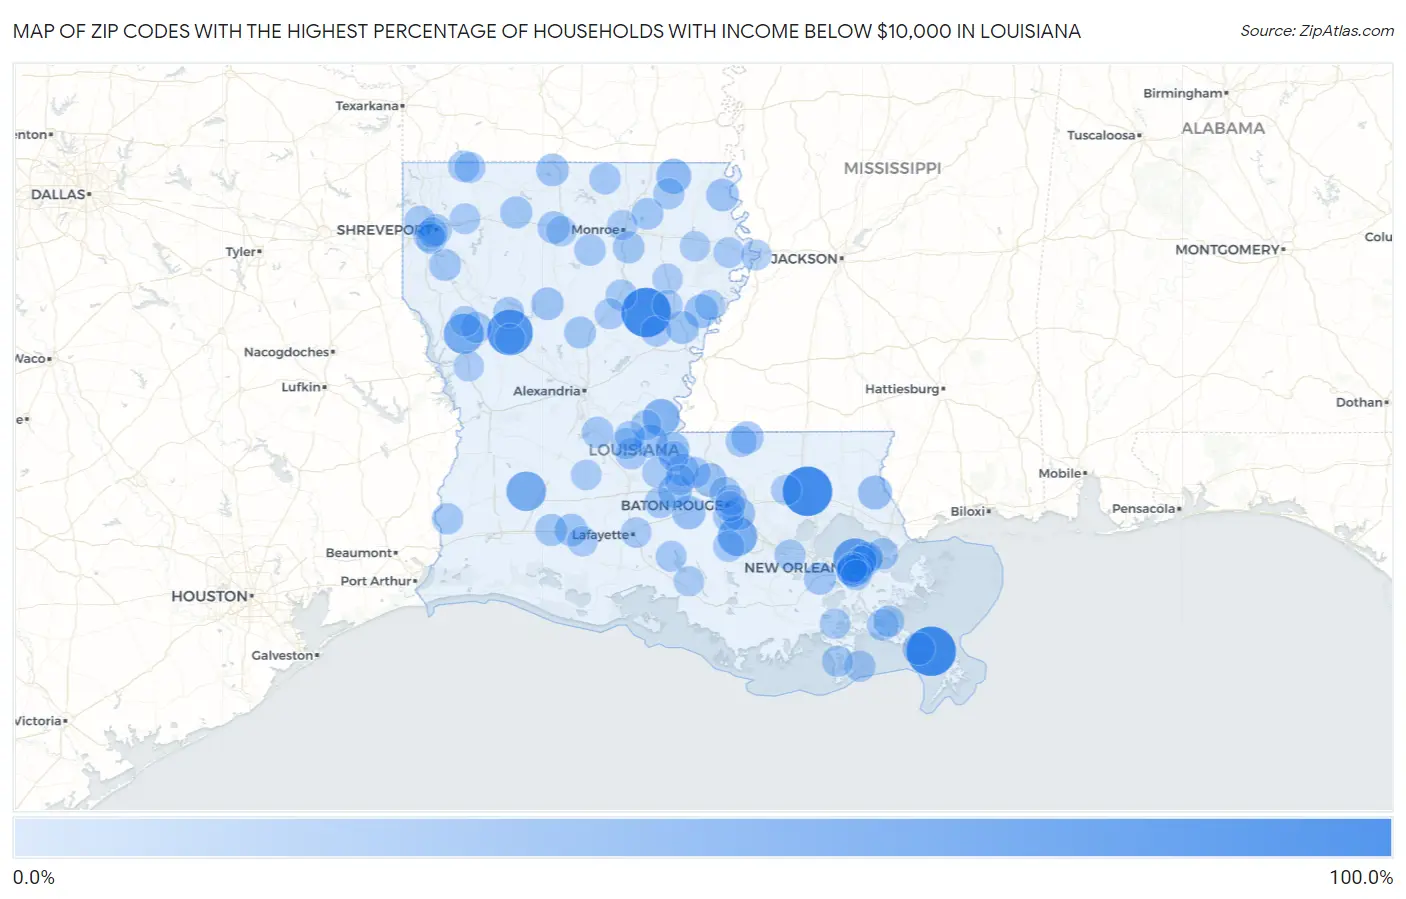
Map of Zip Codes with the Highest Percentage of Households with Income Below $10,000 in Louisiana
0.0%
100.0%
Zip Codes with the Highest Percentage of Households with Income Below $10,000 in Louisiana
| Zip Code | Households with Income < $10k | vs State | vs National | |
| 1. | 70451 | 100.0% | 7.4%(+92.6)#1 | 4.9%(+95.1)#17 |
| 2. | 71425 | 100.0% | 7.4%(+92.6)#2 | 4.9%(+95.1)#25 |
| 3. | 70038 | 100.0% | 7.4%(+92.6)#3 | 4.9%(+95.1)#29 |
| 4. | 71497 | 82.1% | 7.4%(+74.7)#4 | 4.9%(+77.2)#44 |
| 5. | 70148 | 70.8% | 7.4%(+63.4)#5 | 4.9%(+65.9)#57 |
| 6. | 71406 | 55.3% | 7.4%(+47.9)#6 | 4.9%(+50.4)#88 |
| 7. | 70651 | 53.8% | 7.4%(+46.4)#7 | 4.9%(+48.9)#93 |
| 8. | 70721 | 52.4% | 7.4%(+45.0)#8 | 4.9%(+47.5)#100 |
| 9. | 71320 | 41.8% | 7.4%(+34.4)#9 | 4.9%(+36.9)#159 |
| 10. | 71223 | 33.0% | 7.4%(+25.6)#10 | 4.9%(+28.1)#267 |
| 11. | 70464 | 28.0% | 7.4%(+20.6)#11 | 4.9%(+23.1)#372 |
| 12. | 70736 | 26.6% | 7.4%(+19.2)#12 | 4.9%(+21.7)#416 |
| 13. | 70757 | 26.2% | 7.4%(+18.8)#13 | 4.9%(+21.3)#428 |
| 14. | 71375 | 26.1% | 7.4%(+18.7)#14 | 4.9%(+21.2)#433 |
| 15. | 70756 | 25.8% | 7.4%(+18.4)#15 | 4.9%(+20.9)#451 |
| 16. | 70747 | 25.6% | 7.4%(+18.2)#16 | 4.9%(+20.7)#460 |
| 17. | 71369 | 25.3% | 7.4%(+17.9)#17 | 4.9%(+20.4)#473 |
| 18. | 70112 | 24.9% | 7.4%(+17.5)#18 | 4.9%(+20.0)#492 |
| 19. | 71326 | 23.3% | 7.4%(+15.9)#19 | 4.9%(+18.4)#574 |
| 20. | 70836 | 22.9% | 7.4%(+15.5)#20 | 4.9%(+18.0)#597 |
| 21. | 71254 | 22.3% | 7.4%(+14.9)#21 | 4.9%(+17.4)#616 |
| 22. | 70759 | 22.1% | 7.4%(+14.7)#22 | 4.9%(+17.2)#631 |
| 23. | 71256 | 21.8% | 7.4%(+14.4)#23 | 4.9%(+16.9)#649 |
| 24. | 71410 | 21.7% | 7.4%(+14.3)#24 | 4.9%(+16.8)#657 |
| 25. | 70537 | 21.6% | 7.4%(+14.2)#25 | 4.9%(+16.7)#662 |
| 26. | 70041 | 21.5% | 7.4%(+14.1)#26 | 4.9%(+16.6)#668 |
| 27. | 71245 | 21.0% | 7.4%(+13.6)#27 | 4.9%(+16.1)#707 |
| 28. | 70761 | 19.9% | 7.4%(+12.5)#28 | 4.9%(+15.0)#809 |
| 29. | 70039 | 19.7% | 7.4%(+12.3)#29 | 4.9%(+14.8)#823 |
| 30. | 71003 | 19.4% | 7.4%(+12.0)#30 | 4.9%(+14.5)#857 |
| 31. | 70581 | 18.9% | 7.4%(+11.5)#31 | 4.9%(+14.0)#909 |
| 32. | 71027 | 18.5% | 7.4%(+11.1)#32 | 4.9%(+13.6)#950 |
| 33. | 71432 | 18.3% | 7.4%(+10.9)#33 | 4.9%(+13.4)#981 |
| 34. | 71229 | 17.8% | 7.4%(+10.4)#34 | 4.9%(+12.9)#1,049 |
| 35. | 71202 | 17.7% | 7.4%(+10.3)#35 | 4.9%(+12.8)#1,054 |
| 36. | 70127 | 17.6% | 7.4%(+10.2)#36 | 4.9%(+12.7)#1,066 |
| 37. | 71325 | 17.1% | 7.4%(+9.70)#37 | 4.9%(+12.2)#1,142 |
| 38. | 71238 | 16.9% | 7.4%(+9.50)#38 | 4.9%(+12.0)#1,172 |
| 39. | 71101 | 16.5% | 7.4%(+9.10)#39 | 4.9%(+11.6)#1,248 |
| 40. | 71260 | 16.5% | 7.4%(+9.10)#40 | 4.9%(+11.6)#1,250 |
| 41. | 70113 | 16.4% | 7.4%(+9.00)#41 | 4.9%(+11.5)#1,258 |
| 42. | 70083 | 16.4% | 7.4%(+9.00)#42 | 4.9%(+11.5)#1,265 |
| 43. | 70820 | 16.2% | 7.4%(+8.80)#43 | 4.9%(+11.3)#1,290 |
| 44. | 71075 | 16.2% | 7.4%(+8.80)#44 | 4.9%(+11.3)#1,293 |
| 45. | 70661 | 16.2% | 7.4%(+8.80)#45 | 4.9%(+11.3)#1,302 |
| 46. | 70129 | 16.1% | 7.4%(+8.70)#46 | 4.9%(+11.2)#1,318 |
| 47. | 70082 | 16.1% | 7.4%(+8.70)#47 | 4.9%(+11.2)#1,330 |
| 48. | 70807 | 15.8% | 7.4%(+8.40)#48 | 4.9%(+10.9)#1,375 |
| 49. | 71356 | 15.8% | 7.4%(+8.40)#49 | 4.9%(+10.9)#1,386 |
| 50. | 70788 | 15.7% | 7.4%(+8.30)#50 | 4.9%(+10.8)#1,397 |
| 51. | 70789 | 15.7% | 7.4%(+8.30)#51 | 4.9%(+10.8)#1,399 |
| 52. | 70358 | 15.5% | 7.4%(+8.10)#52 | 4.9%(+10.6)#1,431 |
| 53. | 71450 | 15.5% | 7.4%(+8.10)#53 | 4.9%(+10.6)#1,432 |
| 54. | 70357 | 15.4% | 7.4%(+8.00)#54 | 4.9%(+10.5)#1,442 |
| 55. | 70750 | 15.4% | 7.4%(+8.00)#55 | 4.9%(+10.5)#1,444 |
| 56. | 70128 | 15.2% | 7.4%(+7.80)#56 | 4.9%(+10.3)#1,476 |
| 57. | 71333 | 15.2% | 7.4%(+7.80)#57 | 4.9%(+10.3)#1,491 |
| 58. | 71261 | 15.1% | 7.4%(+7.70)#58 | 4.9%(+10.2)#1,506 |
| 59. | 70760 | 15.0% | 7.4%(+7.60)#59 | 4.9%(+10.1)#1,519 |
| 60. | 71435 | 15.0% | 7.4%(+7.60)#60 | 4.9%(+10.1)#1,521 |
| 61. | 71009 | 15.0% | 7.4%(+7.60)#61 | 4.9%(+10.1)#1,535 |
| 62. | 70051 | 14.7% | 7.4%(+7.30)#62 | 4.9%(+9.80)#1,599 |
| 63. | 71411 | 14.4% | 7.4%(+7.00)#63 | 4.9%(+9.50)#1,669 |
| 64. | 70552 | 14.2% | 7.4%(+6.80)#64 | 4.9%(+9.30)#1,728 |
| 65. | 70805 | 14.0% | 7.4%(+6.60)#65 | 4.9%(+9.10)#1,761 |
| 66. | 71021 | 13.9% | 7.4%(+6.50)#66 | 4.9%(+9.00)#1,815 |
| 67. | 70117 | 13.7% | 7.4%(+6.30)#67 | 4.9%(+8.80)#1,844 |
| 68. | 70126 | 13.5% | 7.4%(+6.10)#68 | 4.9%(+8.60)#1,906 |
| 69. | 71465 | 13.5% | 7.4%(+6.10)#69 | 4.9%(+8.60)#1,922 |
| 70. | 71340 | 13.3% | 7.4%(+5.90)#70 | 4.9%(+8.40)#1,988 |
| 71. | 71353 | 13.2% | 7.4%(+5.80)#71 | 4.9%(+8.30)#2,012 |
| 72. | 71282 | 13.1% | 7.4%(+5.70)#72 | 4.9%(+8.20)#2,033 |
| 73. | 70125 | 13.0% | 7.4%(+5.60)#73 | 4.9%(+8.10)#2,069 |
| 74. | 71067 | 13.0% | 7.4%(+5.60)#74 | 4.9%(+8.10)#2,079 |
| 75. | 70802 | 12.8% | 7.4%(+5.40)#75 | 4.9%(+7.90)#2,154 |
| 76. | 71233 | 12.8% | 7.4%(+5.40)#76 | 4.9%(+7.90)#2,185 |
| 77. | 70501 | 12.7% | 7.4%(+5.30)#77 | 4.9%(+7.80)#2,192 |
| 78. | 71109 | 12.6% | 7.4%(+5.20)#78 | 4.9%(+7.70)#2,229 |
| 79. | 70715 | 12.6% | 7.4%(+5.20)#79 | 4.9%(+7.70)#2,241 |
| 80. | 70732 | 12.5% | 7.4%(+5.10)#80 | 4.9%(+7.60)#2,267 |
| 81. | 70580 | 12.5% | 7.4%(+5.10)#81 | 4.9%(+7.60)#2,281 |
| 82. | 71108 | 12.4% | 7.4%(+5.00)#82 | 4.9%(+7.50)#2,296 |
| 83. | 71270 | 12.2% | 7.4%(+4.80)#83 | 4.9%(+7.30)#2,368 |
| 84. | 70119 | 12.1% | 7.4%(+4.70)#84 | 4.9%(+7.20)#2,406 |
| 85. | 70053 | 12.1% | 7.4%(+4.70)#85 | 4.9%(+7.20)#2,412 |
| 86. | 71103 | 12.1% | 7.4%(+4.70)#86 | 4.9%(+7.20)#2,417 |
| 87. | 70345 | 11.9% | 7.4%(+4.50)#87 | 4.9%(+7.00)#2,512 |
| 88. | 71232 | 11.8% | 7.4%(+4.40)#88 | 4.9%(+6.90)#2,549 |
| 89. | 71355 | 11.8% | 7.4%(+4.40)#89 | 4.9%(+6.90)#2,556 |
| 90. | 71065 | 11.8% | 7.4%(+4.40)#90 | 4.9%(+6.90)#2,568 |
| 91. | 71457 | 11.6% | 7.4%(+4.20)#91 | 4.9%(+6.70)#2,624 |
| 92. | 71201 | 11.6% | 7.4%(+4.20)#92 | 4.9%(+6.70)#2,626 |
| 93. | 71295 | 11.6% | 7.4%(+4.20)#93 | 4.9%(+6.70)#2,631 |
| 94. | 70744 | 11.6% | 7.4%(+4.20)#94 | 4.9%(+6.70)#2,637 |
| 95. | 71378 | 11.6% | 7.4%(+4.20)#95 | 4.9%(+6.70)#2,647 |
| 96. | 71366 | 11.6% | 7.4%(+4.20)#96 | 4.9%(+6.70)#2,649 |
| 97. | 70534 | 11.6% | 7.4%(+4.20)#97 | 4.9%(+6.70)#2,655 |
| 98. | 71426 | 11.6% | 7.4%(+4.20)#98 | 4.9%(+6.70)#2,667 |
| 99. | 71327 | 11.5% | 7.4%(+4.10)#99 | 4.9%(+6.60)#2,685 |
| 100. | 70523 | 11.5% | 7.4%(+4.10)#100 | 4.9%(+6.60)#2,714 |
Common Questions
What are the Top 10 Zip Codes with the Highest Percentage of Households with Income Below $10,000 in Louisiana?
Top 10 Zip Codes with the Highest Percentage of Households with Income Below $10,000 in Louisiana are:
What zip code has the Highest Percentage of Households with Income Below $10,000 in Louisiana?
70451 has the Highest Percentage of Households with Income Below $10,000 in Louisiana with 100.0%.
What is the Percentage of Households with Income Below $10,000 in the State of Louisiana?
Percentage of Households with Income Below $10,000 in Louisiana is 7.4%.
What is the Percentage of Households with Income Below $10,000 in the United States?
Percentage of Households with Income Below $10,000 in the United States is 4.9%.