Zip Codes with the Highest Percentage of Households with Income Below $10,000 in Oklahoma
RELATED REPORTS & OPTIONS
Household Income | $0-10k
Oklahoma
Compare Zip Codes
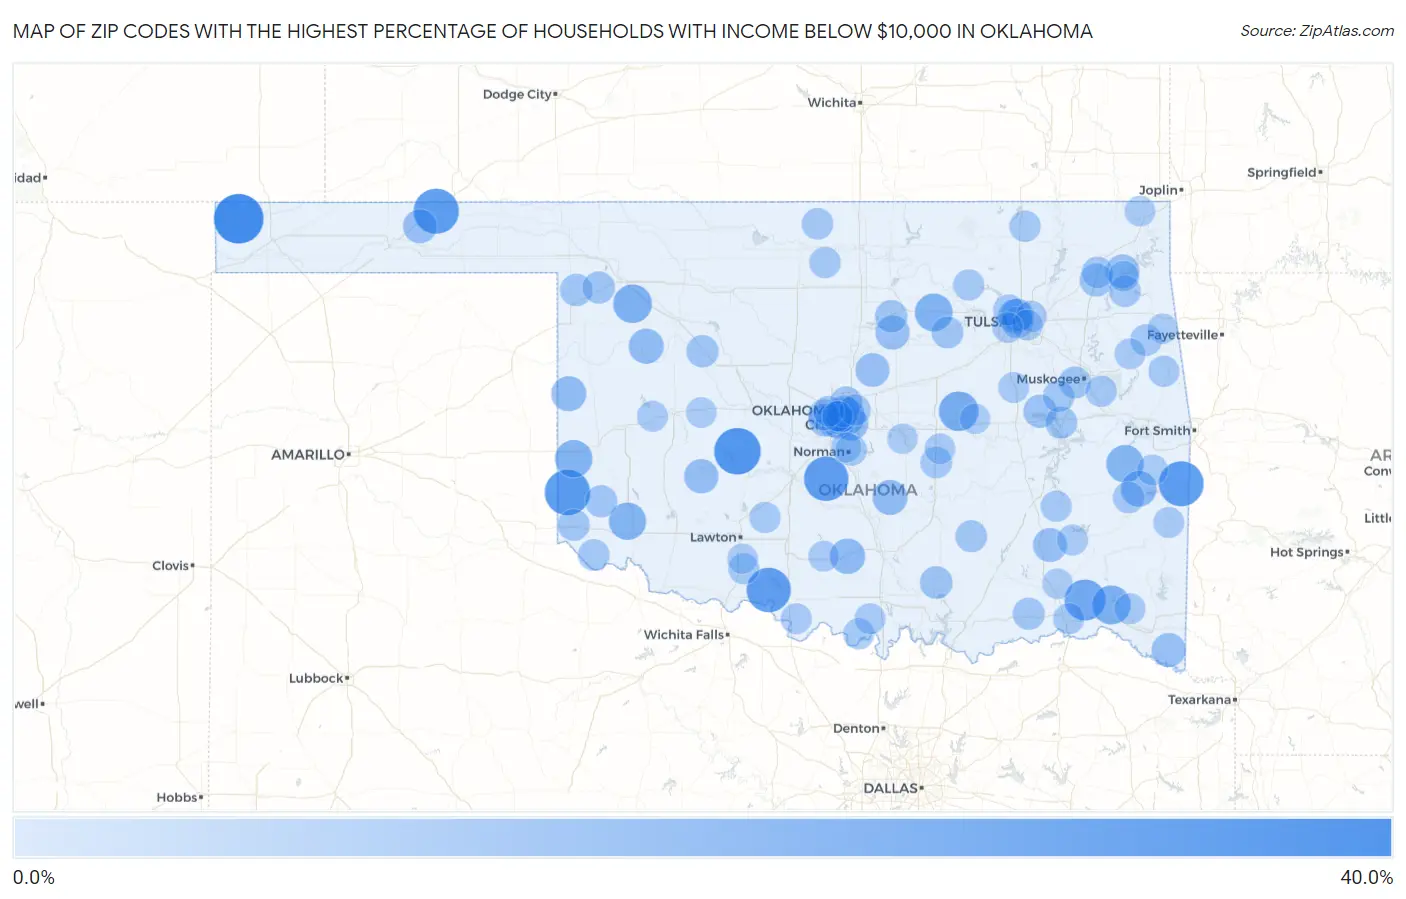
Map of Zip Codes with the Highest Percentage of Households with Income Below $10,000 in Oklahoma
0.0%
40.0%
Zip Codes with the Highest Percentage of Households with Income Below $10,000 in Oklahoma
| Zip Code | Households with Income < $10k | vs State | vs National | |
| 1. | 73946 | 40.0% | 5.6%(+34.4)#1 | 4.9%(+35.1)#175 |
| 2. | 73001 | 35.0% | 5.6%(+29.4)#2 | 4.9%(+30.1)#220 |
| 3. | 73571 | 33.3% | 5.6%(+27.7)#3 | 4.9%(+28.4)#255 |
| 4. | 73951 | 32.8% | 5.6%(+27.2)#4 | 4.9%(+27.9)#274 |
| 5. | 74947 | 32.4% | 5.6%(+26.8)#5 | 4.9%(+27.5)#282 |
| 6. | 73031 | 31.6% | 5.6%(+26.0)#6 | 4.9%(+26.7)#293 |
| 7. | 73548 | 31.3% | 5.6%(+25.7)#7 | 4.9%(+26.4)#300 |
| 8. | 74760 | 26.1% | 5.6%(+20.5)#8 | 4.9%(+21.2)#436 |
| 9. | 74829 | 23.8% | 5.6%(+18.2)#9 | 4.9%(+18.9)#543 |
| 10. | 74755 | 22.5% | 5.6%(+16.9)#10 | 4.9%(+17.6)#611 |
| 11. | 73857 | 22.2% | 5.6%(+16.6)#11 | 4.9%(+17.3)#624 |
| 12. | 74045 | 20.8% | 5.6%(+15.2)#12 | 4.9%(+15.9)#721 |
| 13. | 73117 | 20.5% | 5.6%(+14.9)#13 | 4.9%(+15.6)#745 |
| 14. | 74944 | 20.4% | 5.6%(+14.8)#14 | 4.9%(+15.5)#761 |
| 15. | 73645 | 20.4% | 5.6%(+14.8)#15 | 4.9%(+15.5)#763 |
| 16. | 73556 | 20.0% | 5.6%(+14.4)#16 | 4.9%(+15.1)#800 |
| 17. | 74935 | 17.5% | 5.6%(+11.9)#17 | 4.9%(+12.6)#1,094 |
| 18. | 73487 | 16.9% | 5.6%(+11.3)#18 | 4.9%(+12.0)#1,181 |
| 19. | 73835 | 16.5% | 5.6%(+10.9)#19 | 4.9%(+11.6)#1,253 |
| 20. | 73660 | 16.4% | 5.6%(+10.8)#20 | 4.9%(+11.5)#1,272 |
| 21. | 74831 | 16.3% | 5.6%(+10.7)#21 | 4.9%(+11.4)#1,286 |
| 22. | 73108 | 15.8% | 5.6%(+10.2)#22 | 4.9%(+10.9)#1,376 |
| 23. | 74106 | 15.2% | 5.6%(+9.60)#23 | 4.9%(+10.3)#1,478 |
| 24. | 73062 | 15.2% | 5.6%(+9.60)#24 | 4.9%(+10.3)#1,487 |
| 25. | 74074 | 14.9% | 5.6%(+9.30)#25 | 4.9%(+10.00)#1,539 |
| 26. | 74540 | 14.9% | 5.6%(+9.30)#26 | 4.9%(+10.00)#1,559 |
| 27. | 73145 | 14.8% | 5.6%(+9.20)#27 | 4.9%(+9.90)#1,570 |
| 28. | 74740 | 14.8% | 5.6%(+9.20)#28 | 4.9%(+9.90)#1,574 |
| 29. | 73945 | 14.7% | 5.6%(+9.10)#29 | 4.9%(+9.80)#1,598 |
| 30. | 73058 | 14.7% | 5.6%(+9.10)#30 | 4.9%(+9.80)#1,609 |
| 31. | 74349 | 14.3% | 5.6%(+8.70)#31 | 4.9%(+9.40)#1,699 |
| 32. | 74438 | 13.4% | 5.6%(+7.80)#32 | 4.9%(+8.50)#1,966 |
| 33. | 74330 | 13.2% | 5.6%(+7.60)#33 | 4.9%(+8.30)#2,009 |
| 34. | 73128 | 13.1% | 5.6%(+7.50)#34 | 4.9%(+8.20)#2,037 |
| 35. | 73109 | 12.9% | 5.6%(+7.30)#35 | 4.9%(+8.00)#2,113 |
| 36. | 74110 | 12.7% | 5.6%(+7.10)#36 | 4.9%(+7.80)#2,196 |
| 37. | 73460 | 12.7% | 5.6%(+7.10)#37 | 4.9%(+7.80)#2,202 |
| 38. | 73102 | 12.7% | 5.6%(+7.10)#38 | 4.9%(+7.80)#2,204 |
| 39. | 74075 | 12.3% | 5.6%(+6.70)#39 | 4.9%(+7.40)#2,328 |
| 40. | 73658 | 12.3% | 5.6%(+6.70)#40 | 4.9%(+7.40)#2,359 |
| 41. | 73843 | 12.2% | 5.6%(+6.60)#41 | 4.9%(+7.30)#2,390 |
| 42. | 73840 | 12.2% | 5.6%(+6.60)#42 | 4.9%(+7.30)#2,392 |
| 43. | 73104 | 12.1% | 5.6%(+6.50)#43 | 4.9%(+7.20)#2,425 |
| 44. | 73131 | 12.1% | 5.6%(+6.50)#44 | 4.9%(+7.20)#2,426 |
| 45. | 73554 | 11.9% | 5.6%(+6.30)#45 | 4.9%(+7.00)#2,517 |
| 46. | 74727 | 11.8% | 5.6%(+6.20)#46 | 4.9%(+6.90)#2,557 |
| 47. | 74401 | 11.6% | 5.6%(+6.00)#47 | 4.9%(+6.70)#2,629 |
| 48. | 73111 | 11.5% | 5.6%(+5.90)#48 | 4.9%(+6.60)#2,678 |
| 49. | 74052 | 11.5% | 5.6%(+5.90)#49 | 4.9%(+6.60)#2,703 |
| 50. | 74426 | 11.4% | 5.6%(+5.80)#50 | 4.9%(+6.50)#2,734 |
| 51. | 73550 | 11.4% | 5.6%(+5.80)#51 | 4.9%(+6.50)#2,756 |
| 52. | 74534 | 11.3% | 5.6%(+5.70)#52 | 4.9%(+6.40)#2,829 |
| 53. | 74468 | 11.2% | 5.6%(+5.60)#53 | 4.9%(+6.30)#2,876 |
| 54. | 74830 | 11.1% | 5.6%(+5.50)#54 | 4.9%(+6.20)#2,933 |
| 55. | 74942 | 11.1% | 5.6%(+5.50)#55 | 4.9%(+6.20)#2,934 |
| 56. | 74104 | 11.0% | 5.6%(+5.40)#56 | 4.9%(+6.10)#2,963 |
| 57. | 74332 | 11.0% | 5.6%(+5.40)#57 | 4.9%(+6.10)#2,978 |
| 58. | 74366 | 11.0% | 5.6%(+5.40)#58 | 4.9%(+6.10)#2,980 |
| 59. | 73537 | 11.0% | 5.6%(+5.40)#59 | 4.9%(+6.10)#2,987 |
| 60. | 74457 | 11.0% | 5.6%(+5.40)#60 | 4.9%(+6.10)#2,993 |
| 61. | 73759 | 10.9% | 5.6%(+5.30)#61 | 4.9%(+6.00)#3,031 |
| 62. | 73071 | 10.7% | 5.6%(+5.10)#62 | 4.9%(+5.80)#3,111 |
| 63. | 73141 | 10.6% | 5.6%(+5.00)#63 | 4.9%(+5.70)#3,196 |
| 64. | 74640 | 10.6% | 5.6%(+5.00)#64 | 4.9%(+5.70)#3,221 |
| 65. | 74029 | 10.5% | 5.6%(+4.90)#65 | 4.9%(+5.60)#3,249 |
| 66. | 73127 | 10.4% | 5.6%(+4.80)#66 | 4.9%(+5.50)#3,292 |
| 67. | 74960 | 10.4% | 5.6%(+4.80)#67 | 4.9%(+5.50)#3,303 |
| 68. | 74126 | 10.4% | 5.6%(+4.80)#68 | 4.9%(+5.50)#3,305 |
| 69. | 74423 | 10.4% | 5.6%(+4.80)#69 | 4.9%(+5.50)#3,338 |
| 70. | 74035 | 10.3% | 5.6%(+4.70)#70 | 4.9%(+5.40)#3,380 |
| 71. | 73572 | 10.3% | 5.6%(+4.70)#71 | 4.9%(+5.40)#3,385 |
| 72. | 74547 | 10.2% | 5.6%(+4.60)#72 | 4.9%(+5.30)#3,452 |
| 73. | 73430 | 10.2% | 5.6%(+4.60)#73 | 4.9%(+5.30)#3,467 |
| 74. | 73567 | 10.2% | 5.6%(+4.60)#74 | 4.9%(+5.30)#3,471 |
| 75. | 74743 | 10.1% | 5.6%(+4.50)#75 | 4.9%(+5.20)#3,510 |
| 76. | 74116 | 10.0% | 5.6%(+4.40)#76 | 4.9%(+5.10)#3,595 |
| 77. | 74766 | 10.0% | 5.6%(+4.40)#77 | 4.9%(+5.10)#3,613 |
| 78. | 73565 | 10.0% | 5.6%(+4.40)#78 | 4.9%(+5.10)#3,616 |
| 79. | 73647 | 10.0% | 5.6%(+4.40)#79 | 4.9%(+5.10)#3,623 |
| 80. | 74956 | 9.9% | 5.6%(+4.30)#80 | 4.9%(+5.00)#3,680 |
| 81. | 74536 | 9.9% | 5.6%(+4.30)#81 | 4.9%(+5.00)#3,684 |
| 82. | 74939 | 9.9% | 5.6%(+4.30)#82 | 4.9%(+5.00)#3,688 |
| 83. | 74447 | 9.8% | 5.6%(+4.20)#83 | 4.9%(+4.90)#3,723 |
| 84. | 73453 | 9.8% | 5.6%(+4.20)#84 | 4.9%(+4.90)#3,779 |
| 85. | 74464 | 9.7% | 5.6%(+4.10)#85 | 4.9%(+4.80)#3,797 |
| 86. | 74129 | 9.7% | 5.6%(+4.10)#86 | 4.9%(+4.80)#3,811 |
| 87. | 73122 | 9.7% | 5.6%(+4.10)#87 | 4.9%(+4.80)#3,817 |
| 88. | 74107 | 9.5% | 5.6%(+3.90)#88 | 4.9%(+4.60)#3,963 |
| 89. | 74868 | 9.5% | 5.6%(+3.90)#89 | 4.9%(+4.60)#3,968 |
| 90. | 73491 | 9.5% | 5.6%(+3.90)#90 | 4.9%(+4.60)#4,009 |
| 91. | 74340 | 9.5% | 5.6%(+3.90)#91 | 4.9%(+4.60)#4,018 |
| 92. | 73096 | 9.4% | 5.6%(+3.80)#92 | 4.9%(+4.50)#4,035 |
| 93. | 74523 | 9.4% | 5.6%(+3.80)#93 | 4.9%(+4.50)#4,045 |
| 94. | 73106 | 9.3% | 5.6%(+3.70)#94 | 4.9%(+4.40)#4,112 |
| 95. | 74339 | 9.3% | 5.6%(+3.70)#95 | 4.9%(+4.40)#4,141 |
| 96. | 74801 | 9.2% | 5.6%(+3.60)#96 | 4.9%(+4.30)#4,211 |
| 97. | 74859 | 9.2% | 5.6%(+3.60)#97 | 4.9%(+4.30)#4,234 |
| 98. | 73069 | 9.1% | 5.6%(+3.50)#98 | 4.9%(+4.20)#4,300 |
| 99. | 74964 | 9.1% | 5.6%(+3.50)#99 | 4.9%(+4.20)#4,345 |
| 100. | 73543 | 9.1% | 5.6%(+3.50)#100 | 4.9%(+4.20)#4,349 |
Common Questions
What are the Top 10 Zip Codes with the Highest Percentage of Households with Income Below $10,000 in Oklahoma?
Top 10 Zip Codes with the Highest Percentage of Households with Income Below $10,000 in Oklahoma are:
What zip code has the Highest Percentage of Households with Income Below $10,000 in Oklahoma?
73946 has the Highest Percentage of Households with Income Below $10,000 in Oklahoma with 40.0%.
What is the Percentage of Households with Income Below $10,000 in the State of Oklahoma?
Percentage of Households with Income Below $10,000 in Oklahoma is 5.6%.
What is the Percentage of Households with Income Below $10,000 in the United States?
Percentage of Households with Income Below $10,000 in the United States is 4.9%.