Zip Codes with the Highest Percentage of Population Employed in Legal Services & Support in Haverhill, MA
RELATED REPORTS & OPTIONS
Legal Services & Support
Haverhill
Compare Zip Codes
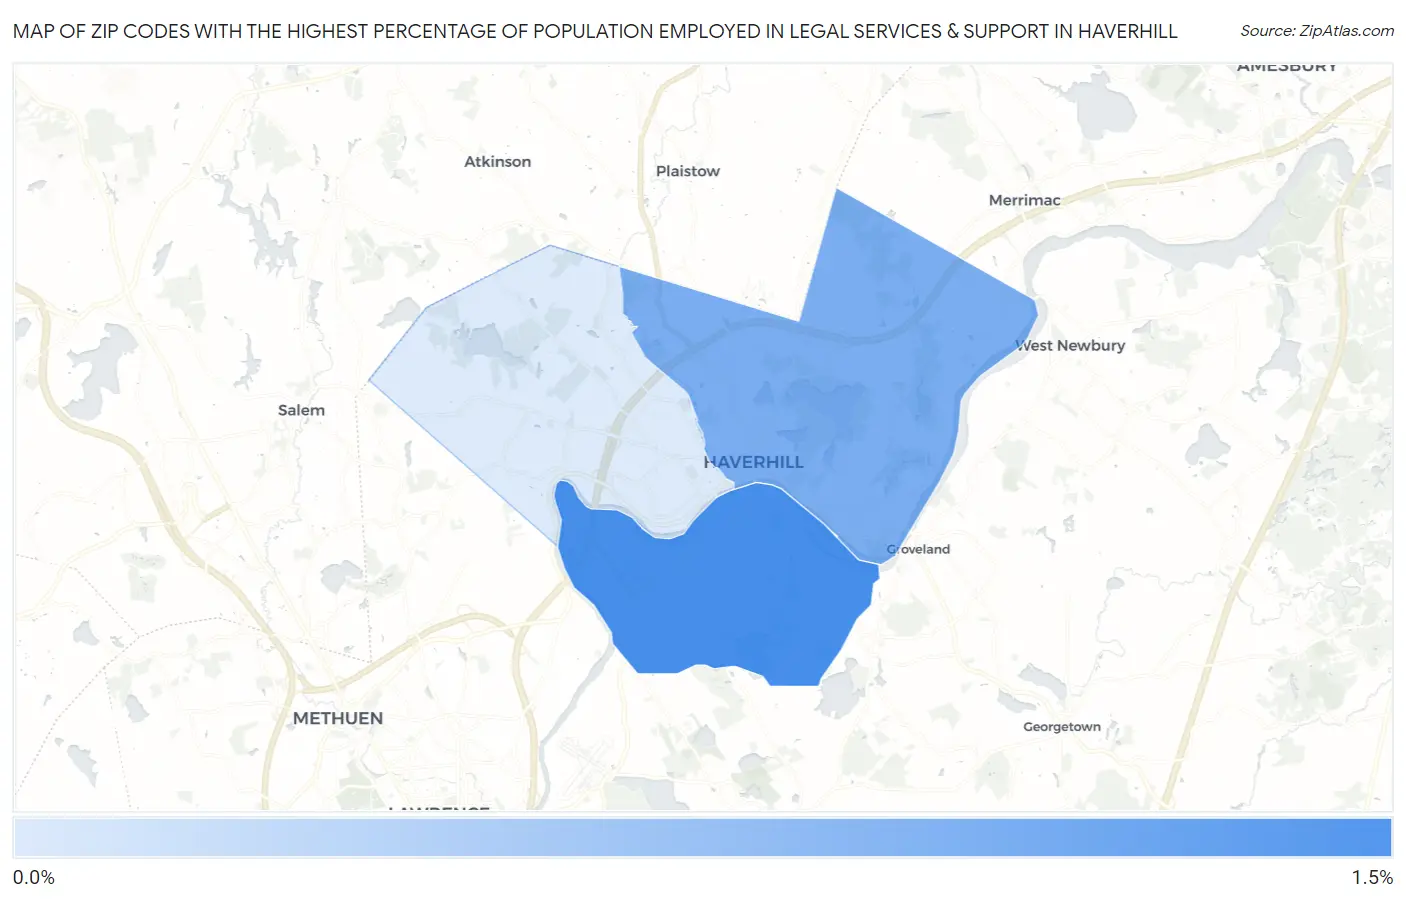
Map of Zip Codes with the Highest Percentage of Population Employed in Legal Services & Support in Haverhill
0.34%
1.1%
Zip Codes with the Highest Percentage of Population Employed in Legal Services & Support in Haverhill, MA
| Zip Code | % Employed | vs State | vs National | |
| 1. | 01835 | 1.1% | 1.5%(-0.397)#246 | 1.2%(-0.093)#7,234 |
| 2. | 01830 | 0.84% | 1.5%(-0.652)#299 | 1.2%(-0.347)#9,134 |
| 3. | 01832 | 0.34% | 1.5%(-1.15)#397 | 1.2%(-0.842)#14,565 |
1
Common Questions
What are the Top Zip Codes with the Highest Percentage of Population Employed in Legal Services & Support in Haverhill, MA?
Top Zip Codes with the Highest Percentage of Population Employed in Legal Services & Support in Haverhill, MA are:
What zip code has the Highest Percentage of Population Employed in Legal Services & Support in Haverhill, MA?
01835 has the Highest Percentage of Population Employed in Legal Services & Support in Haverhill, MA with 1.1%.
What is the Percentage of Population Employed in Legal Services & Support in Haverhill, MA?
Percentage of Population Employed in Legal Services & Support in Haverhill is 0.71%.
What is the Percentage of Population Employed in Legal Services & Support in Massachusetts?
Percentage of Population Employed in Legal Services & Support in Massachusetts is 1.5%.
What is the Percentage of Population Employed in Legal Services & Support in the United States?
Percentage of Population Employed in Legal Services & Support in the United States is 1.2%.