Pepperell, MA Map & Demographics
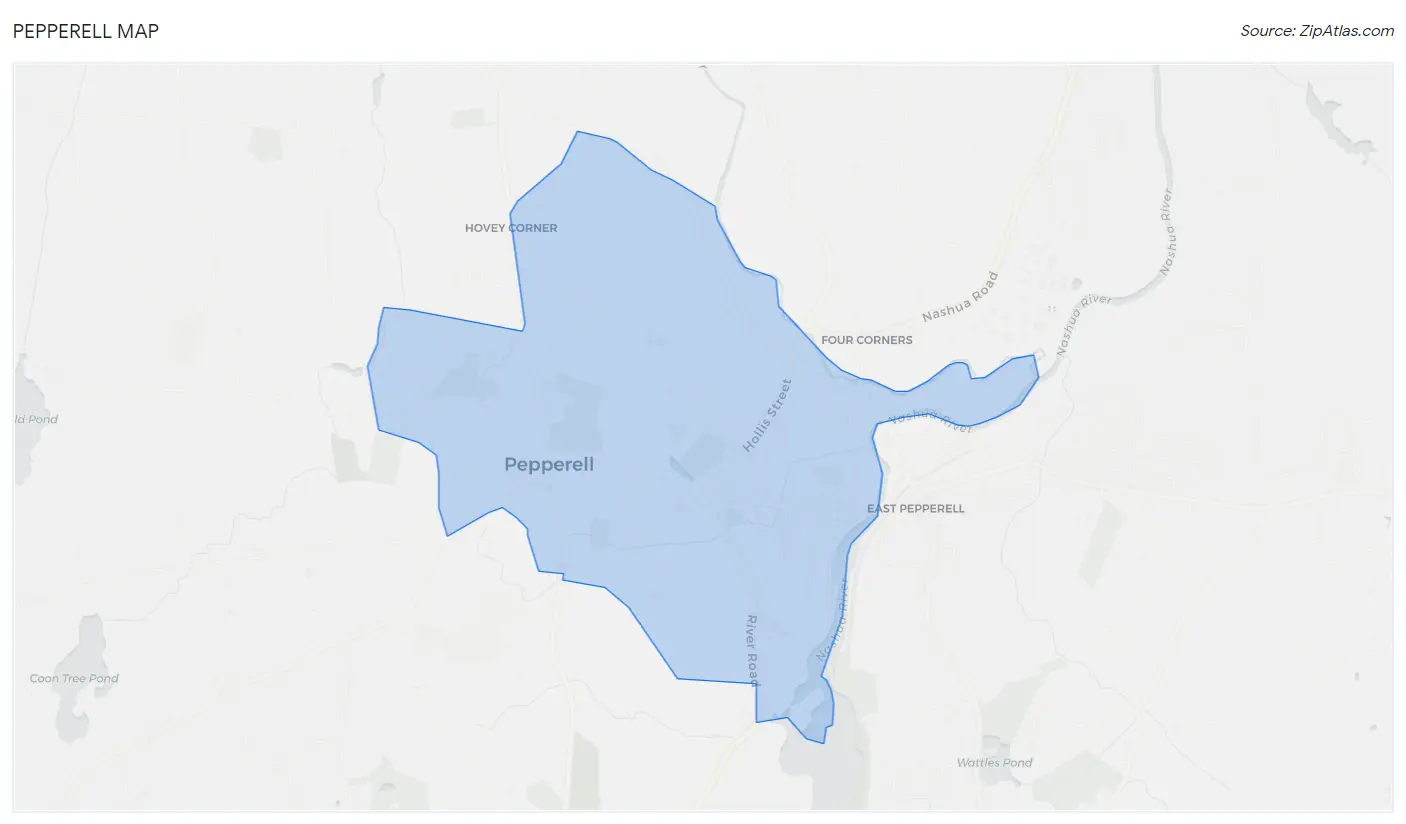
Pepperell Map
Pepperell Overview
$51,102
PER CAPITA INCOME
$139,773
AVG FAMILY INCOME
$91,406
AVG HOUSEHOLD INCOME
39.6%
WAGE / INCOME GAP [ % ]
60.4¢/ $1
WAGE / INCOME GAP [ $ ]
0.47
INEQUALITY / GINI INDEX
2,205
TOTAL POPULATION
981
MALE POPULATION
1,224
FEMALE POPULATION
80.15
MALES / 100 FEMALES
124.77
FEMALES / 100 MALES
47.6
MEDIAN AGE
2.8
AVG FAMILY SIZE
2.0
AVG HOUSEHOLD SIZE
1,183
LABOR FORCE [ PEOPLE ]
61.8%
PERCENT IN LABOR FORCE
6.6%
UNEMPLOYMENT RATE
Pepperell Zip Codes
Income in Pepperell
Income Overview in Pepperell
Per Capita Income in Pepperell is $51,102, while median incomes of families and households are $139,773 and $91,406 respectively.
| Characteristic | Number | Measure |
| Per Capita Income | 2,205 | $51,102 |
| Median Family Income | 564 | $139,773 |
| Mean Family Income | 564 | $149,708 |
| Median Household Income | 1,047 | $91,406 |
| Mean Household Income | 1,047 | $105,844 |
| Income Deficit | 564 | $0 |
| Wage / Income Gap (%) | 2,205 | 39.62% |
| Wage / Income Gap ($) | 2,205 | 60.38¢ per $1 |
| Gini / Inequality Index | 2,205 | 0.47 |
Earnings by Sex in Pepperell
Average Earnings in Pepperell are $68,750, $91,607 for men and $55,313 for women, a difference of 39.6%.
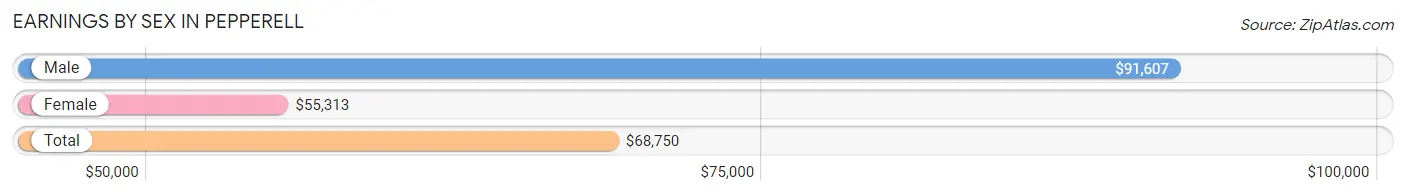
| Sex | Number | Average Earnings |
| Male | 577 (49.4%) | $91,607 |
| Female | 591 (50.6%) | $55,313 |
| Total | 1,168 (100.0%) | $68,750 |
Earnings by Sex by Income Bracket in Pepperell
The most common earnings brackets in Pepperell are $100,000+ for men (286 | 49.6%) and $75,000 to $99,999 for women (108 | 18.3%).
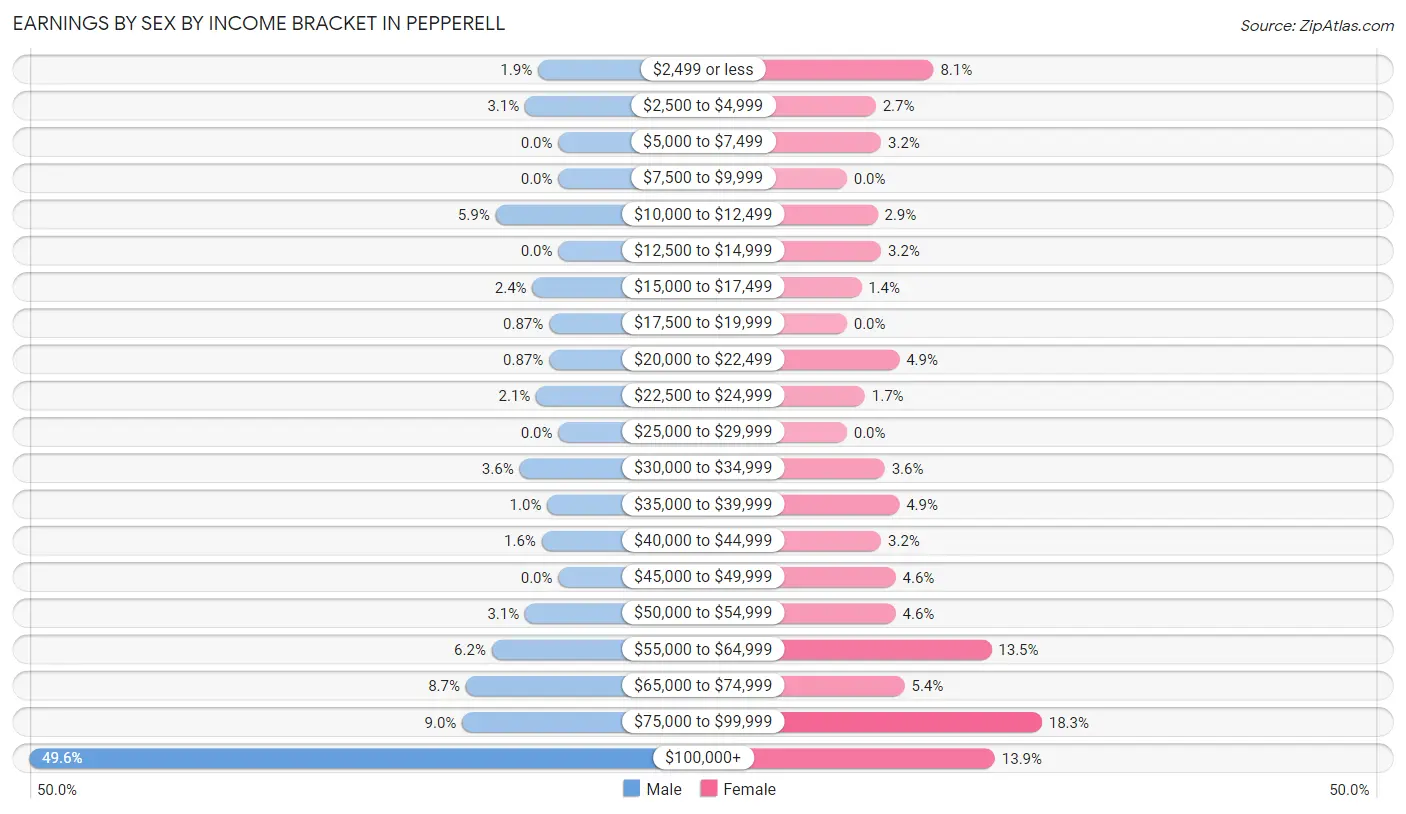
| Income | Male | Female |
| $2,499 or less | 11 (1.9%) | 48 (8.1%) |
| $2,500 to $4,999 | 18 (3.1%) | 16 (2.7%) |
| $5,000 to $7,499 | 0 (0.0%) | 19 (3.2%) |
| $7,500 to $9,999 | 0 (0.0%) | 0 (0.0%) |
| $10,000 to $12,499 | 34 (5.9%) | 17 (2.9%) |
| $12,500 to $14,999 | 0 (0.0%) | 19 (3.2%) |
| $15,000 to $17,499 | 14 (2.4%) | 8 (1.3%) |
| $17,500 to $19,999 | 5 (0.9%) | 0 (0.0%) |
| $20,000 to $22,499 | 5 (0.9%) | 29 (4.9%) |
| $22,500 to $24,999 | 12 (2.1%) | 10 (1.7%) |
| $25,000 to $29,999 | 0 (0.0%) | 0 (0.0%) |
| $30,000 to $34,999 | 21 (3.6%) | 21 (3.5%) |
| $35,000 to $39,999 | 6 (1.0%) | 29 (4.9%) |
| $40,000 to $44,999 | 9 (1.6%) | 19 (3.2%) |
| $45,000 to $49,999 | 0 (0.0%) | 27 (4.6%) |
| $50,000 to $54,999 | 18 (3.1%) | 27 (4.6%) |
| $55,000 to $64,999 | 36 (6.2%) | 80 (13.5%) |
| $65,000 to $74,999 | 50 (8.7%) | 32 (5.4%) |
| $75,000 to $99,999 | 52 (9.0%) | 108 (18.3%) |
| $100,000+ | 286 (49.6%) | 82 (13.9%) |
| Total | 577 (100.0%) | 591 (100.0%) |
Earnings by Sex by Educational Attainment in Pepperell
Average earnings in Pepperell are $116,027 for men and $56,250 for women, a difference of 51.5%. Men with an educational attainment of bachelor's degree enjoy the highest average annual earnings of $124,055, while those with high school diploma education earn the least with $59,917. Women with an educational attainment of bachelor's degree earn the most with the average annual earnings of $80,326, while those with high school diploma education have the smallest earnings of $39,722.
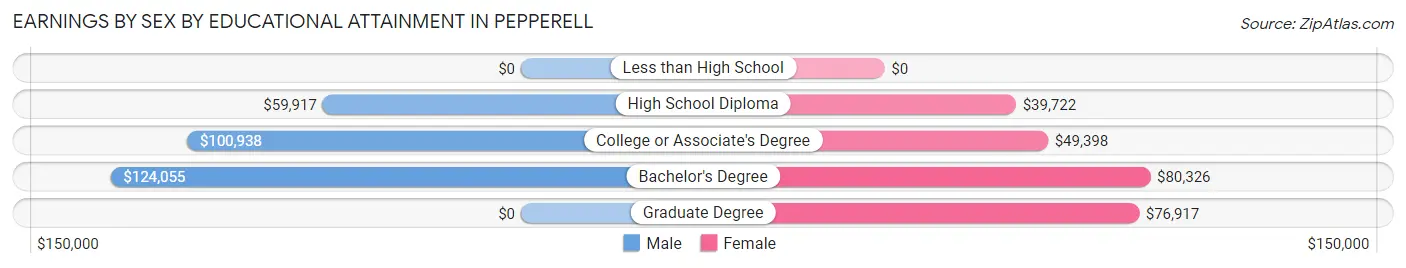
| Educational Attainment | Male Income | Female Income |
| Less than High School | - | - |
| High School Diploma | $59,917 | $39,722 |
| College or Associate's Degree | $100,938 | $49,398 |
| Bachelor's Degree | $124,055 | $80,326 |
| Graduate Degree | - | - |
| Total | $116,027 | $56,250 |
Family Income in Pepperell
Family Income Brackets in Pepperell
According to the Pepperell family income data, there are 165 families falling into the $100,000 to $149,999 income range, which is the most common income bracket and makes up 29.3% of all families.
| Income Bracket | # Families | % Families |
| Less than $10,000 | 13 | 2.3% |
| $10,000 to $14,999 | 0 | 0.0% |
| $15,000 to $24,999 | 0 | 0.0% |
| $25,000 to $34,999 | 18 | 3.2% |
| $35,000 to $49,999 | 67 | 11.9% |
| $50,000 to $74,999 | 51 | 9.0% |
| $75,000 to $99,999 | 29 | 5.1% |
| $100,000 to $149,999 | 165 | 29.3% |
| $150,000 to $199,999 | 91 | 16.1% |
| $200,000+ | 130 | 23.0% |
Family Income by Famaliy Size in Pepperell
4-person families (150 | 26.6%) account for the highest median family income in Pepperell with $195,625 per family, while 2-person families (269 | 47.7%) have the highest median income of $49,943 per family member.
| Income Bracket | # Families | Median Income |
| 2-Person Families | 269 (47.7%) | $99,886 |
| 3-Person Families | 138 (24.5%) | $118,864 |
| 4-Person Families | 150 (26.6%) | $195,625 |
| 5-Person Families | 7 (1.2%) | $0 |
| 6-Person Families | 0 (0.0%) | $0 |
| 7+ Person Families | 0 (0.0%) | $0 |
| Total | 564 (100.0%) | $139,773 |
Family Income by Number of Earners in Pepperell
The median family income in Pepperell is $139,773, with families comprising 3+ earners (83) having the highest median family income of $218,393, while families with no earners (112) have the lowest median family income of $46,129, accounting for 14.7% and 19.9% of families, respectively.
| Number of Earners | # Families | Median Income |
| No Earners | 112 (19.9%) | $46,129 |
| 1 Earner | 132 (23.4%) | $119,643 |
| 2 Earners | 237 (42.0%) | $153,021 |
| 3+ Earners | 83 (14.7%) | $218,393 |
| Total | 564 (100.0%) | $139,773 |
Household Income in Pepperell
Household Income Brackets in Pepperell
With 236 households falling in the category, the $100,000 to $149,999 income range is the most frequent in Pepperell, accounting for 22.5% of all households. In contrast, only 32 households (3.1%) fall into the $15,000 to $24,999 income bracket, making it the least populous group.
| Income Bracket | # Households | % Households |
| Less than $10,000 | 101 | 9.6% |
| $10,000 to $14,999 | 83 | 7.9% |
| $15,000 to $24,999 | 32 | 3.1% |
| $25,000 to $34,999 | 32 | 3.1% |
| $35,000 to $49,999 | 117 | 11.2% |
| $50,000 to $74,999 | 138 | 13.2% |
| $75,000 to $99,999 | 53 | 5.1% |
| $100,000 to $149,999 | 236 | 22.5% |
| $150,000 to $199,999 | 117 | 11.2% |
| $200,000+ | 138 | 13.2% |
Household Income by Householder Age in Pepperell
The median household income in Pepperell is $91,406, with the highest median household income of $136,667 found in the 45 to 64 years age bracket for the primary householder. A total of 366 households (35.0%) fall into this category. Meanwhile, the 15 to 24 years age bracket for the primary householder has the lowest median household income of $0, with 52 households (5.0%) in this group.
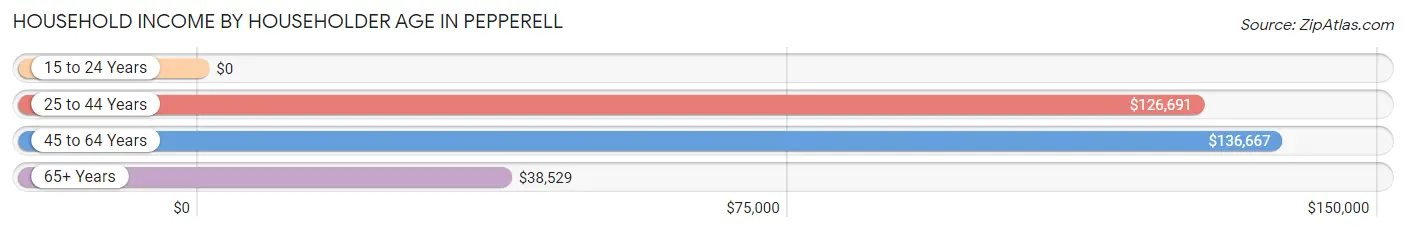
| Income Bracket | # Households | Median Income |
| 15 to 24 Years | 52 (5.0%) | $0 |
| 25 to 44 Years | 289 (27.6%) | $126,691 |
| 45 to 64 Years | 366 (35.0%) | $136,667 |
| 65+ Years | 340 (32.5%) | $38,529 |
| Total | 1,047 (100.0%) | $91,406 |
Poverty in Pepperell
Income Below Poverty by Sex and Age in Pepperell
With 6.5% poverty level for males and 13.8% for females among the residents of Pepperell, 65 to 74 year old males and 75 year old and over females are the most vulnerable to poverty, with 27 males (31.8%) and 28 females (31.5%) in their respective age groups living below the poverty level.
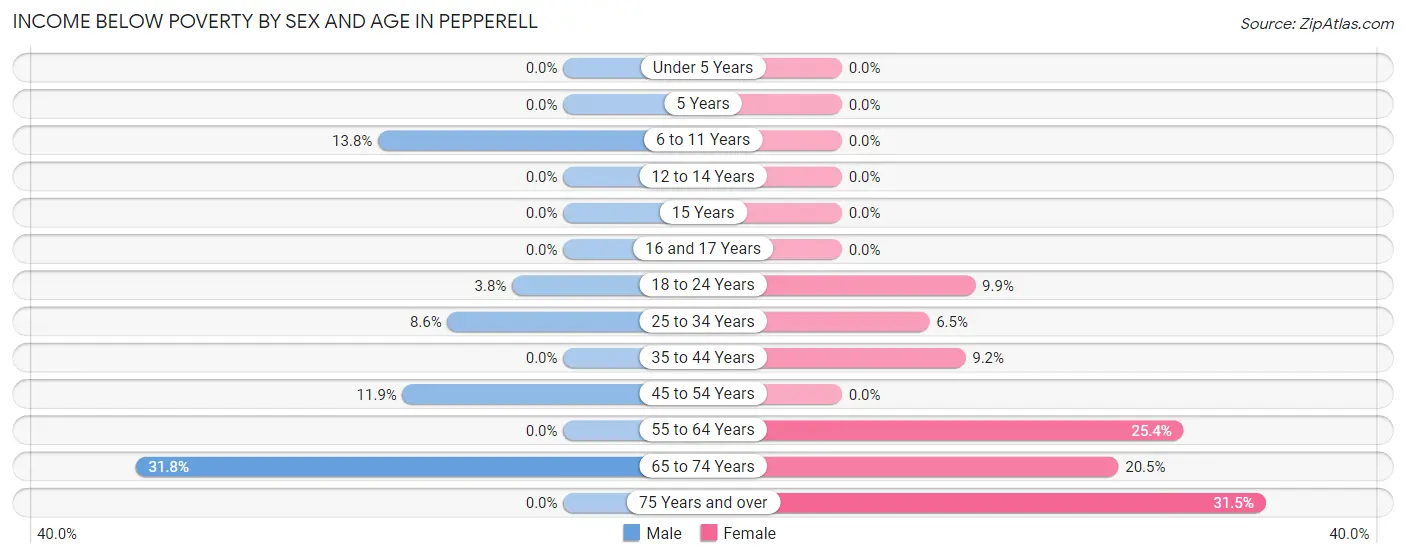
| Age Bracket | Male | Female |
| Under 5 Years | 0 (0.0%) | 0 (0.0%) |
| 5 Years | 0 (0.0%) | 0 (0.0%) |
| 6 to 11 Years | 11 (13.8%) | 0 (0.0%) |
| 12 to 14 Years | 0 (0.0%) | 0 (0.0%) |
| 15 Years | 0 (0.0%) | 0 (0.0%) |
| 16 and 17 Years | 0 (0.0%) | 0 (0.0%) |
| 18 to 24 Years | 3 (3.8%) | 10 (9.9%) |
| 25 to 34 Years | 8 (8.6%) | 10 (6.5%) |
| 35 to 44 Years | 0 (0.0%) | 11 (9.2%) |
| 45 to 54 Years | 13 (11.9%) | 0 (0.0%) |
| 55 to 64 Years | 0 (0.0%) | 66 (25.4%) |
| 65 to 74 Years | 27 (31.8%) | 39 (20.5%) |
| 75 Years and over | 0 (0.0%) | 28 (31.5%) |
| Total | 62 (6.5%) | 164 (13.8%) |
Income Above Poverty by Sex and Age in Pepperell
According to the poverty statistics in Pepperell, males aged under 5 years and females aged under 5 years are the age groups that are most secure financially, with 100.0% of males and 100.0% of females in these age groups living above the poverty line.
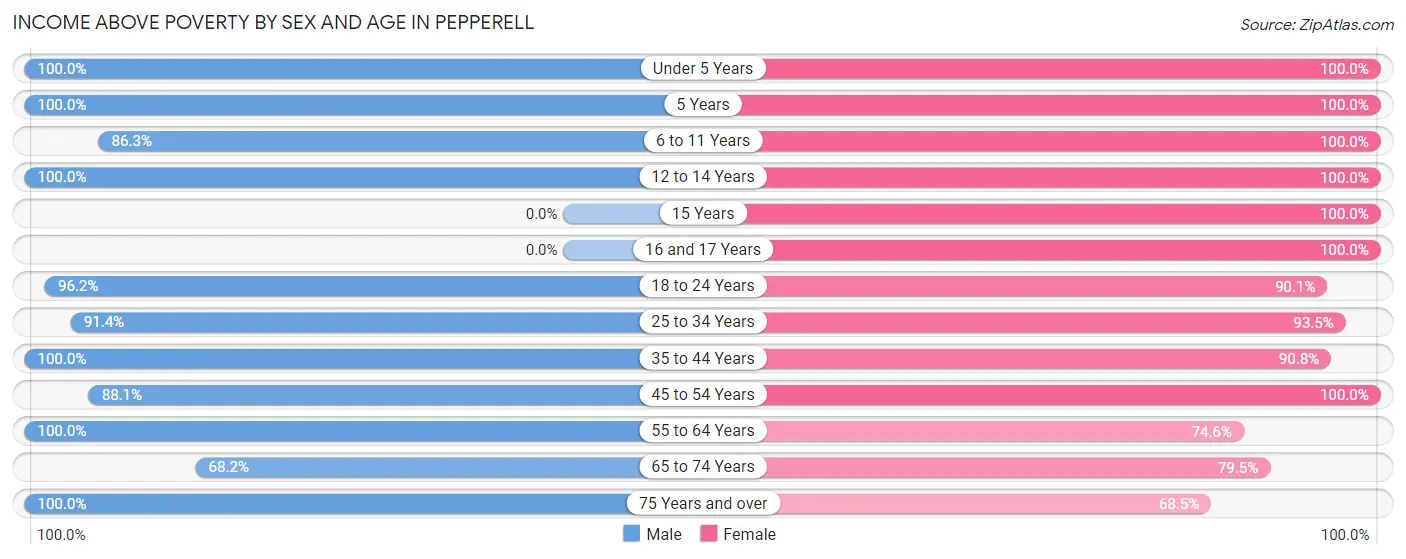
| Age Bracket | Male | Female |
| Under 5 Years | 24 (100.0%) | 33 (100.0%) |
| 5 Years | 26 (100.0%) | 51 (100.0%) |
| 6 to 11 Years | 69 (86.3%) | 16 (100.0%) |
| 12 to 14 Years | 25 (100.0%) | 12 (100.0%) |
| 15 Years | 0 (0.0%) | 7 (100.0%) |
| 16 and 17 Years | 0 (0.0%) | 14 (100.0%) |
| 18 to 24 Years | 76 (96.2%) | 91 (90.1%) |
| 25 to 34 Years | 85 (91.4%) | 144 (93.5%) |
| 35 to 44 Years | 187 (100.0%) | 109 (90.8%) |
| 45 to 54 Years | 96 (88.1%) | 143 (100.0%) |
| 55 to 64 Years | 151 (100.0%) | 194 (74.6%) |
| 65 to 74 Years | 58 (68.2%) | 151 (79.5%) |
| 75 Years and over | 90 (100.0%) | 61 (68.5%) |
| Total | 887 (93.5%) | 1,026 (86.2%) |
Income Below Poverty Among Married-Couple Families in Pepperell
The poverty statistics for married-couple families in Pepperell show that 2.9% or 13 of the total 444 families live below the poverty line. Families with 1 or 2 children have the highest poverty rate of 8.3%, comprising of 13 families. On the other hand, families with no children have the lowest poverty rate of 0.0%, which includes 0 families.
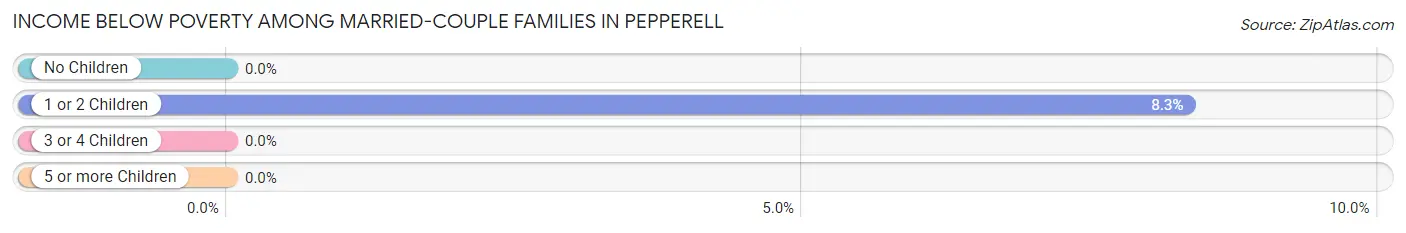
| Children | Above Poverty | Below Poverty |
| No Children | 281 (100.0%) | 0 (0.0%) |
| 1 or 2 Children | 143 (91.7%) | 13 (8.3%) |
| 3 or 4 Children | 7 (100.0%) | 0 (0.0%) |
| 5 or more Children | 0 (0.0%) | 0 (0.0%) |
| Total | 431 (97.1%) | 13 (2.9%) |
Income Below Poverty Among Single-Parent Households in Pepperell
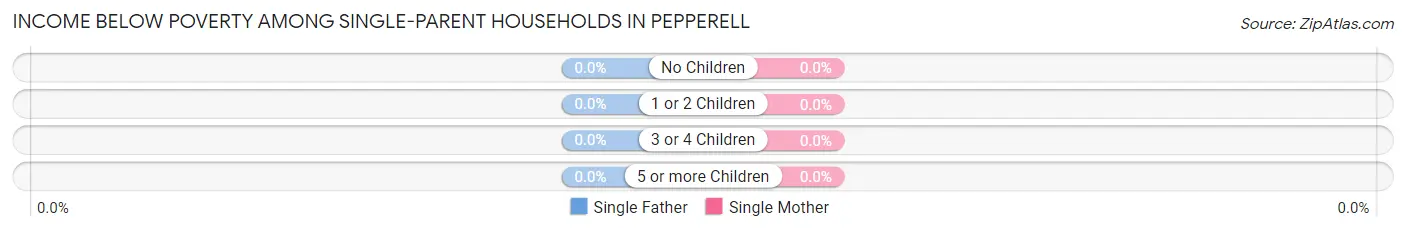
| Children | Single Father | Single Mother |
| No Children | 0 (0.0%) | 0 (0.0%) |
| 1 or 2 Children | 0 (0.0%) | 0 (0.0%) |
| 3 or 4 Children | 0 (0.0%) | 0 (0.0%) |
| 5 or more Children | 0 (0.0%) | 0 (0.0%) |
| Total | 0 (0.0%) | 0 (0.0%) |
Income Below Poverty Among Married-Couple vs Single-Parent Households in Pepperell
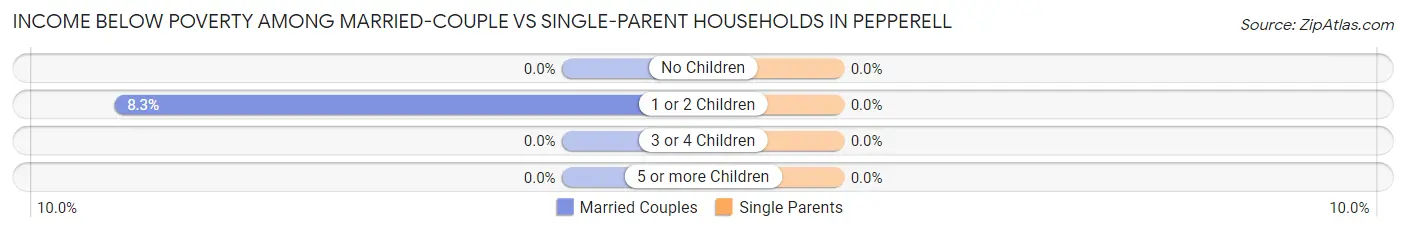
| Children | Married-Couple Families | Single-Parent Households |
| No Children | 0 (0.0%) | 0 (0.0%) |
| 1 or 2 Children | 13 (8.3%) | 0 (0.0%) |
| 3 or 4 Children | 0 (0.0%) | 0 (0.0%) |
| 5 or more Children | 0 (0.0%) | 0 (0.0%) |
| Total | 13 (2.9%) | 0 (0.0%) |
Race in Pepperell
The most populous races in Pepperell are White / Caucasian (1,835 | 83.2%), Hispanic or Latino (181 | 8.2%), and Two or more Races (173 | 7.9%).
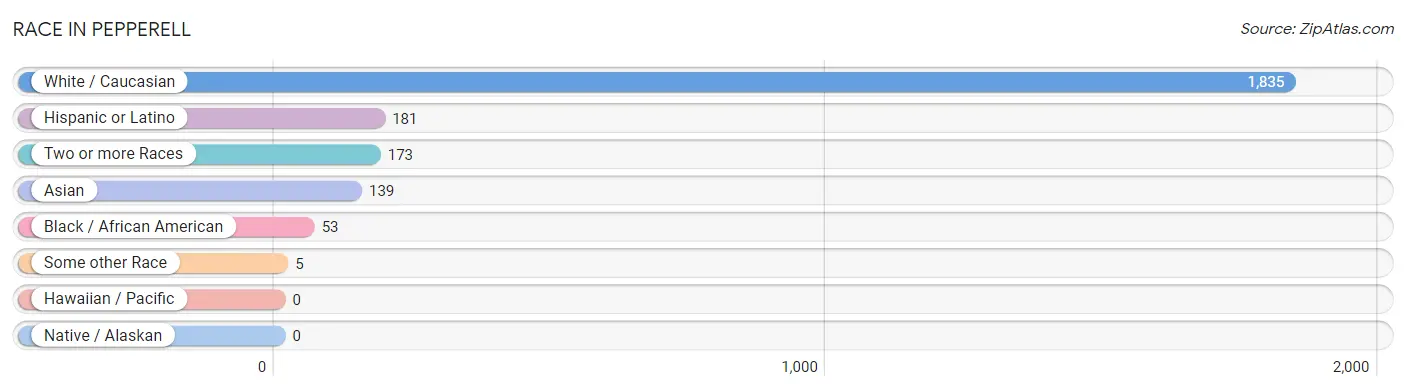
| Race | # Population | % Population |
| Asian | 139 | 6.3% |
| Black / African American | 53 | 2.4% |
| Hawaiian / Pacific | 0 | 0.0% |
| Hispanic or Latino | 181 | 8.2% |
| Native / Alaskan | 0 | 0.0% |
| White / Caucasian | 1,835 | 83.2% |
| Two or more Races | 173 | 7.9% |
| Some other Race | 5 | 0.2% |
| Total | 2,205 | 100.0% |
Ancestry in Pepperell
The most populous ancestries reported in Pepperell are Irish (736 | 33.4%), Italian (386 | 17.5%), English (317 | 14.4%), French (254 | 11.5%), and French Canadian (184 | 8.3%), together accounting for 85.1% of all Pepperell residents.
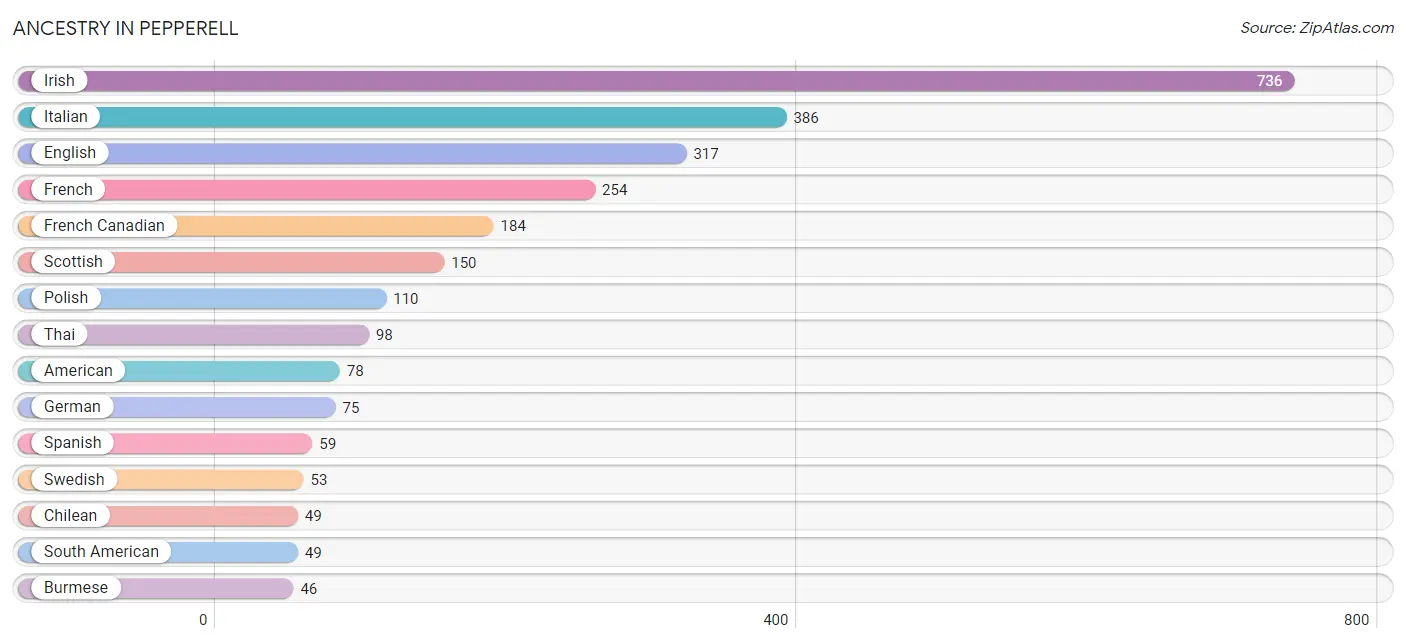
| Ancestry | # Population | % Population |
| American | 78 | 3.5% |
| Armenian | 23 | 1.0% |
| Australian | 18 | 0.8% |
| Bhutanese | 19 | 0.9% |
| British | 28 | 1.3% |
| Burmese | 46 | 2.1% |
| Chilean | 49 | 2.2% |
| Danish | 19 | 0.9% |
| Dominican | 39 | 1.8% |
| Dutch | 15 | 0.7% |
| English | 317 | 14.4% |
| Finnish | 22 | 1.0% |
| French | 254 | 11.5% |
| French Canadian | 184 | 8.3% |
| German | 75 | 3.4% |
| Irish | 736 | 33.4% |
| Italian | 386 | 17.5% |
| Lithuanian | 18 | 0.8% |
| Norwegian | 6 | 0.3% |
| Polish | 110 | 5.0% |
| Portuguese | 36 | 1.6% |
| Puerto Rican | 34 | 1.5% |
| Scandinavian | 27 | 1.2% |
| Scotch-Irish | 10 | 0.4% |
| Scottish | 150 | 6.8% |
| South American | 49 | 2.2% |
| Spanish | 59 | 2.7% |
| Sri Lankan | 32 | 1.5% |
| Swedish | 53 | 2.4% |
| Thai | 98 | 4.4% |
| U.S. Virgin Islander | 3 | 0.1% |
| Ukrainian | 11 | 0.5% |
| Welsh | 6 | 0.3% | View All 33 Rows |
Immigrants in Pepperell
The most numerous immigrant groups reported in Pepperell came from Asia (157 | 7.1%), India (98 | 4.4%), South Central Asia (98 | 4.4%), South Eastern Asia (32 | 1.5%), and Vietnam (32 | 1.5%), together accounting for 18.9% of all Pepperell residents.
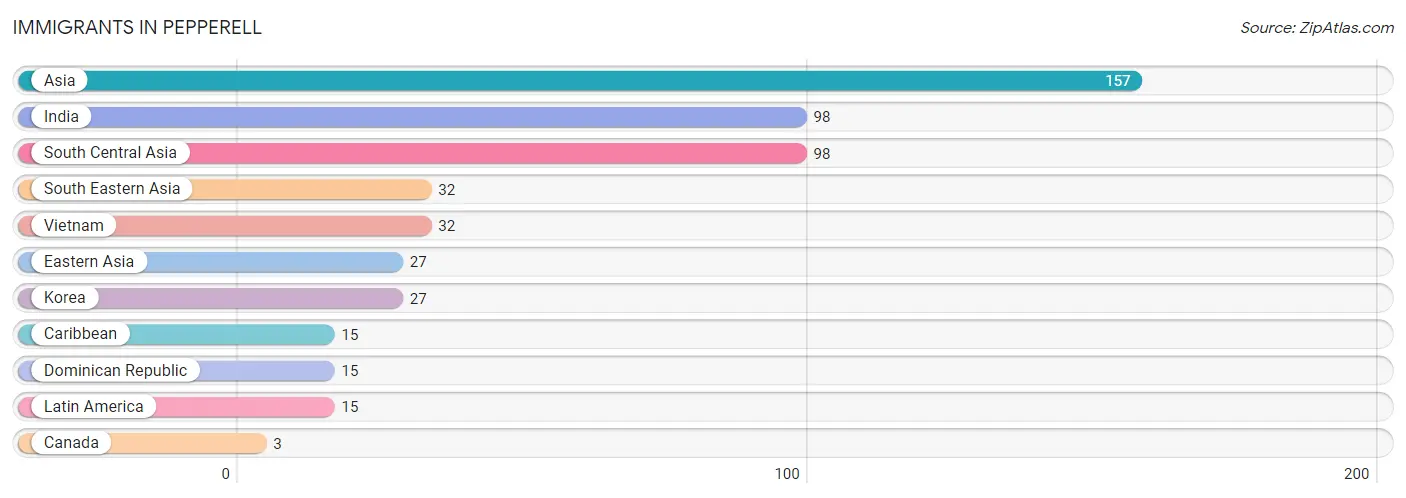
| Immigration Origin | # Population | % Population |
| Asia | 157 | 7.1% |
| Canada | 3 | 0.1% |
| Caribbean | 15 | 0.7% |
| Dominican Republic | 15 | 0.7% |
| Eastern Asia | 27 | 1.2% |
| India | 98 | 4.4% |
| Korea | 27 | 1.2% |
| Latin America | 15 | 0.7% |
| South Central Asia | 98 | 4.4% |
| South Eastern Asia | 32 | 1.5% |
| Vietnam | 32 | 1.5% | View All 11 Rows |
Sex and Age in Pepperell
Sex and Age in Pepperell
The most populous age groups in Pepperell are 40 to 44 Years (127 | 13.0%) for men and 60 to 64 Years (220 | 18.0%) for women.
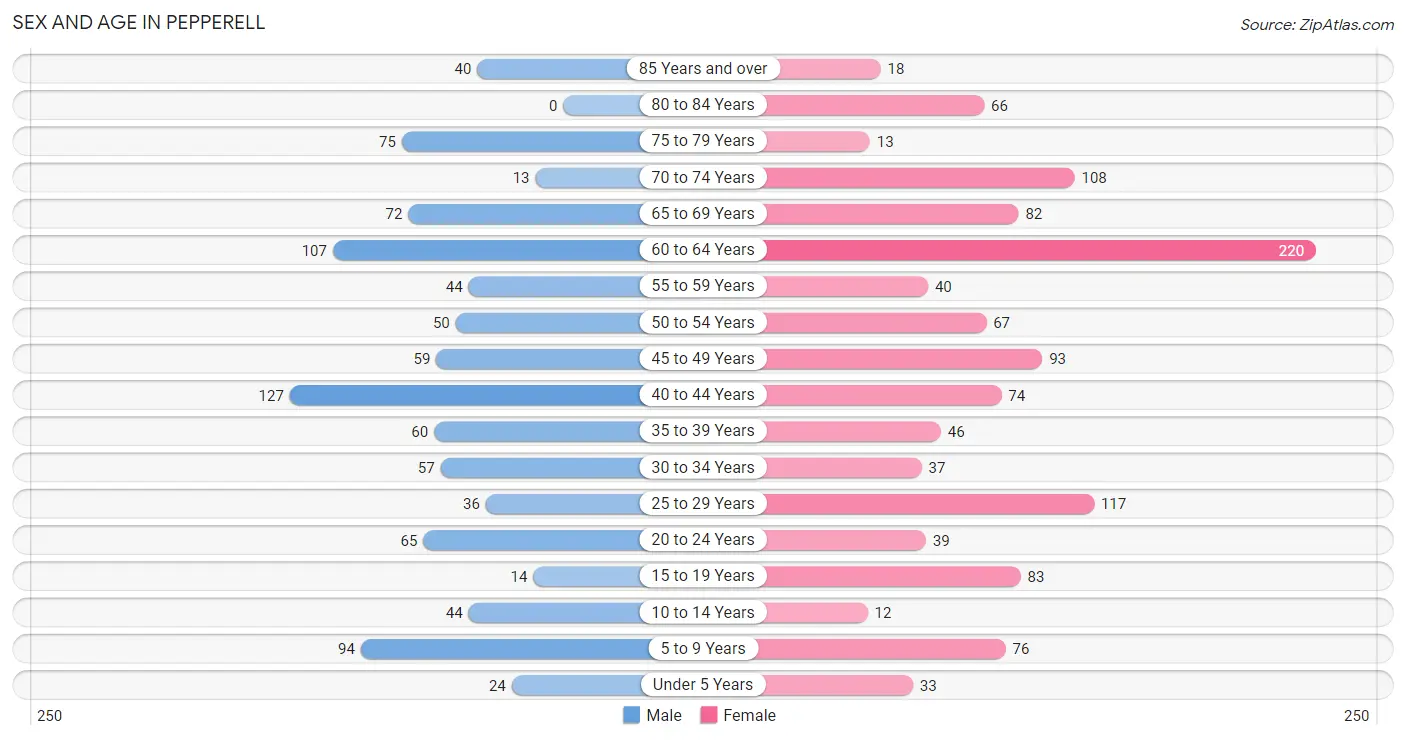
| Age Bracket | Male | Female |
| Under 5 Years | 24 (2.5%) | 33 (2.7%) |
| 5 to 9 Years | 94 (9.6%) | 76 (6.2%) |
| 10 to 14 Years | 44 (4.5%) | 12 (1.0%) |
| 15 to 19 Years | 14 (1.4%) | 83 (6.8%) |
| 20 to 24 Years | 65 (6.6%) | 39 (3.2%) |
| 25 to 29 Years | 36 (3.7%) | 117 (9.6%) |
| 30 to 34 Years | 57 (5.8%) | 37 (3.0%) |
| 35 to 39 Years | 60 (6.1%) | 46 (3.8%) |
| 40 to 44 Years | 127 (13.0%) | 74 (6.0%) |
| 45 to 49 Years | 59 (6.0%) | 93 (7.6%) |
| 50 to 54 Years | 50 (5.1%) | 67 (5.5%) |
| 55 to 59 Years | 44 (4.5%) | 40 (3.3%) |
| 60 to 64 Years | 107 (10.9%) | 220 (18.0%) |
| 65 to 69 Years | 72 (7.3%) | 82 (6.7%) |
| 70 to 74 Years | 13 (1.3%) | 108 (8.8%) |
| 75 to 79 Years | 75 (7.6%) | 13 (1.1%) |
| 80 to 84 Years | 0 (0.0%) | 66 (5.4%) |
| 85 Years and over | 40 (4.1%) | 18 (1.5%) |
| Total | 981 (100.0%) | 1,224 (100.0%) |
Families and Households in Pepperell
Median Family Size in Pepperell
The median family size in Pepperell is 2.78 persons per family, with married-couple families (444 | 78.7%) accounting for the largest median family size of 2.87 persons per family. On the other hand, single male/father families (30 | 5.3%) represent the smallest median family size with 2.40 persons per family.
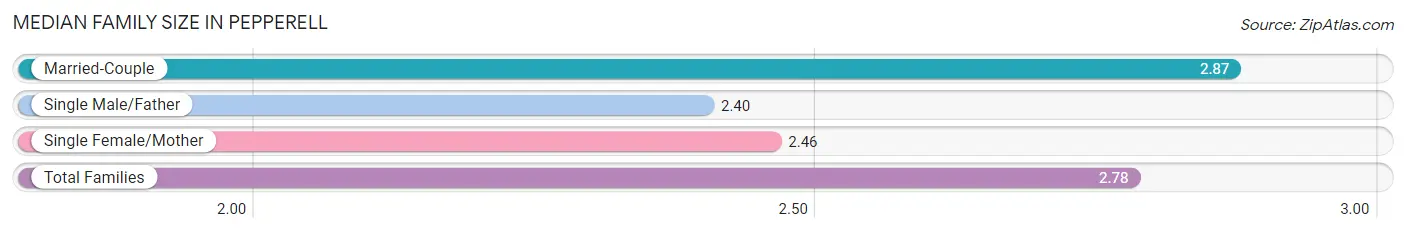
| Family Type | # Families | Family Size |
| Married-Couple | 444 (78.7%) | 2.87 |
| Single Male/Father | 30 (5.3%) | 2.40 |
| Single Female/Mother | 90 (16.0%) | 2.46 |
| Total Families | 564 (100.0%) | 2.78 |
Median Household Size in Pepperell
The median household size in Pepperell is 2.05 persons per household, with married-couple households (444 | 42.4%) accounting for the largest median household size of 2.91 persons per household. non-family households (483 | 46.1%) represent the smallest median household size with 1.14 persons per household.
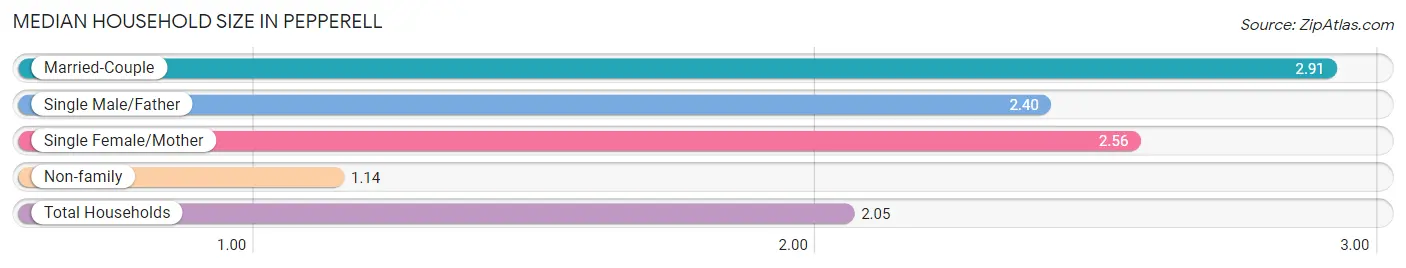
| Household Type | # Households | Household Size |
| Married-Couple | 444 (42.4%) | 2.91 |
| Single Male/Father | 30 (2.9%) | 2.40 |
| Single Female/Mother | 90 (8.6%) | 2.56 |
| Non-family | 483 (46.1%) | 1.14 |
| Total Households | 1,047 (100.0%) | 2.05 |
Household Size by Marriage Status in Pepperell
Out of a total of 1,047 households in Pepperell, 564 (53.9%) are family households, while 483 (46.1%) are nonfamily households. The most numerous type of family households are 2-person households, comprising 249, and the most common type of nonfamily households are 1-person households, comprising 449.
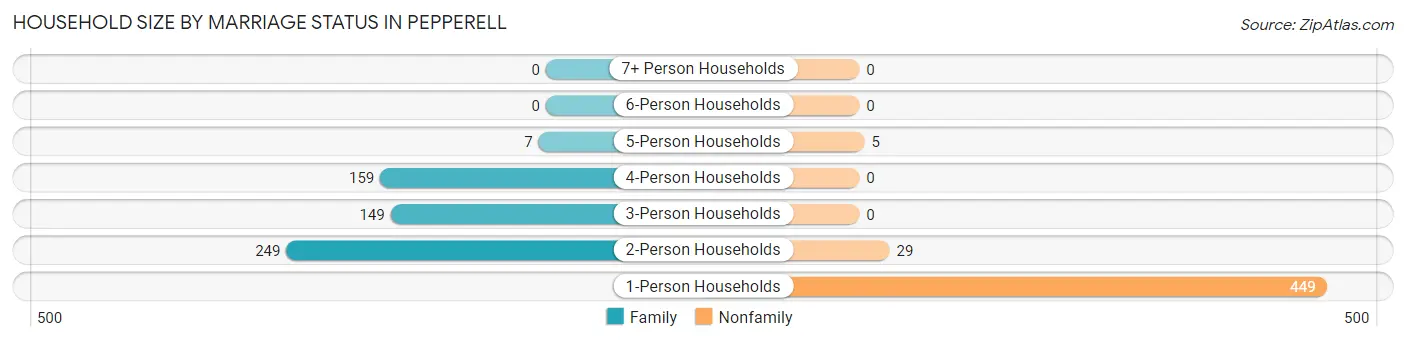
| Household Size | Family Households | Nonfamily Households |
| 1-Person Households | - | 449 (42.9%) |
| 2-Person Households | 249 (23.8%) | 29 (2.8%) |
| 3-Person Households | 149 (14.2%) | 0 (0.0%) |
| 4-Person Households | 159 (15.2%) | 0 (0.0%) |
| 5-Person Households | 7 (0.7%) | 5 (0.5%) |
| 6-Person Households | 0 (0.0%) | 0 (0.0%) |
| 7+ Person Households | 0 (0.0%) | 0 (0.0%) |
| Total | 564 (53.9%) | 483 (46.1%) |
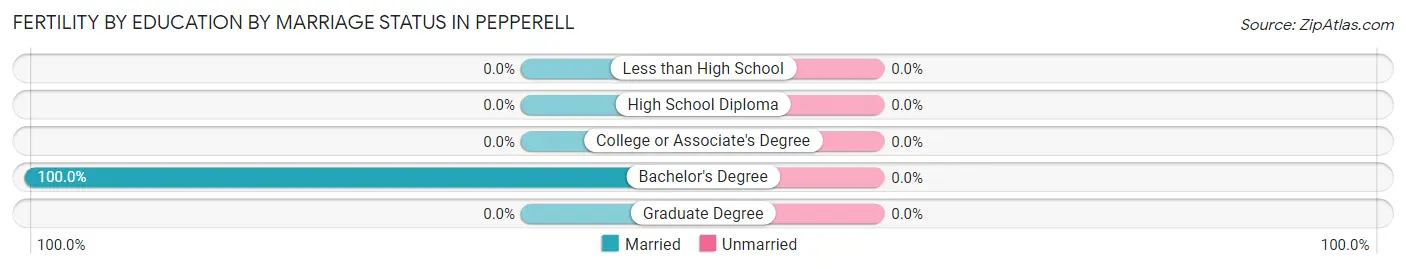
Female Fertility in Pepperell
Fertility by Age in Pepperell
Average fertility rate in Pepperell is 25.0 births per 1,000 women. Women in the age bracket of 20 to 34 years have the highest fertility rate with 62.0 births per 1,000 women. Women in the age bracket of 20 to 34 years acount for 100.0% of all women with births.
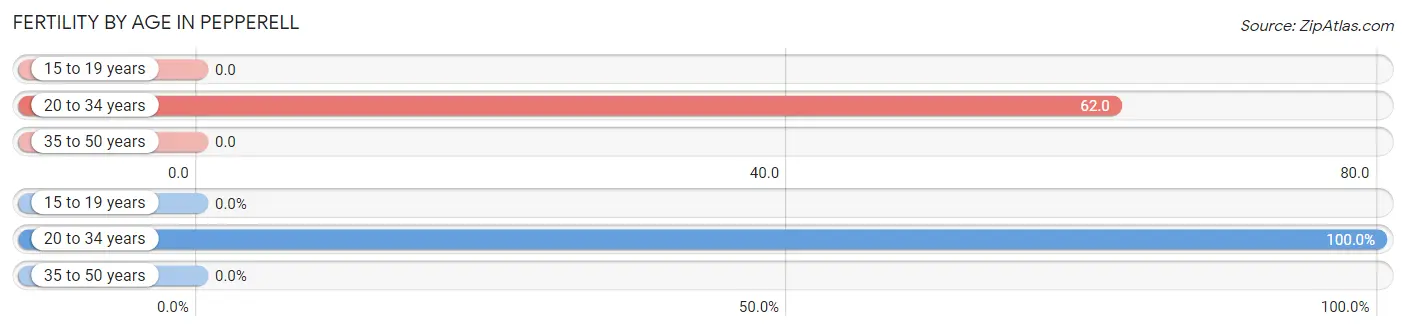
| Age Bracket | Women with Births | Births / 1,000 Women |
| 15 to 19 years | 0 (0.0%) | 0.0 |
| 20 to 34 years | 12 (100.0%) | 62.0 |
| 35 to 50 years | 0 (0.0%) | 0.0 |
| Total | 12 (100.0%) | 25.0 |
Fertility by Age by Marriage Status in Pepperell
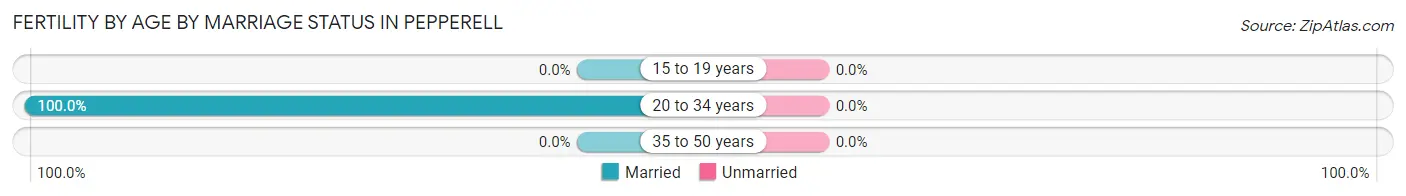
| Age Bracket | Married | Unmarried |
| 15 to 19 years | 0 (0.0%) | 0 (0.0%) |
| 20 to 34 years | 12 (100.0%) | 0 (0.0%) |
| 35 to 50 years | 0 (0.0%) | 0 (0.0%) |
| Total | 12 (100.0%) | 0 (0.0%) |
Fertility by Education in Pepperell
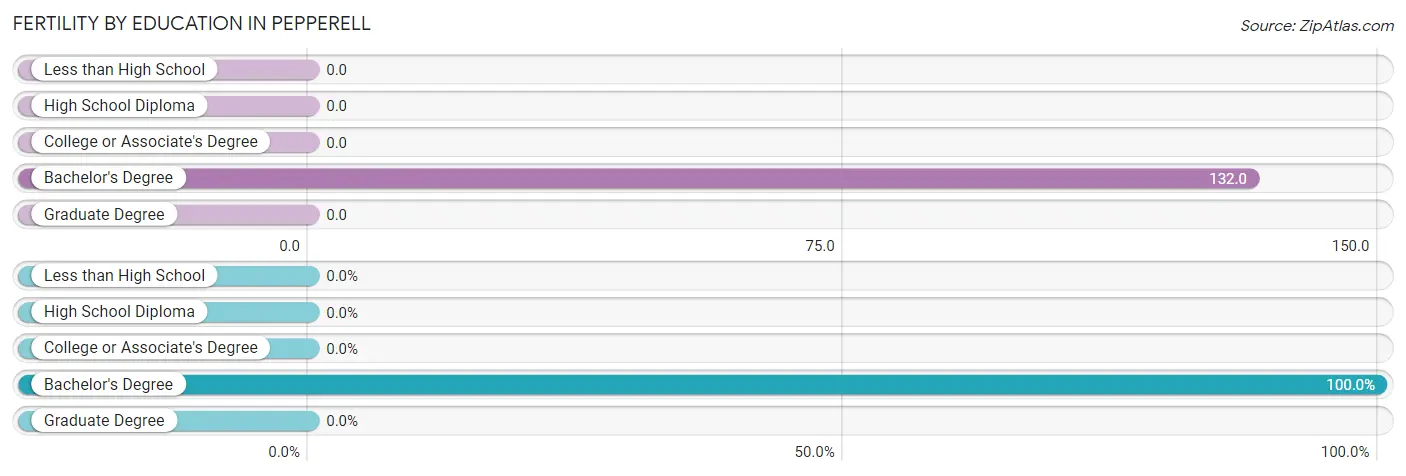
| Educational Attainment | Women with Births | Births / 1,000 Women |
| Less than High School | 0 (0.0%) | 0.0 |
| High School Diploma | 0 (0.0%) | 0.0 |
| College or Associate's Degree | 0 (0.0%) | 0.0 |
| Bachelor's Degree | 12 (100.0%) | 132.0 |
| Graduate Degree | 0 (0.0%) | 0.0 |
| Total | 12 (100.0%) | 25.0 |
Fertility by Education by Marriage Status in Pepperell
| Educational Attainment | Married | Unmarried |
| Less than High School | 0 (0.0%) | 0 (0.0%) |
| High School Diploma | 0 (0.0%) | 0 (0.0%) |
| College or Associate's Degree | 0 (0.0%) | 0 (0.0%) |
| Bachelor's Degree | 12 (100.0%) | 0 (0.0%) |
| Graduate Degree | 0 (0.0%) | 0 (0.0%) |
| Total | 12 (100.0%) | 0 (0.0%) |
Employment Characteristics in Pepperell
Employment by Class of Employer in Pepperell
Among the 1,071 employed individuals in Pepperell, private company employees (852 | 79.5%), local government employees (79 | 7.4%), and self-employed (not incorporated) (66 | 6.2%) make up the most common classes of employment.
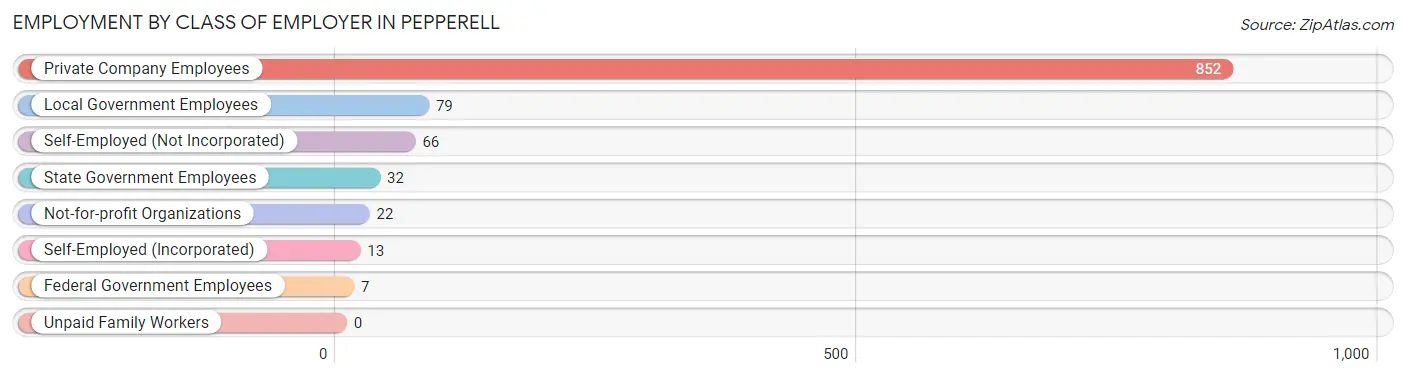
| Employer Class | # Employees | % Employees |
| Private Company Employees | 852 | 79.5% |
| Self-Employed (Incorporated) | 13 | 1.2% |
| Self-Employed (Not Incorporated) | 66 | 6.2% |
| Not-for-profit Organizations | 22 | 2.1% |
| Local Government Employees | 79 | 7.4% |
| State Government Employees | 32 | 3.0% |
| Federal Government Employees | 7 | 0.6% |
| Unpaid Family Workers | 0 | 0.0% |
| Total | 1,071 | 100.0% |
Employment Status by Age in Pepperell
According to the labor force statistics for Pepperell, out of the total population over 16 years of age (1,915), 61.8% or 1,183 individuals are in the labor force, with 6.6% or 78 of them unemployed. The age group with the highest labor force participation rate is 25 to 29 years, with 100.0% or 153 individuals in the labor force. Within the labor force, the 25 to 29 years age range has the highest percentage of unemployed individuals, with 22.2% or 34 of them being unemployed.
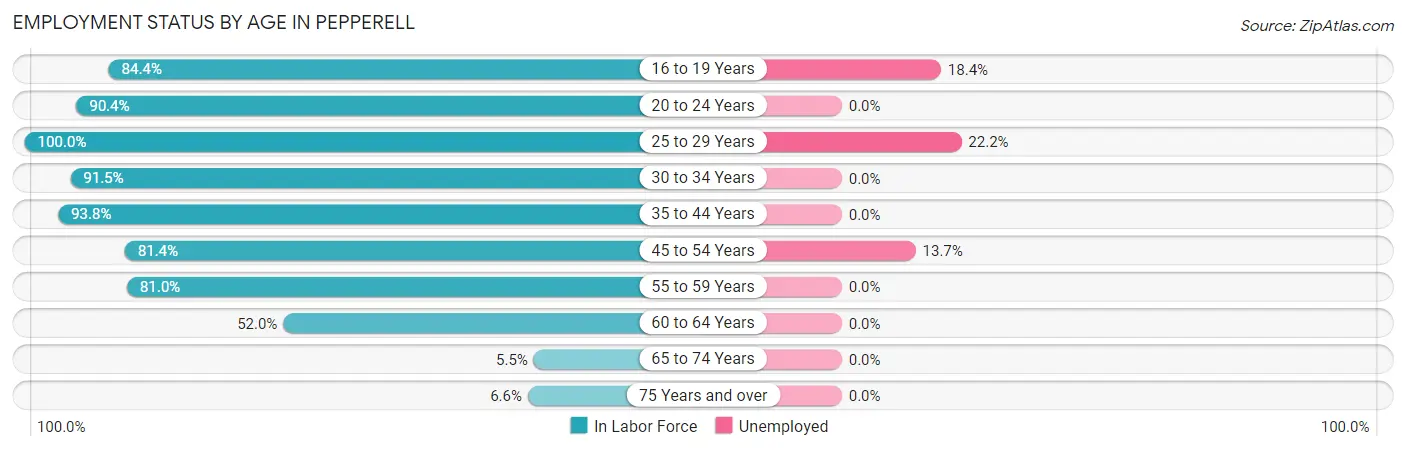
| Age Bracket | In Labor Force | Unemployed |
| 16 to 19 Years | 76 (84.4%) | 14 (18.4%) |
| 20 to 24 Years | 94 (90.4%) | 0 (0.0%) |
| 25 to 29 Years | 153 (100.0%) | 34 (22.2%) |
| 30 to 34 Years | 86 (91.5%) | 0 (0.0%) |
| 35 to 44 Years | 288 (93.8%) | 0 (0.0%) |
| 45 to 54 Years | 219 (81.4%) | 30 (13.7%) |
| 55 to 59 Years | 68 (81.0%) | 0 (0.0%) |
| 60 to 64 Years | 170 (52.0%) | 0 (0.0%) |
| 65 to 74 Years | 15 (5.5%) | 0 (0.0%) |
| 75 Years and over | 14 (6.6%) | 0 (0.0%) |
| Total | 1,183 (61.8%) | 78 (6.6%) |
Employment Status by Educational Attainment in Pepperell
According to labor force statistics for Pepperell, 79.7% of individuals (983) out of the total population between 25 and 64 years of age (1,234) are in the labor force, with 6.5% or 64 of them being unemployed. The group with the highest labor force participation rate are those with the educational attainment of bachelor's degree or higher, with 92.9% or 460 individuals in the labor force. Within the labor force, individuals with high school diploma education have the highest percentage of unemployment, with 10.0% or 23 of them being unemployed.
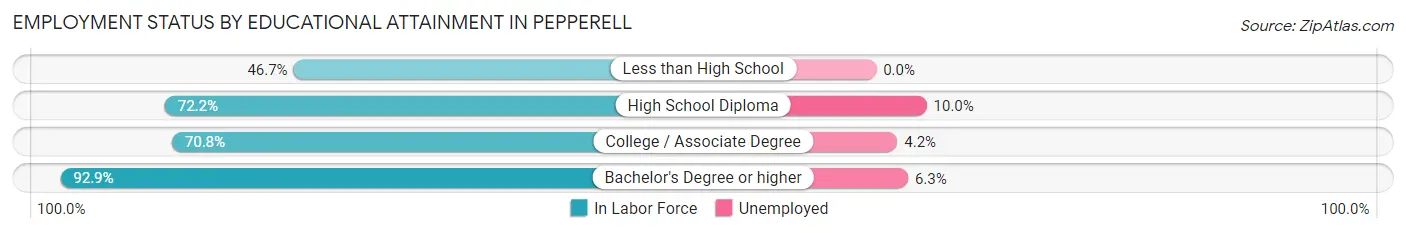
| Educational Attainment | In Labor Force | Unemployed |
| Less than High School | 7 (46.7%) | 0 (0.0%) |
| High School Diploma | 231 (72.2%) | 32 (10.0%) |
| College / Associate Degree | 286 (70.8%) | 17 (4.2%) |
| Bachelor's Degree or higher | 460 (92.9%) | 31 (6.3%) |
| Total | 983 (79.7%) | 80 (6.5%) |
Employment Occupations by Sex in Pepperell
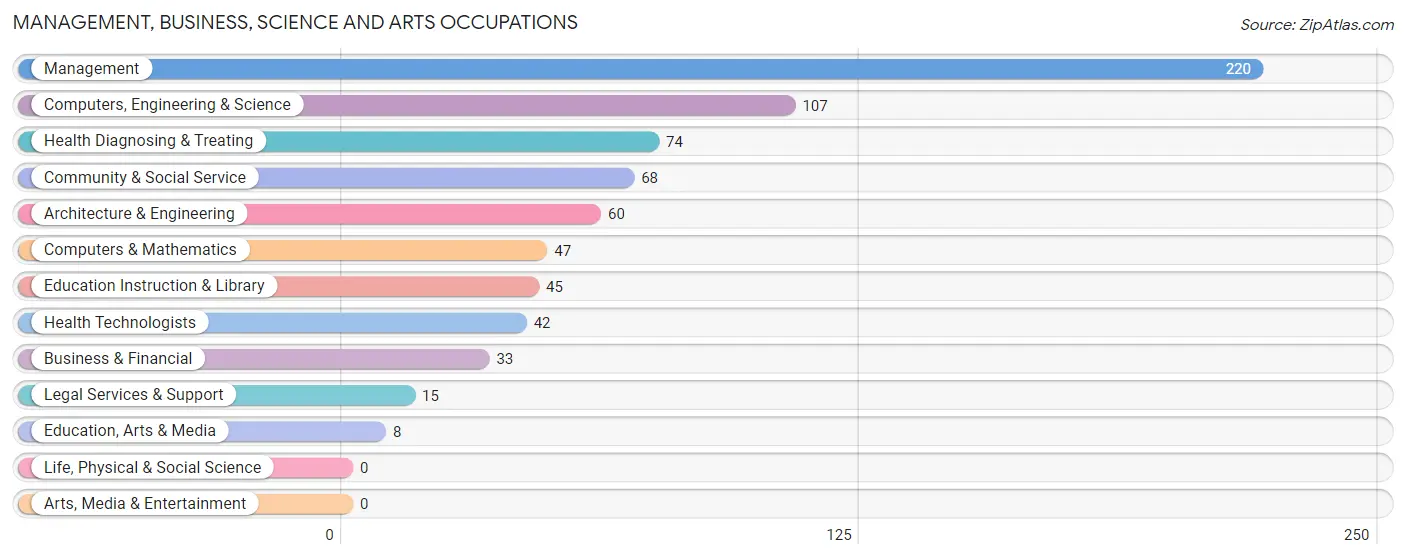
Management, Business, Science and Arts Occupations
The most common Management, Business, Science and Arts occupations in Pepperell are Management (220 | 19.9%), Computers, Engineering & Science (107 | 9.7%), Health Diagnosing & Treating (74 | 6.7%), Community & Social Service (68 | 6.1%), and Architecture & Engineering (60 | 5.4%).
Management, Business, Science and Arts Occupations by Sex
Within the Management, Business, Science and Arts occupations in Pepperell, the most male-oriented occupations are Architecture & Engineering (100.0%), Education, Arts & Media (100.0%), and Computers, Engineering & Science (61.7%), while the most female-oriented occupations are Health Technologists (100.0%), Computers & Mathematics (87.2%), and Health Diagnosing & Treating (79.7%).
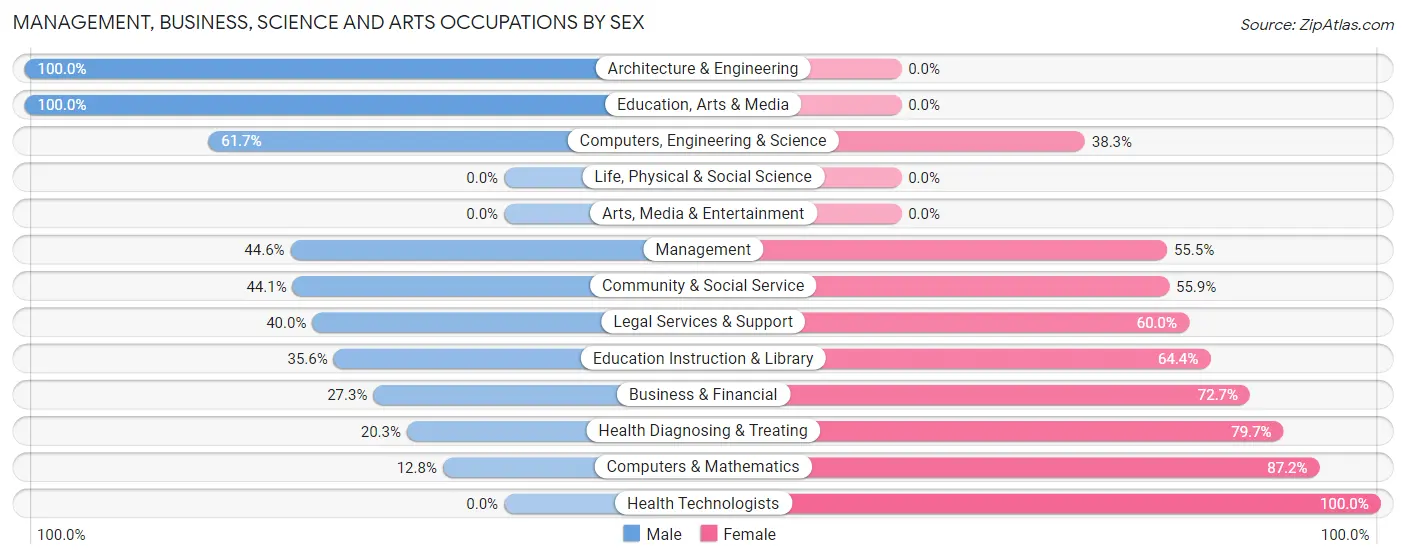
| Occupation | Male | Female |
| Management | 98 (44.6%) | 122 (55.4%) |
| Business & Financial | 9 (27.3%) | 24 (72.7%) |
| Computers, Engineering & Science | 66 (61.7%) | 41 (38.3%) |
| Computers & Mathematics | 6 (12.8%) | 41 (87.2%) |
| Architecture & Engineering | 60 (100.0%) | 0 (0.0%) |
| Life, Physical & Social Science | 0 (0.0%) | 0 (0.0%) |
| Community & Social Service | 30 (44.1%) | 38 (55.9%) |
| Education, Arts & Media | 8 (100.0%) | 0 (0.0%) |
| Legal Services & Support | 6 (40.0%) | 9 (60.0%) |
| Education Instruction & Library | 16 (35.6%) | 29 (64.4%) |
| Arts, Media & Entertainment | 0 (0.0%) | 0 (0.0%) |
| Health Diagnosing & Treating | 15 (20.3%) | 59 (79.7%) |
| Health Technologists | 0 (0.0%) | 42 (100.0%) |
| Total (Category) | 218 (43.4%) | 284 (56.6%) |
| Total (Overall) | 560 (50.7%) | 545 (49.3%) |
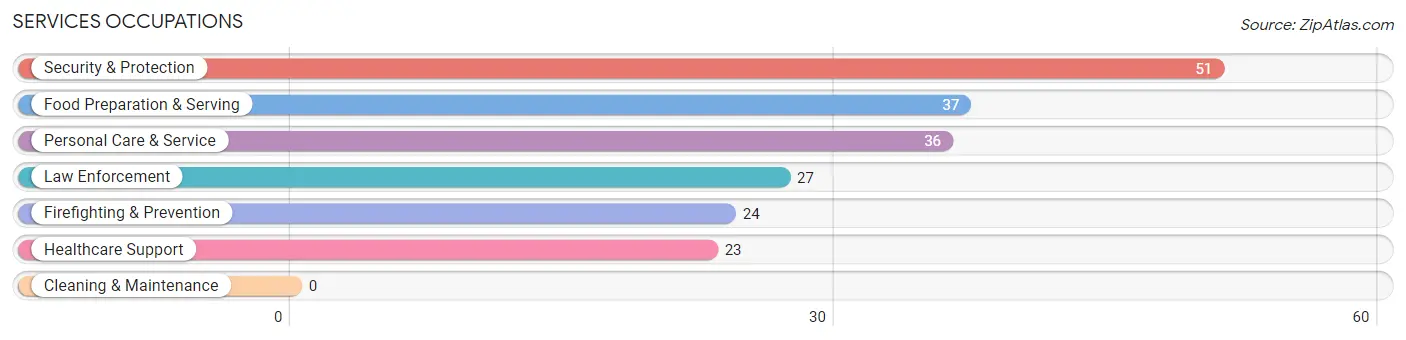
Services Occupations
The most common Services occupations in Pepperell are Security & Protection (51 | 4.6%), Food Preparation & Serving (37 | 3.4%), Personal Care & Service (36 | 3.3%), Law Enforcement (27 | 2.4%), and Firefighting & Prevention (24 | 2.2%).
Services Occupations by Sex
Within the Services occupations in Pepperell, the most male-oriented occupations are Law Enforcement (100.0%), Security & Protection (86.3%), and Firefighting & Prevention (70.8%), while the most female-oriented occupations are Healthcare Support (100.0%), Personal Care & Service (72.2%), and Food Preparation & Serving (64.9%).
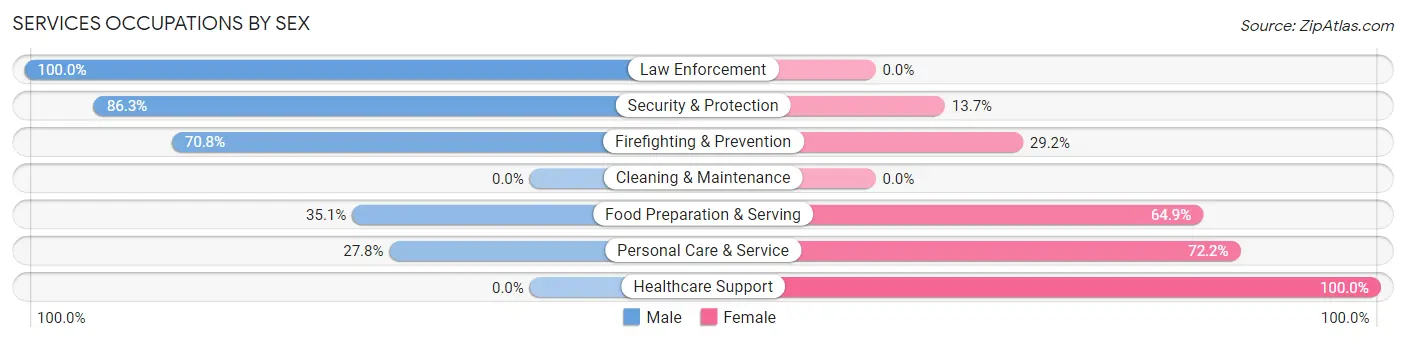
| Occupation | Male | Female |
| Healthcare Support | 0 (0.0%) | 23 (100.0%) |
| Security & Protection | 44 (86.3%) | 7 (13.7%) |
| Firefighting & Prevention | 17 (70.8%) | 7 (29.2%) |
| Law Enforcement | 27 (100.0%) | 0 (0.0%) |
| Food Preparation & Serving | 13 (35.1%) | 24 (64.9%) |
| Cleaning & Maintenance | 0 (0.0%) | 0 (0.0%) |
| Personal Care & Service | 10 (27.8%) | 26 (72.2%) |
| Total (Category) | 67 (45.6%) | 80 (54.4%) |
| Total (Overall) | 560 (50.7%) | 545 (49.3%) |
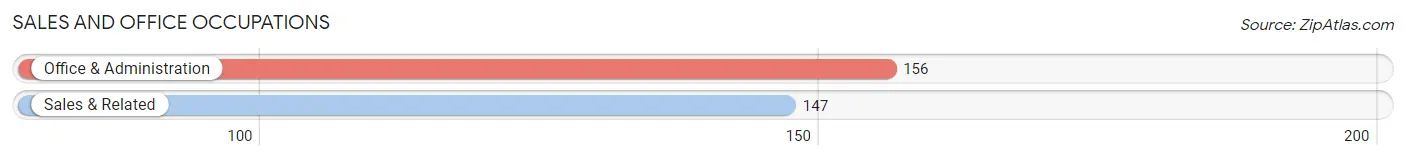
Sales and Office Occupations
The most common Sales and Office occupations in Pepperell are Office & Administration (156 | 14.1%), and Sales & Related (147 | 13.3%).
Sales and Office Occupations by Sex
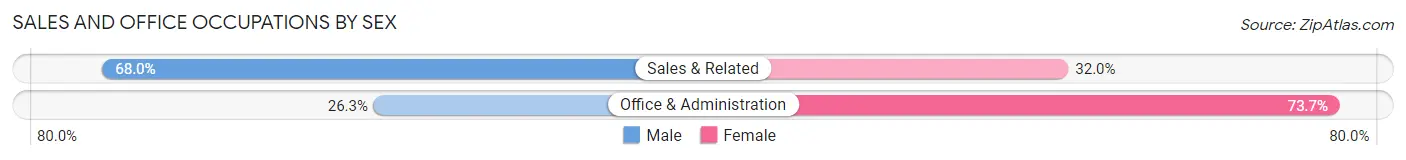
| Occupation | Male | Female |
| Sales & Related | 100 (68.0%) | 47 (32.0%) |
| Office & Administration | 41 (26.3%) | 115 (73.7%) |
| Total (Category) | 141 (46.5%) | 162 (53.5%) |
| Total (Overall) | 560 (50.7%) | 545 (49.3%) |
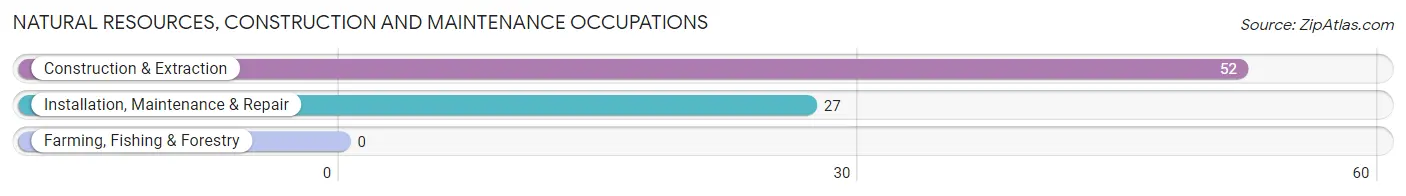
Natural Resources, Construction and Maintenance Occupations
The most common Natural Resources, Construction and Maintenance occupations in Pepperell are Construction & Extraction (52 | 4.7%), and Installation, Maintenance & Repair (27 | 2.4%).
Natural Resources, Construction and Maintenance Occupations by Sex
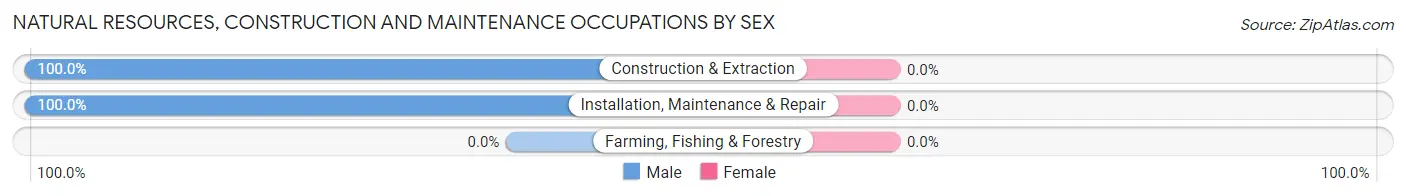
| Occupation | Male | Female |
| Farming, Fishing & Forestry | 0 (0.0%) | 0 (0.0%) |
| Construction & Extraction | 52 (100.0%) | 0 (0.0%) |
| Installation, Maintenance & Repair | 27 (100.0%) | 0 (0.0%) |
| Total (Category) | 79 (100.0%) | 0 (0.0%) |
| Total (Overall) | 560 (50.7%) | 545 (49.3%) |
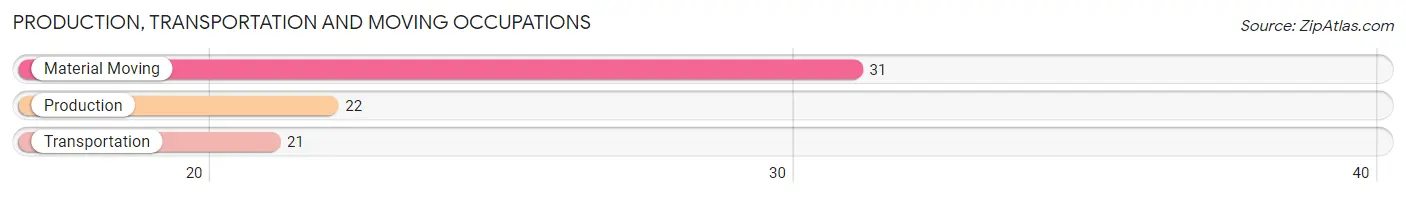
Production, Transportation and Moving Occupations
The most common Production, Transportation and Moving occupations in Pepperell are Material Moving (31 | 2.8%), Production (22 | 2.0%), and Transportation (21 | 1.9%).
Production, Transportation and Moving Occupations by Sex
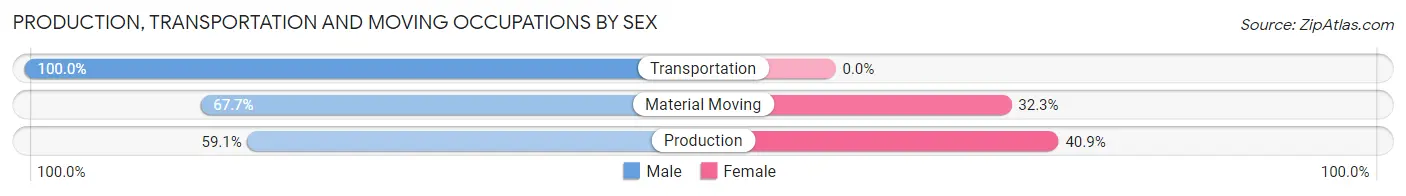
| Occupation | Male | Female |
| Production | 13 (59.1%) | 9 (40.9%) |
| Transportation | 21 (100.0%) | 0 (0.0%) |
| Material Moving | 21 (67.7%) | 10 (32.3%) |
| Total (Category) | 55 (74.3%) | 19 (25.7%) |
| Total (Overall) | 560 (50.7%) | 545 (49.3%) |
Employment Industries by Sex in Pepperell
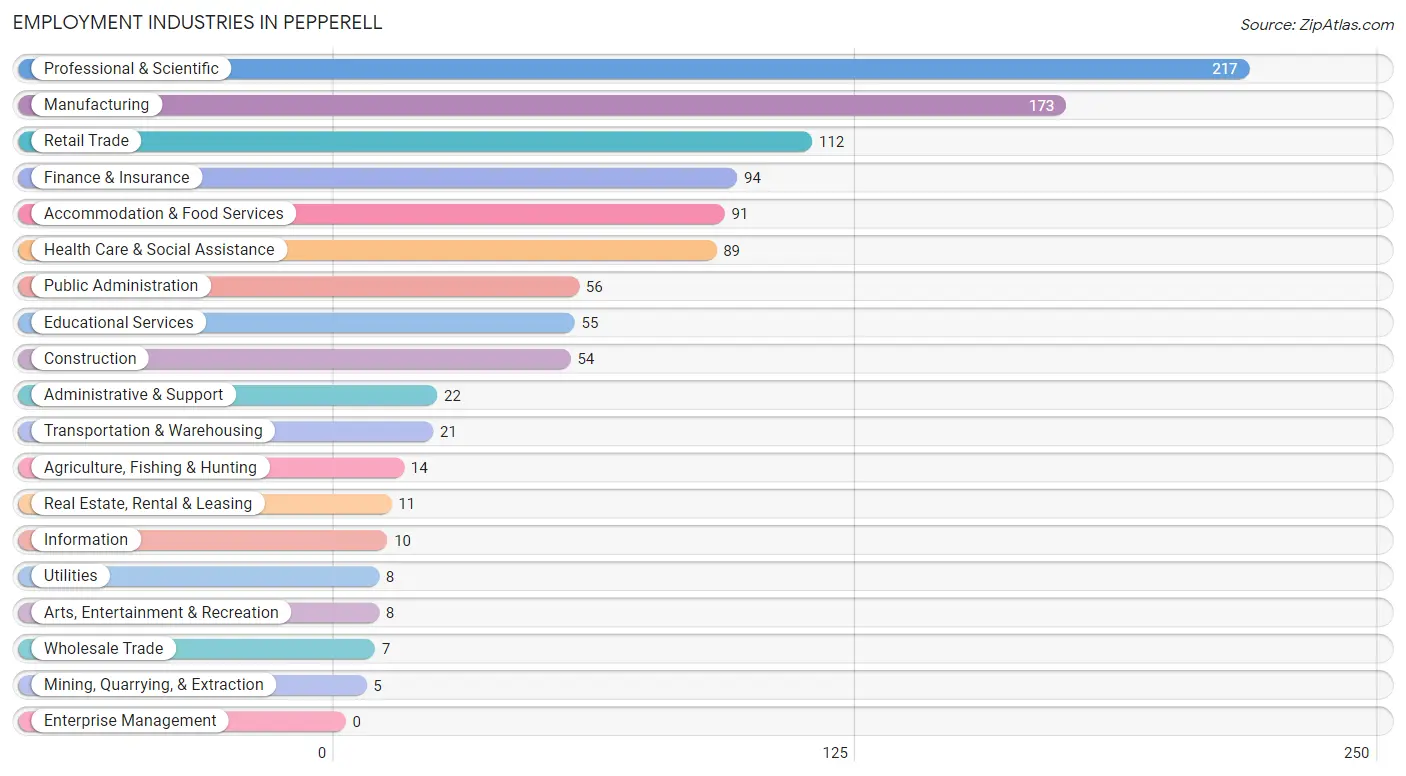
Employment Industries in Pepperell
The major employment industries in Pepperell include Professional & Scientific (217 | 19.6%), Manufacturing (173 | 15.7%), Retail Trade (112 | 10.1%), Finance & Insurance (94 | 8.5%), and Accommodation & Food Services (91 | 8.2%).
Employment Industries by Sex in Pepperell
The Pepperell industries that see more men than women are Mining, Quarrying, & Extraction (100.0%), Construction (100.0%), and Wholesale Trade (100.0%), whereas the industries that tend to have a higher number of women are Agriculture, Fishing & Hunting (100.0%), Information (100.0%), and Arts, Entertainment & Recreation (100.0%).
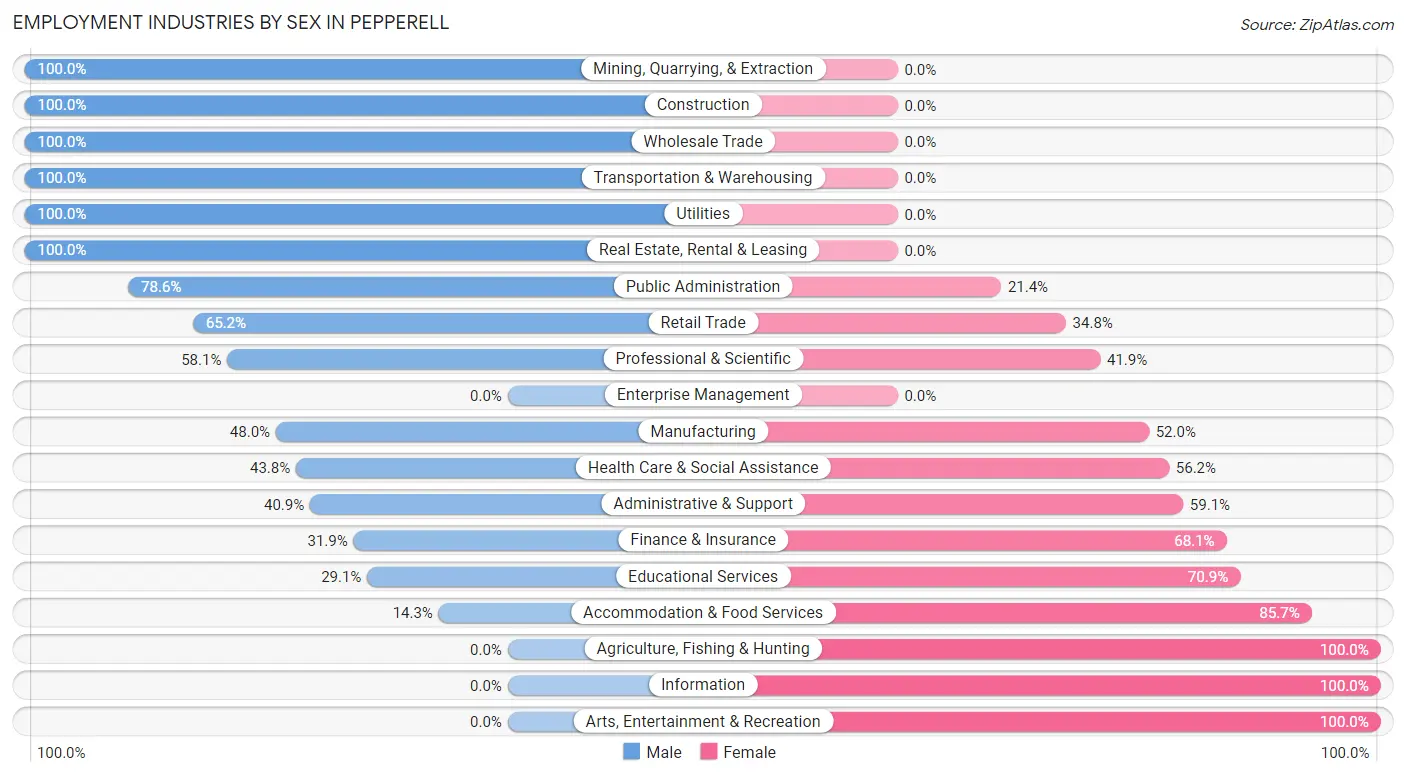
| Industry | Male | Female |
| Agriculture, Fishing & Hunting | 0 (0.0%) | 14 (100.0%) |
| Mining, Quarrying, & Extraction | 5 (100.0%) | 0 (0.0%) |
| Construction | 54 (100.0%) | 0 (0.0%) |
| Manufacturing | 83 (48.0%) | 90 (52.0%) |
| Wholesale Trade | 7 (100.0%) | 0 (0.0%) |
| Retail Trade | 73 (65.2%) | 39 (34.8%) |
| Transportation & Warehousing | 21 (100.0%) | 0 (0.0%) |
| Utilities | 8 (100.0%) | 0 (0.0%) |
| Information | 0 (0.0%) | 10 (100.0%) |
| Finance & Insurance | 30 (31.9%) | 64 (68.1%) |
| Real Estate, Rental & Leasing | 11 (100.0%) | 0 (0.0%) |
| Professional & Scientific | 126 (58.1%) | 91 (41.9%) |
| Enterprise Management | 0 (0.0%) | 0 (0.0%) |
| Administrative & Support | 9 (40.9%) | 13 (59.1%) |
| Educational Services | 16 (29.1%) | 39 (70.9%) |
| Health Care & Social Assistance | 39 (43.8%) | 50 (56.2%) |
| Arts, Entertainment & Recreation | 0 (0.0%) | 8 (100.0%) |
| Accommodation & Food Services | 13 (14.3%) | 78 (85.7%) |
| Public Administration | 44 (78.6%) | 12 (21.4%) |
| Total | 560 (50.7%) | 545 (49.3%) |
Education in Pepperell
School Enrollment in Pepperell
The most common levels of schooling among the 402 students in Pepperell are college / undergraduate (96 | 23.9%), elementary school (86 | 21.4%), and nursery / preschool (66 | 16.4%).
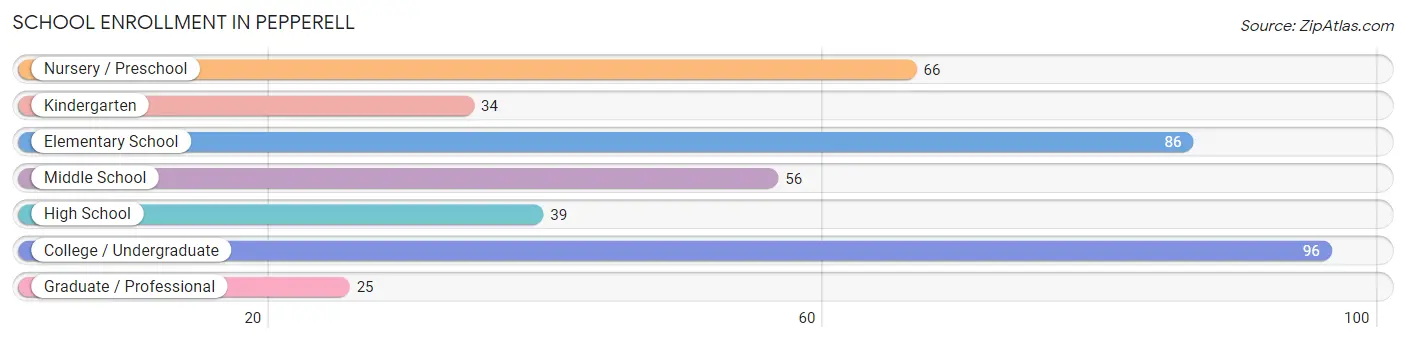
| School Level | # Students | % Students |
| Nursery / Preschool | 66 | 16.4% |
| Kindergarten | 34 | 8.5% |
| Elementary School | 86 | 21.4% |
| Middle School | 56 | 13.9% |
| High School | 39 | 9.7% |
| College / Undergraduate | 96 | 23.9% |
| Graduate / Professional | 25 | 6.2% |
| Total | 402 | 100.0% |
School Enrollment by Age by Funding Source in Pepperell
Out of a total of 402 students who are enrolled in schools in Pepperell, 53 (13.2%) attend a private institution, while the remaining 349 (86.8%) are enrolled in public schools. The age group of 15 to 17 year olds has the highest likelihood of being enrolled in private schools, with 7 (33.3% in the age bracket) enrolled. Conversely, the age group of 3 to 4 year olds has the lowest likelihood of being enrolled in a private school, with 16 (100.0% in the age bracket) attending a public institution.
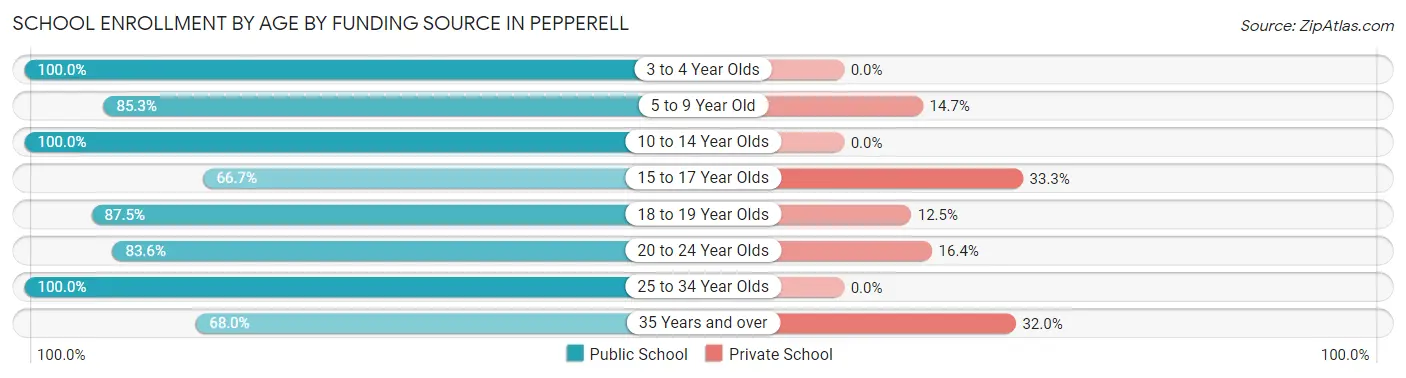
| Age Bracket | Public School | Private School |
| 3 to 4 Year Olds | 16 (100.0%) | 0 (0.0%) |
| 5 to 9 Year Old | 145 (85.3%) | 25 (14.7%) |
| 10 to 14 Year Olds | 56 (100.0%) | 0 (0.0%) |
| 15 to 17 Year Olds | 14 (66.7%) | 7 (33.3%) |
| 18 to 19 Year Olds | 21 (87.5%) | 3 (12.5%) |
| 20 to 24 Year Olds | 51 (83.6%) | 10 (16.4%) |
| 25 to 34 Year Olds | 29 (100.0%) | 0 (0.0%) |
| 35 Years and over | 17 (68.0%) | 8 (32.0%) |
| Total | 349 (86.8%) | 53 (13.2%) |
Educational Attainment by Field of Study in Pepperell
Engineering (134 | 19.4%), business (107 | 15.5%), liberal arts & history (58 | 8.4%), visual & performing arts (52 | 7.5%), and science & technology (51 | 7.4%) are the most common fields of study among 691 individuals in Pepperell who have obtained a bachelor's degree or higher.
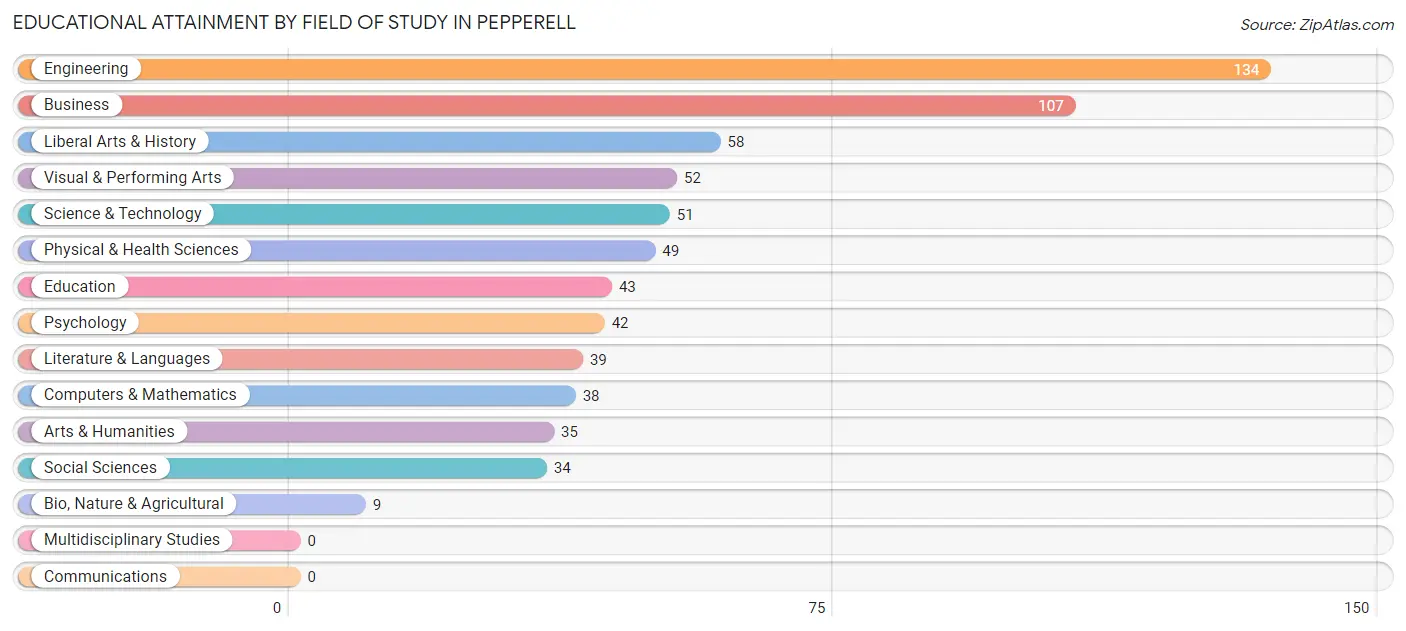
| Field of Study | # Graduates | % Graduates |
| Computers & Mathematics | 38 | 5.5% |
| Bio, Nature & Agricultural | 9 | 1.3% |
| Physical & Health Sciences | 49 | 7.1% |
| Psychology | 42 | 6.1% |
| Social Sciences | 34 | 4.9% |
| Engineering | 134 | 19.4% |
| Multidisciplinary Studies | 0 | 0.0% |
| Science & Technology | 51 | 7.4% |
| Business | 107 | 15.5% |
| Education | 43 | 6.2% |
| Literature & Languages | 39 | 5.6% |
| Liberal Arts & History | 58 | 8.4% |
| Visual & Performing Arts | 52 | 7.5% |
| Communications | 0 | 0.0% |
| Arts & Humanities | 35 | 5.1% |
| Total | 691 | 100.0% |
Transportation & Commute in Pepperell
Vehicle Availability by Sex in Pepperell
The most prevalent vehicle ownership categories in Pepperell are males with 2 vehicles (263, accounting for 47.4%) and females with 2 vehicles (219, making up 51.3%).
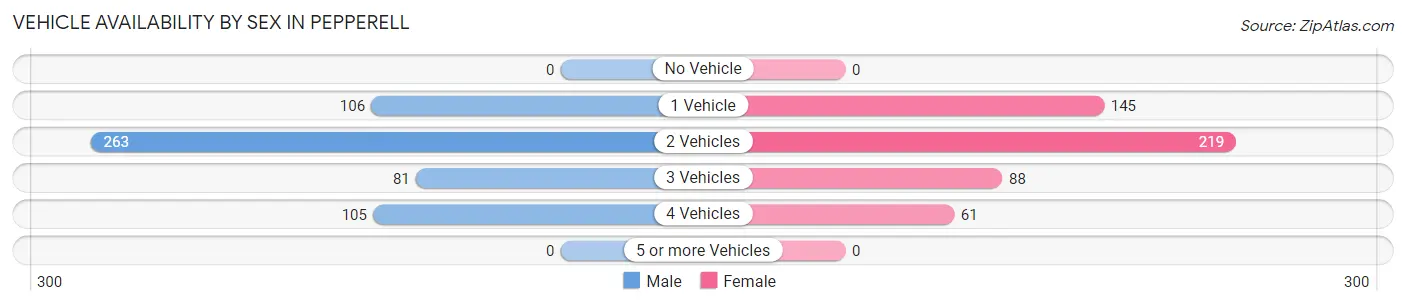
| Vehicles Available | Male | Female |
| No Vehicle | 0 (0.0%) | 0 (0.0%) |
| 1 Vehicle | 106 (19.1%) | 145 (28.3%) |
| 2 Vehicles | 263 (47.4%) | 219 (42.7%) |
| 3 Vehicles | 81 (14.6%) | 88 (17.2%) |
| 4 Vehicles | 105 (18.9%) | 61 (11.9%) |
| 5 or more Vehicles | 0 (0.0%) | 0 (0.0%) |
| Total | 555 (100.0%) | 513 (100.0%) |
Commute Time in Pepperell
The most frequently occuring commute durations in Pepperell are 30 to 34 minutes (174 commuters, 19.3%), 45 to 59 minutes (154 commuters, 17.1%), and 60 to 89 minutes (135 commuters, 14.9%).
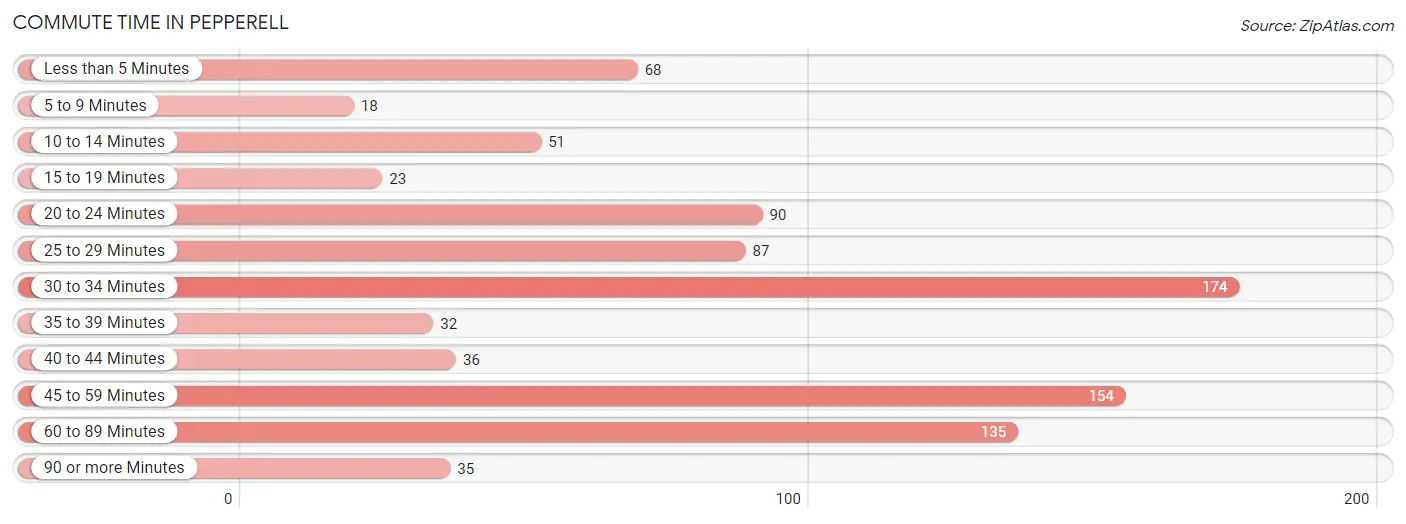
| Commute Time | # Commuters | % Commuters |
| Less than 5 Minutes | 68 | 7.5% |
| 5 to 9 Minutes | 18 | 2.0% |
| 10 to 14 Minutes | 51 | 5.7% |
| 15 to 19 Minutes | 23 | 2.5% |
| 20 to 24 Minutes | 90 | 10.0% |
| 25 to 29 Minutes | 87 | 9.6% |
| 30 to 34 Minutes | 174 | 19.3% |
| 35 to 39 Minutes | 32 | 3.5% |
| 40 to 44 Minutes | 36 | 4.0% |
| 45 to 59 Minutes | 154 | 17.1% |
| 60 to 89 Minutes | 135 | 14.9% |
| 90 or more Minutes | 35 | 3.9% |
Commute Time by Sex in Pepperell
The most common commute times in Pepperell are 45 to 59 minutes (129 commuters, 27.7%) for males and 30 to 34 minutes (105 commuters, 24.0%) for females.
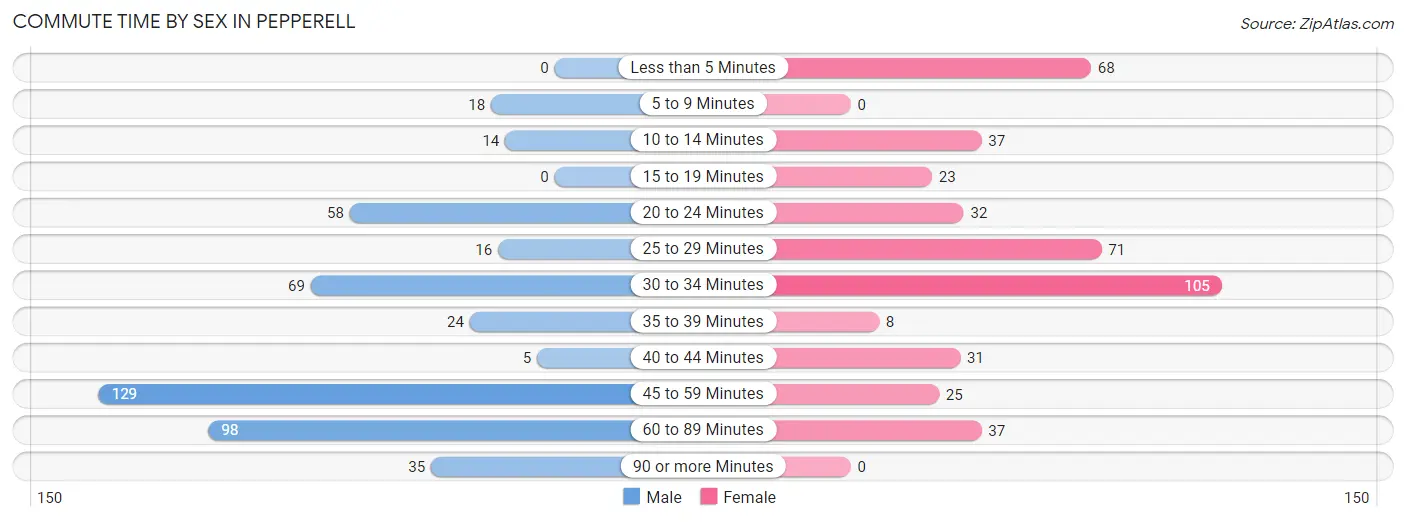
| Commute Time | Male | Female |
| Less than 5 Minutes | 0 (0.0%) | 68 (15.6%) |
| 5 to 9 Minutes | 18 (3.9%) | 0 (0.0%) |
| 10 to 14 Minutes | 14 (3.0%) | 37 (8.5%) |
| 15 to 19 Minutes | 0 (0.0%) | 23 (5.3%) |
| 20 to 24 Minutes | 58 (12.4%) | 32 (7.3%) |
| 25 to 29 Minutes | 16 (3.4%) | 71 (16.3%) |
| 30 to 34 Minutes | 69 (14.8%) | 105 (24.0%) |
| 35 to 39 Minutes | 24 (5.1%) | 8 (1.8%) |
| 40 to 44 Minutes | 5 (1.1%) | 31 (7.1%) |
| 45 to 59 Minutes | 129 (27.7%) | 25 (5.7%) |
| 60 to 89 Minutes | 98 (21.0%) | 37 (8.5%) |
| 90 or more Minutes | 35 (7.5%) | 0 (0.0%) |
Time of Departure to Work by Sex in Pepperell
The most frequent times of departure to work in Pepperell are 6:00 AM to 6:29 AM (91, 19.5%) for males and 7:30 AM to 7:59 AM (93, 21.3%) for females.
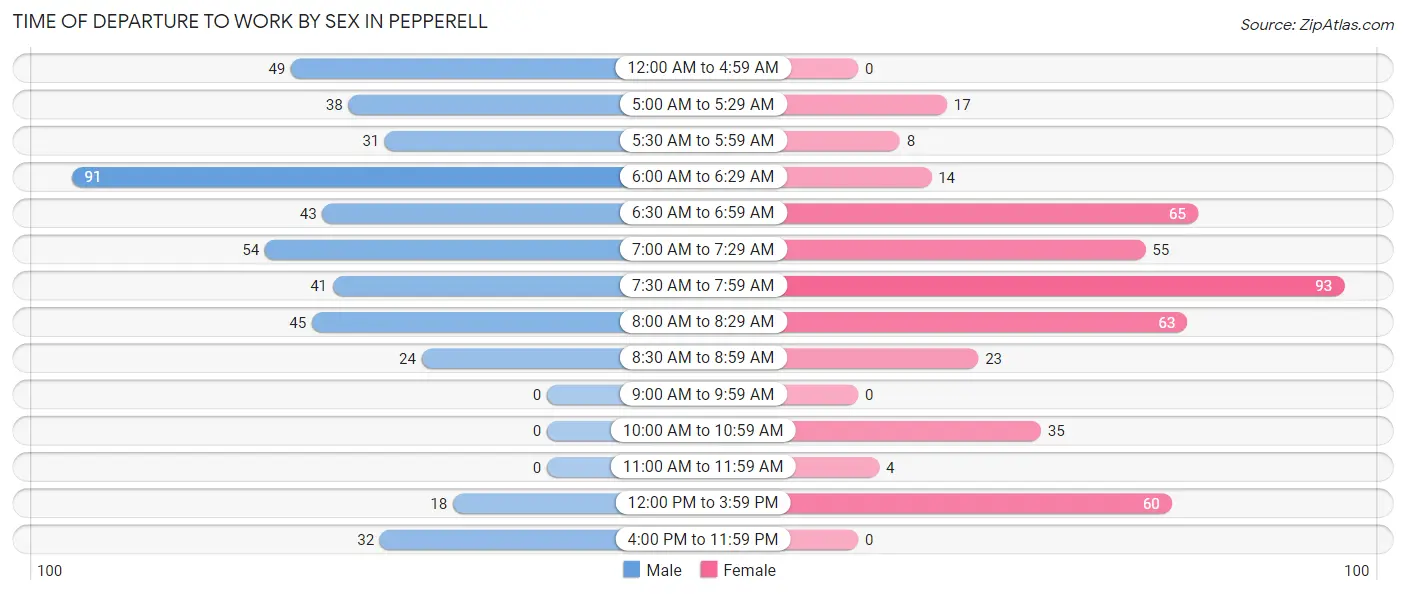
| Time of Departure | Male | Female |
| 12:00 AM to 4:59 AM | 49 (10.5%) | 0 (0.0%) |
| 5:00 AM to 5:29 AM | 38 (8.2%) | 17 (3.9%) |
| 5:30 AM to 5:59 AM | 31 (6.7%) | 8 (1.8%) |
| 6:00 AM to 6:29 AM | 91 (19.5%) | 14 (3.2%) |
| 6:30 AM to 6:59 AM | 43 (9.2%) | 65 (14.9%) |
| 7:00 AM to 7:29 AM | 54 (11.6%) | 55 (12.6%) |
| 7:30 AM to 7:59 AM | 41 (8.8%) | 93 (21.3%) |
| 8:00 AM to 8:29 AM | 45 (9.7%) | 63 (14.4%) |
| 8:30 AM to 8:59 AM | 24 (5.1%) | 23 (5.3%) |
| 9:00 AM to 9:59 AM | 0 (0.0%) | 0 (0.0%) |
| 10:00 AM to 10:59 AM | 0 (0.0%) | 35 (8.0%) |
| 11:00 AM to 11:59 AM | 0 (0.0%) | 4 (0.9%) |
| 12:00 PM to 3:59 PM | 18 (3.9%) | 60 (13.7%) |
| 4:00 PM to 11:59 PM | 32 (6.9%) | 0 (0.0%) |
| Total | 466 (100.0%) | 437 (100.0%) |
Housing Occupancy in Pepperell
Occupancy by Ownership in Pepperell
Of the total 1,047 dwellings in Pepperell, owner-occupied units account for 579 (55.3%), while renter-occupied units make up 468 (44.7%).
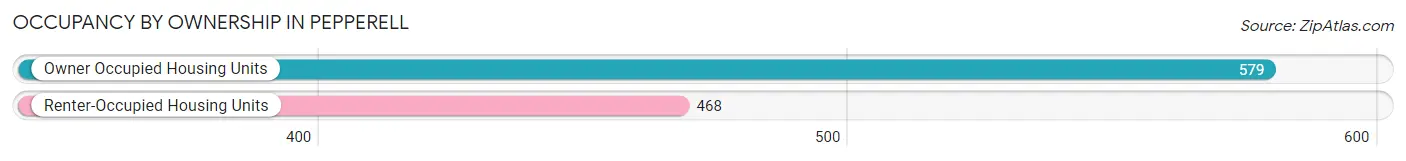
| Occupancy | # Housing Units | % Housing Units |
| Owner Occupied Housing Units | 579 | 55.3% |
| Renter-Occupied Housing Units | 468 | 44.7% |
| Total Occupied Housing Units | 1,047 | 100.0% |
Occupancy by Household Size in Pepperell
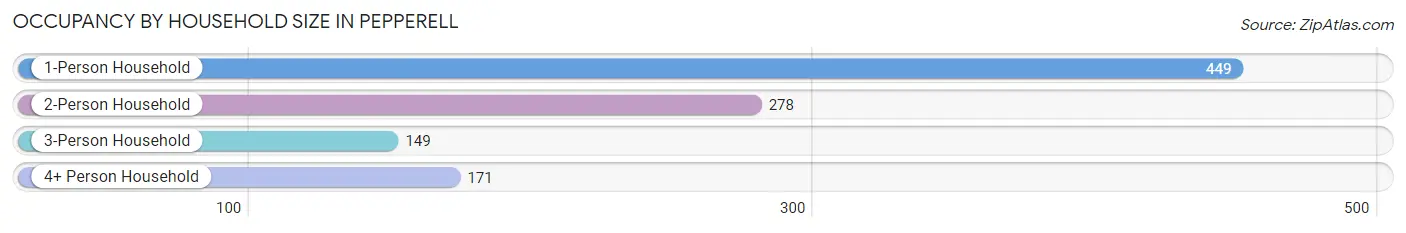
| Household Size | # Housing Units | % Housing Units |
| 1-Person Household | 449 | 42.9% |
| 2-Person Household | 278 | 26.6% |
| 3-Person Household | 149 | 14.2% |
| 4+ Person Household | 171 | 16.3% |
| Total Housing Units | 1,047 | 100.0% |
Occupancy by Ownership by Household Size in Pepperell
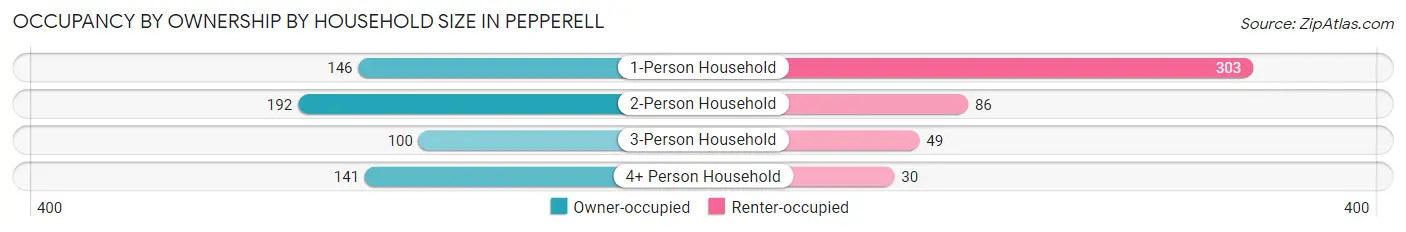
| Household Size | Owner-occupied | Renter-occupied |
| 1-Person Household | 146 (32.5%) | 303 (67.5%) |
| 2-Person Household | 192 (69.1%) | 86 (30.9%) |
| 3-Person Household | 100 (67.1%) | 49 (32.9%) |
| 4+ Person Household | 141 (82.5%) | 30 (17.5%) |
| Total Housing Units | 579 (55.3%) | 468 (44.7%) |
Occupancy by Educational Attainment in Pepperell
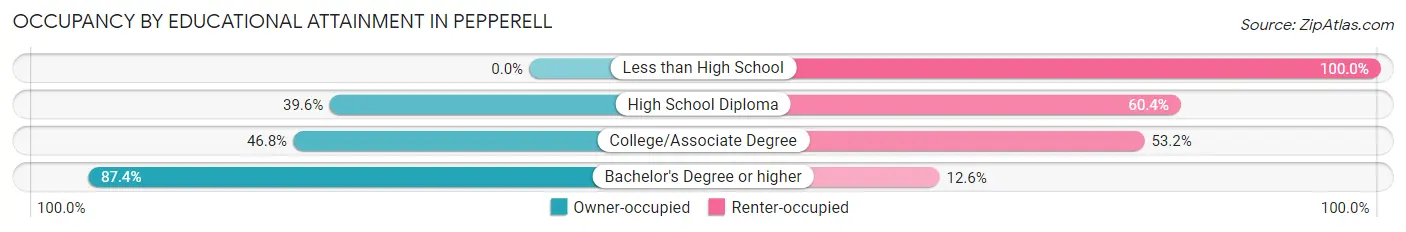
| Household Size | Owner-occupied | Renter-occupied |
| Less than High School | 0 (0.0%) | 62 (100.0%) |
| High School Diploma | 134 (39.6%) | 204 (60.4%) |
| College/Associate Degree | 139 (46.8%) | 158 (53.2%) |
| Bachelor's Degree or higher | 306 (87.4%) | 44 (12.6%) |
Occupancy by Age of Householder in Pepperell
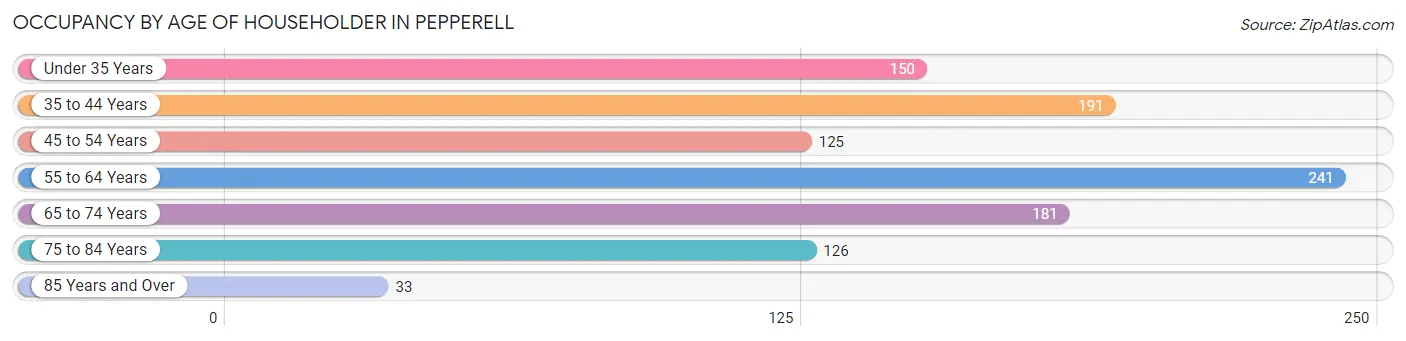
| Age Bracket | # Households | % Households |
| Under 35 Years | 150 | 14.3% |
| 35 to 44 Years | 191 | 18.2% |
| 45 to 54 Years | 125 | 11.9% |
| 55 to 64 Years | 241 | 23.0% |
| 65 to 74 Years | 181 | 17.3% |
| 75 to 84 Years | 126 | 12.0% |
| 85 Years and Over | 33 | 3.2% |
| Total | 1,047 | 100.0% |
Housing Finances in Pepperell
Median Income by Occupancy in Pepperell
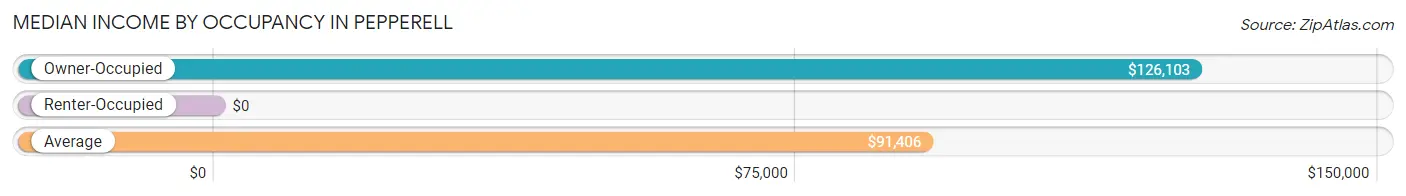
| Occupancy Type | # Households | Median Income |
| Owner-Occupied | 579 (55.3%) | $126,103 |
| Renter-Occupied | 468 (44.7%) | $0 |
| Average | 1,047 (100.0%) | $91,406 |
Occupancy by Householder Income Bracket in Pepperell
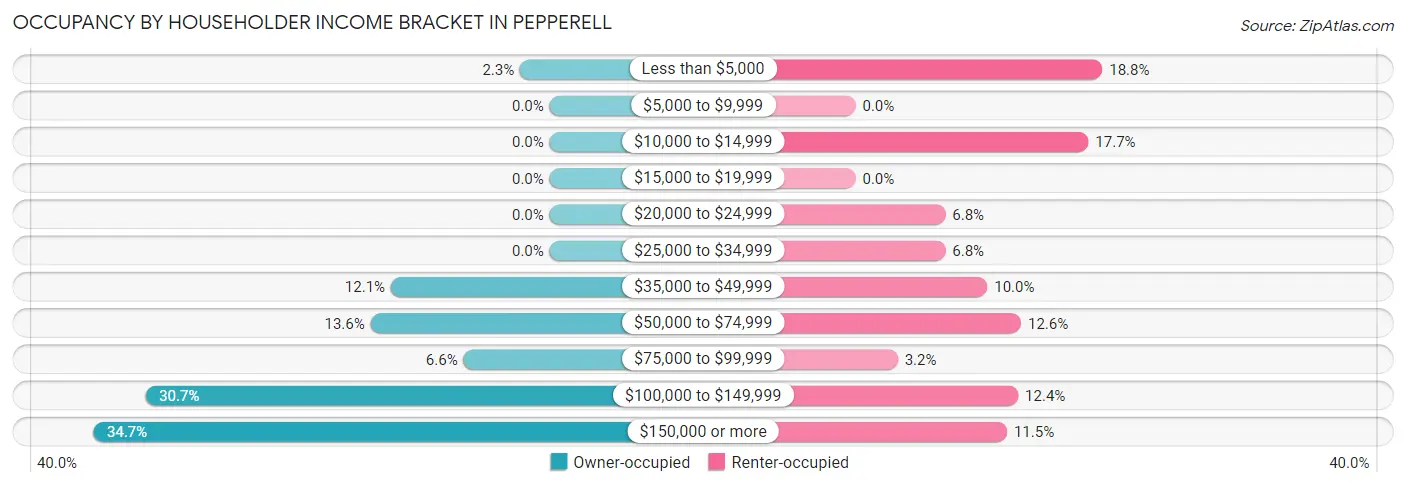
| Income Bracket | Owner-occupied | Renter-occupied |
| Less than $5,000 | 13 (2.2%) | 88 (18.8%) |
| $5,000 to $9,999 | 0 (0.0%) | 0 (0.0%) |
| $10,000 to $14,999 | 0 (0.0%) | 83 (17.7%) |
| $15,000 to $19,999 | 0 (0.0%) | 0 (0.0%) |
| $20,000 to $24,999 | 0 (0.0%) | 32 (6.8%) |
| $25,000 to $34,999 | 0 (0.0%) | 32 (6.8%) |
| $35,000 to $49,999 | 70 (12.1%) | 47 (10.0%) |
| $50,000 to $74,999 | 79 (13.6%) | 59 (12.6%) |
| $75,000 to $99,999 | 38 (6.6%) | 15 (3.2%) |
| $100,000 to $149,999 | 178 (30.7%) | 58 (12.4%) |
| $150,000 or more | 201 (34.7%) | 54 (11.5%) |
| Total | 579 (100.0%) | 468 (100.0%) |
Monthly Housing Cost Tiers in Pepperell
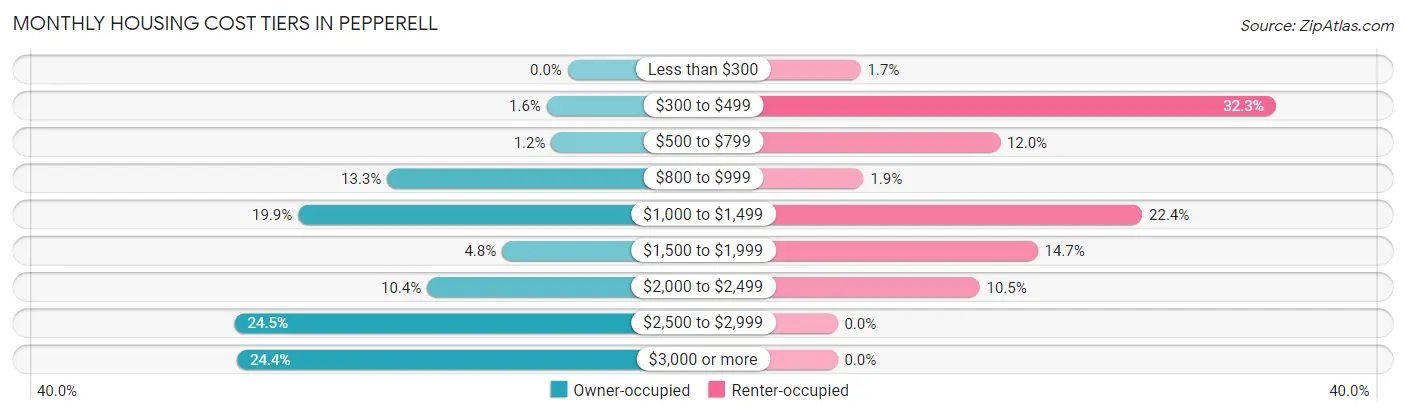
| Monthly Cost | Owner-occupied | Renter-occupied |
| Less than $300 | 0 (0.0%) | 8 (1.7%) |
| $300 to $499 | 9 (1.5%) | 151 (32.3%) |
| $500 to $799 | 7 (1.2%) | 56 (12.0%) |
| $800 to $999 | 77 (13.3%) | 9 (1.9%) |
| $1,000 to $1,499 | 115 (19.9%) | 105 (22.4%) |
| $1,500 to $1,999 | 28 (4.8%) | 69 (14.7%) |
| $2,000 to $2,499 | 60 (10.4%) | 49 (10.5%) |
| $2,500 to $2,999 | 142 (24.5%) | 0 (0.0%) |
| $3,000 or more | 141 (24.3%) | 0 (0.0%) |
| Total | 579 (100.0%) | 468 (100.0%) |
Physical Housing Characteristics in Pepperell
Housing Structures in Pepperell
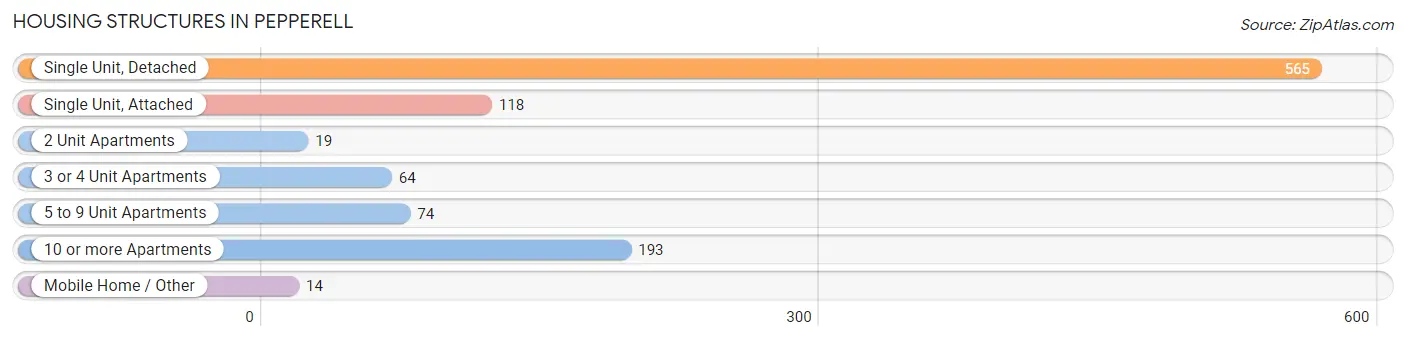
| Structure Type | # Housing Units | % Housing Units |
| Single Unit, Detached | 565 | 54.0% |
| Single Unit, Attached | 118 | 11.3% |
| 2 Unit Apartments | 19 | 1.8% |
| 3 or 4 Unit Apartments | 64 | 6.1% |
| 5 to 9 Unit Apartments | 74 | 7.1% |
| 10 or more Apartments | 193 | 18.4% |
| Mobile Home / Other | 14 | 1.3% |
| Total | 1,047 | 100.0% |
Housing Structures by Occupancy in Pepperell
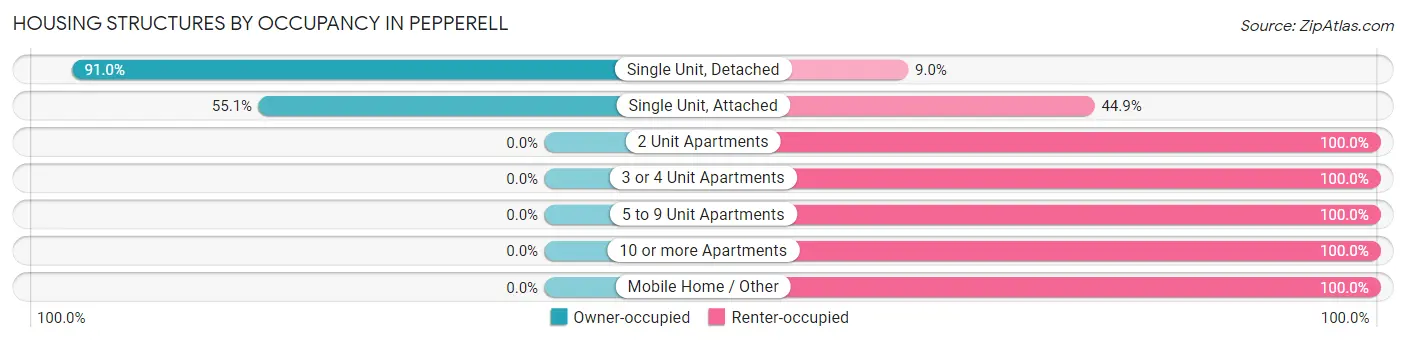
| Structure Type | Owner-occupied | Renter-occupied |
| Single Unit, Detached | 514 (91.0%) | 51 (9.0%) |
| Single Unit, Attached | 65 (55.1%) | 53 (44.9%) |
| 2 Unit Apartments | 0 (0.0%) | 19 (100.0%) |
| 3 or 4 Unit Apartments | 0 (0.0%) | 64 (100.0%) |
| 5 to 9 Unit Apartments | 0 (0.0%) | 74 (100.0%) |
| 10 or more Apartments | 0 (0.0%) | 193 (100.0%) |
| Mobile Home / Other | 0 (0.0%) | 14 (100.0%) |
| Total | 579 (55.3%) | 468 (44.7%) |
Housing Structures by Number of Rooms in Pepperell
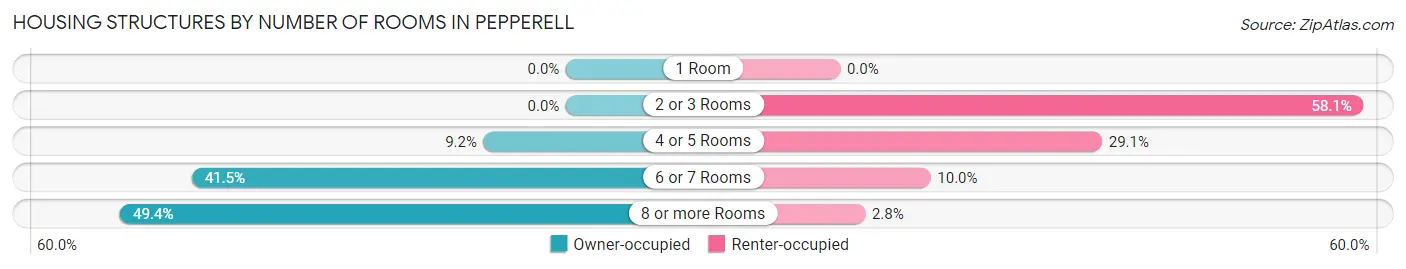
| Number of Rooms | Owner-occupied | Renter-occupied |
| 1 Room | 0 (0.0%) | 0 (0.0%) |
| 2 or 3 Rooms | 0 (0.0%) | 272 (58.1%) |
| 4 or 5 Rooms | 53 (9.1%) | 136 (29.1%) |
| 6 or 7 Rooms | 240 (41.4%) | 47 (10.0%) |
| 8 or more Rooms | 286 (49.4%) | 13 (2.8%) |
| Total | 579 (100.0%) | 468 (100.0%) |
Housing Structure by Heating Type in Pepperell
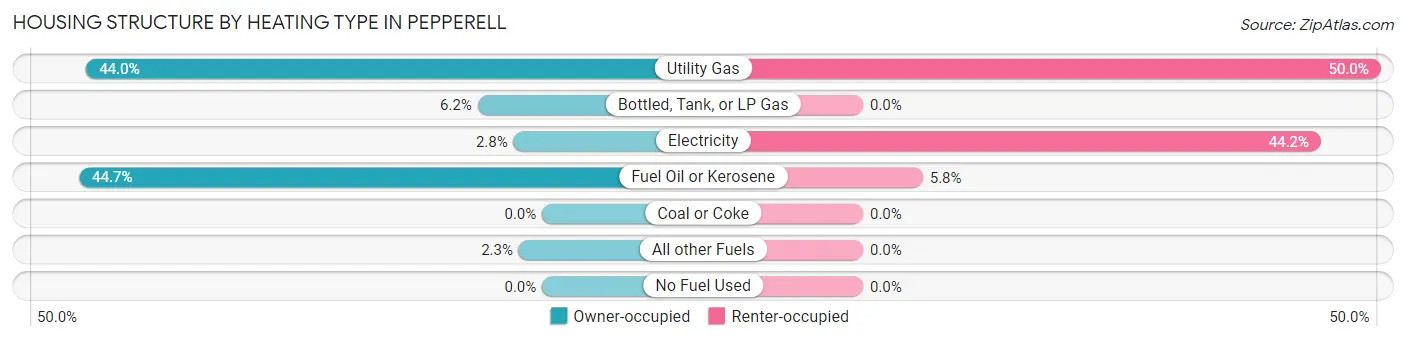
| Heating Type | Owner-occupied | Renter-occupied |
| Utility Gas | 255 (44.0%) | 234 (50.0%) |
| Bottled, Tank, or LP Gas | 36 (6.2%) | 0 (0.0%) |
| Electricity | 16 (2.8%) | 207 (44.2%) |
| Fuel Oil or Kerosene | 259 (44.7%) | 27 (5.8%) |
| Coal or Coke | 0 (0.0%) | 0 (0.0%) |
| All other Fuels | 13 (2.2%) | 0 (0.0%) |
| No Fuel Used | 0 (0.0%) | 0 (0.0%) |
| Total | 579 (100.0%) | 468 (100.0%) |
Household Vehicle Usage in Pepperell
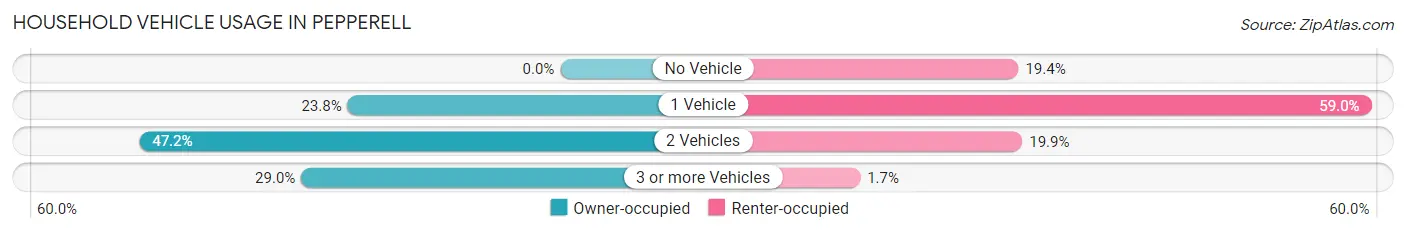
| Vehicles per Household | Owner-occupied | Renter-occupied |
| No Vehicle | 0 (0.0%) | 91 (19.4%) |
| 1 Vehicle | 138 (23.8%) | 276 (59.0%) |
| 2 Vehicles | 273 (47.1%) | 93 (19.9%) |
| 3 or more Vehicles | 168 (29.0%) | 8 (1.7%) |
| Total | 579 (100.0%) | 468 (100.0%) |
Real Estate & Mortgages in Pepperell
Real Estate and Mortgage Overview in Pepperell
| Characteristic | Without Mortgage | With Mortgage |
| Housing Units | 147 | 432 |
| Median Property Value | $314,800 | $415,100 |
| Median Household Income | $63,750 | $175 |
| Monthly Housing Costs | $930 | $141 |
| Real Estate Taxes | $4,879 | $0 |
Property Value by Mortgage Status in Pepperell
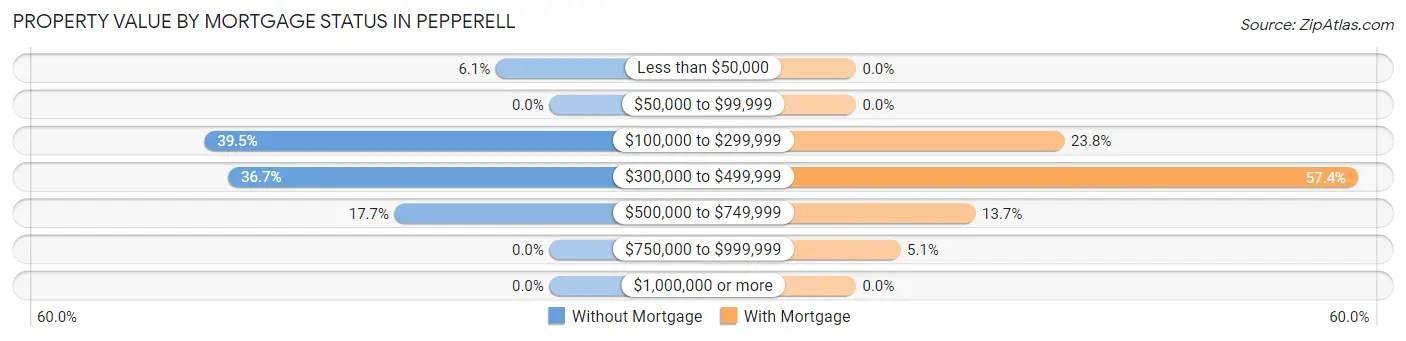
| Property Value | Without Mortgage | With Mortgage |
| Less than $50,000 | 9 (6.1%) | 0 (0.0%) |
| $50,000 to $99,999 | 0 (0.0%) | 0 (0.0%) |
| $100,000 to $299,999 | 58 (39.5%) | 103 (23.8%) |
| $300,000 to $499,999 | 54 (36.7%) | 248 (57.4%) |
| $500,000 to $749,999 | 26 (17.7%) | 59 (13.7%) |
| $750,000 to $999,999 | 0 (0.0%) | 22 (5.1%) |
| $1,000,000 or more | 0 (0.0%) | 0 (0.0%) |
| Total | 147 (100.0%) | 432 (100.0%) |
Household Income by Mortgage Status in Pepperell
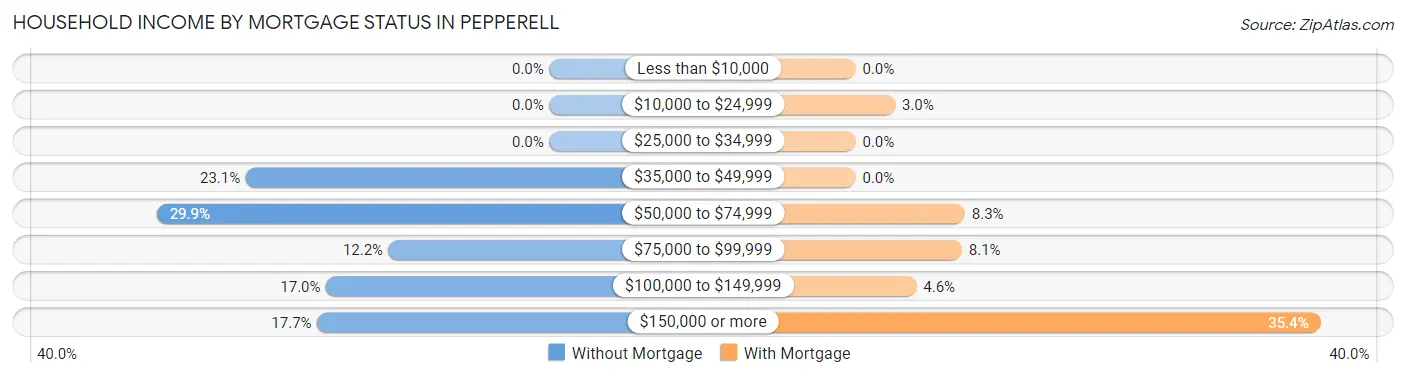
| Household Income | Without Mortgage | With Mortgage |
| Less than $10,000 | 0 (0.0%) | 0 (0.0%) |
| $10,000 to $24,999 | 0 (0.0%) | 13 (3.0%) |
| $25,000 to $34,999 | 0 (0.0%) | 0 (0.0%) |
| $35,000 to $49,999 | 34 (23.1%) | 0 (0.0%) |
| $50,000 to $74,999 | 44 (29.9%) | 36 (8.3%) |
| $75,000 to $99,999 | 18 (12.2%) | 35 (8.1%) |
| $100,000 to $149,999 | 25 (17.0%) | 20 (4.6%) |
| $150,000 or more | 26 (17.7%) | 153 (35.4%) |
| Total | 147 (100.0%) | 432 (100.0%) |
Property Value to Household Income Ratio in Pepperell
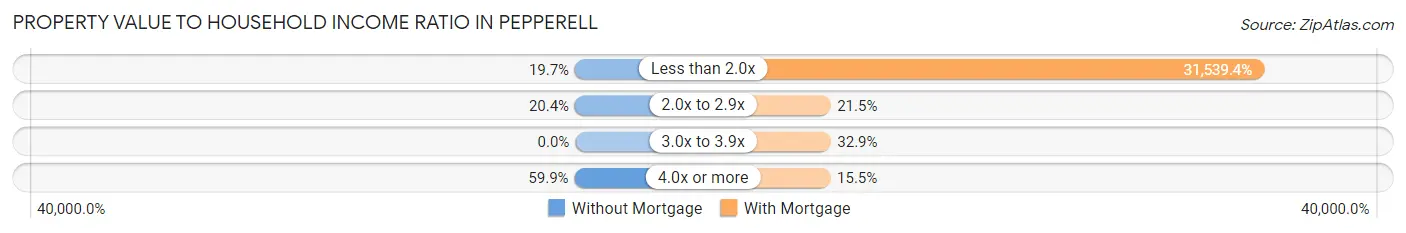
| Value-to-Income Ratio | Without Mortgage | With Mortgage |
| Less than 2.0x | 29 (19.7%) | 136,250 (31,539.4%) |
| 2.0x to 2.9x | 30 (20.4%) | 93 (21.5%) |
| 3.0x to 3.9x | 0 (0.0%) | 142 (32.9%) |
| 4.0x or more | 88 (59.9%) | 67 (15.5%) |
| Total | 147 (100.0%) | 432 (100.0%) |
Real Estate Taxes by Mortgage Status in Pepperell
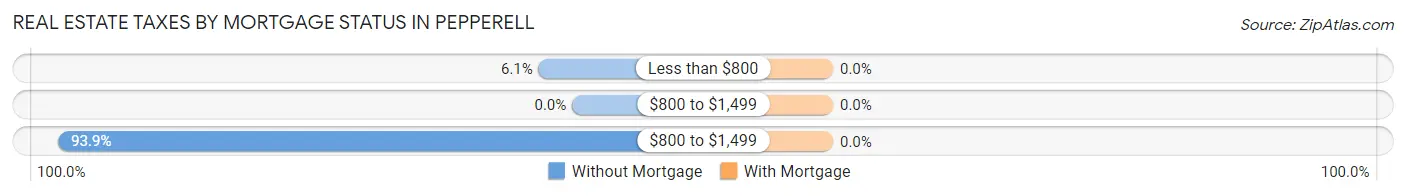
| Property Taxes | Without Mortgage | With Mortgage |
| Less than $800 | 9 (6.1%) | 0 (0.0%) |
| $800 to $1,499 | 0 (0.0%) | 0 (0.0%) |
| $800 to $1,499 | 138 (93.9%) | 0 (0.0%) |
| Total | 147 (100.0%) | 432 (100.0%) |
Health & Disability in Pepperell
Health Insurance Coverage by Age in Pepperell
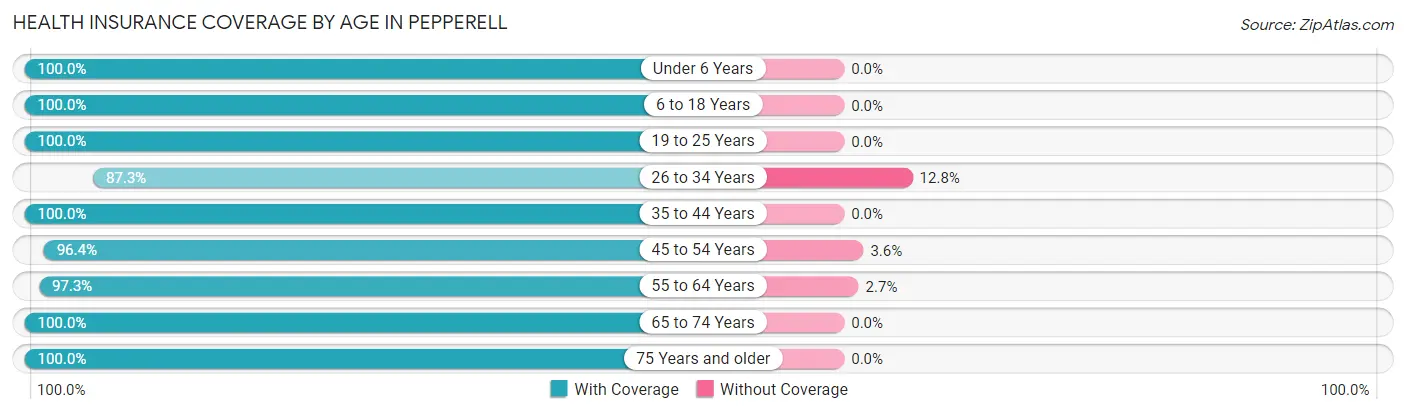
| Age Bracket | With Coverage | Without Coverage |
| Under 6 Years | 141 (100.0%) | 0 (0.0%) |
| 6 to 18 Years | 184 (100.0%) | 0 (0.0%) |
| 19 to 25 Years | 202 (100.0%) | 0 (0.0%) |
| 26 to 34 Years | 178 (87.3%) | 26 (12.8%) |
| 35 to 44 Years | 307 (100.0%) | 0 (0.0%) |
| 45 to 54 Years | 243 (96.4%) | 9 (3.6%) |
| 55 to 64 Years | 400 (97.3%) | 11 (2.7%) |
| 65 to 74 Years | 275 (100.0%) | 0 (0.0%) |
| 75 Years and older | 179 (100.0%) | 0 (0.0%) |
| Total | 2,109 (97.9%) | 46 (2.1%) |
Health Insurance Coverage by Citizenship Status in Pepperell
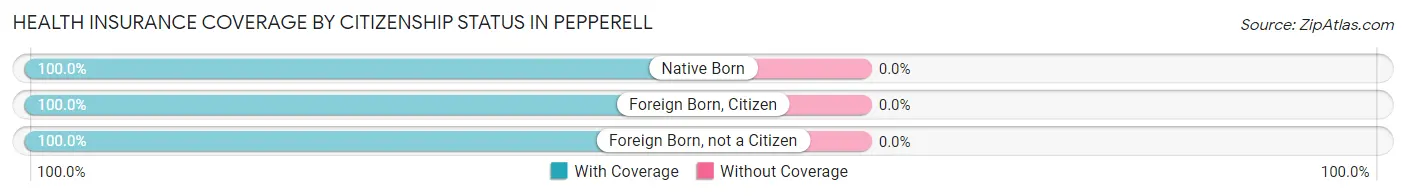
| Citizenship Status | With Coverage | Without Coverage |
| Native Born | 141 (100.0%) | 0 (0.0%) |
| Foreign Born, Citizen | 184 (100.0%) | 0 (0.0%) |
| Foreign Born, not a Citizen | 202 (100.0%) | 0 (0.0%) |
Health Insurance Coverage by Household Income in Pepperell
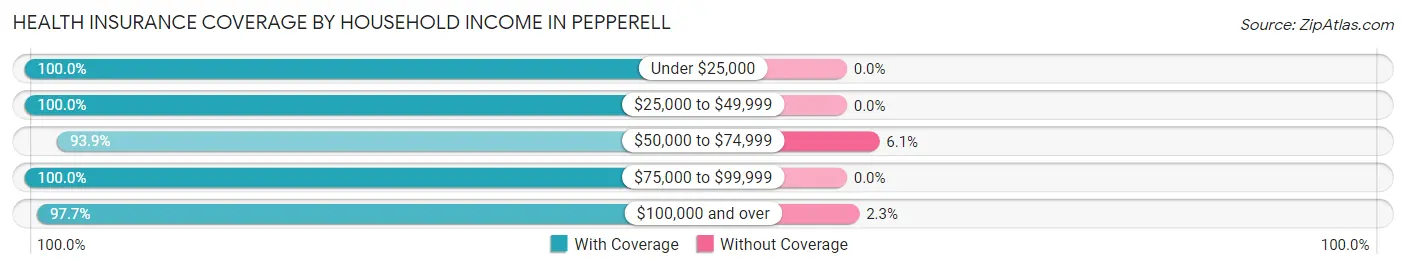
| Household Income | With Coverage | Without Coverage |
| Under $25,000 | 238 (100.0%) | 0 (0.0%) |
| $25,000 to $49,999 | 232 (100.0%) | 0 (0.0%) |
| $50,000 to $74,999 | 231 (93.9%) | 15 (6.1%) |
| $75,000 to $99,999 | 98 (100.0%) | 0 (0.0%) |
| $100,000 and over | 1,299 (97.7%) | 31 (2.3%) |
Public vs Private Health Insurance Coverage by Age in Pepperell
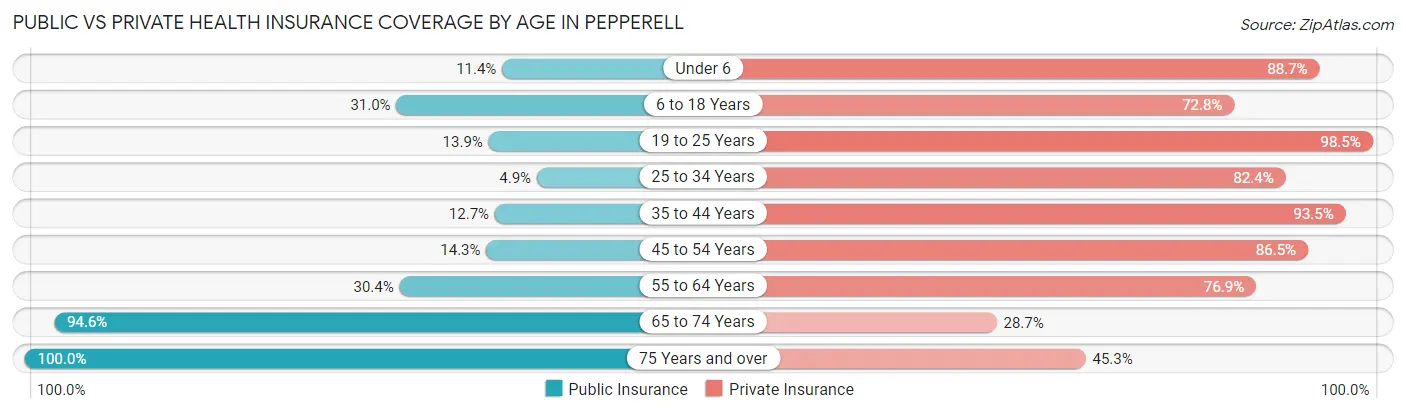
| Age Bracket | Public Insurance | Private Insurance |
| Under 6 | 16 (11.4%) | 125 (88.6%) |
| 6 to 18 Years | 57 (31.0%) | 134 (72.8%) |
| 19 to 25 Years | 28 (13.9%) | 199 (98.5%) |
| 25 to 34 Years | 10 (4.9%) | 168 (82.4%) |
| 35 to 44 Years | 39 (12.7%) | 287 (93.5%) |
| 45 to 54 Years | 36 (14.3%) | 218 (86.5%) |
| 55 to 64 Years | 125 (30.4%) | 316 (76.9%) |
| 65 to 74 Years | 260 (94.6%) | 79 (28.7%) |
| 75 Years and over | 179 (100.0%) | 81 (45.3%) |
| Total | 750 (34.8%) | 1,607 (74.6%) |
Disability Status by Sex by Age in Pepperell
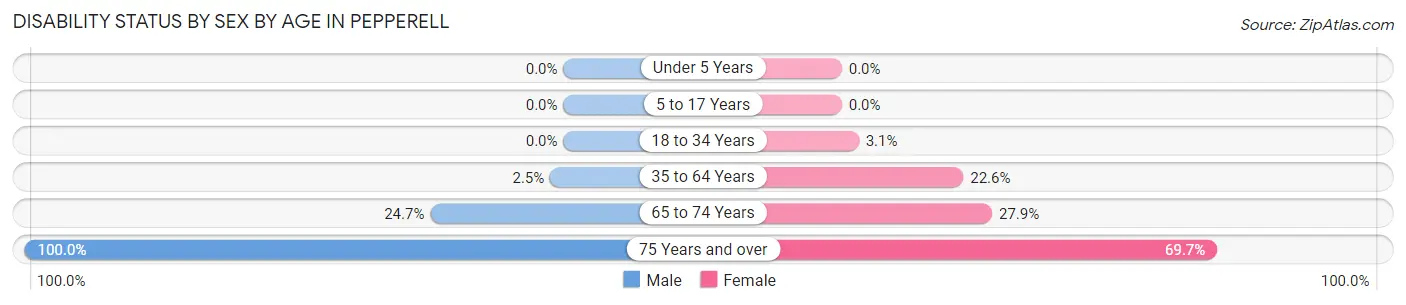
| Age Bracket | Male | Female |
| Under 5 Years | 0 (0.0%) | 0 (0.0%) |
| 5 to 17 Years | 0 (0.0%) | 0 (0.0%) |
| 18 to 34 Years | 0 (0.0%) | 8 (3.1%) |
| 35 to 64 Years | 11 (2.5%) | 118 (22.6%) |
| 65 to 74 Years | 21 (24.7%) | 53 (27.9%) |
| 75 Years and over | 90 (100.0%) | 62 (69.7%) |
Disability Class by Sex by Age in Pepperell
Disability Class: Hearing Difficulty
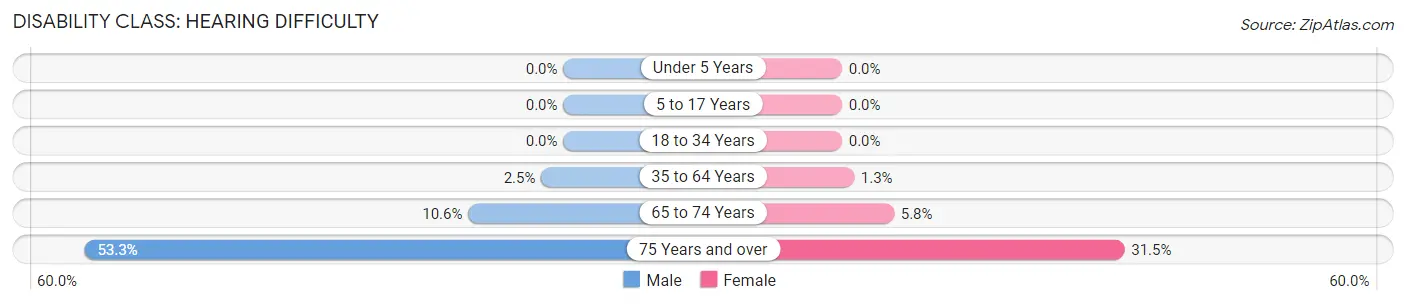
| Age Bracket | Male | Female |
| Under 5 Years | 0 (0.0%) | 0 (0.0%) |
| 5 to 17 Years | 0 (0.0%) | 0 (0.0%) |
| 18 to 34 Years | 0 (0.0%) | 0 (0.0%) |
| 35 to 64 Years | 11 (2.5%) | 7 (1.3%) |
| 65 to 74 Years | 9 (10.6%) | 11 (5.8%) |
| 75 Years and over | 48 (53.3%) | 28 (31.5%) |
Disability Class: Vision Difficulty
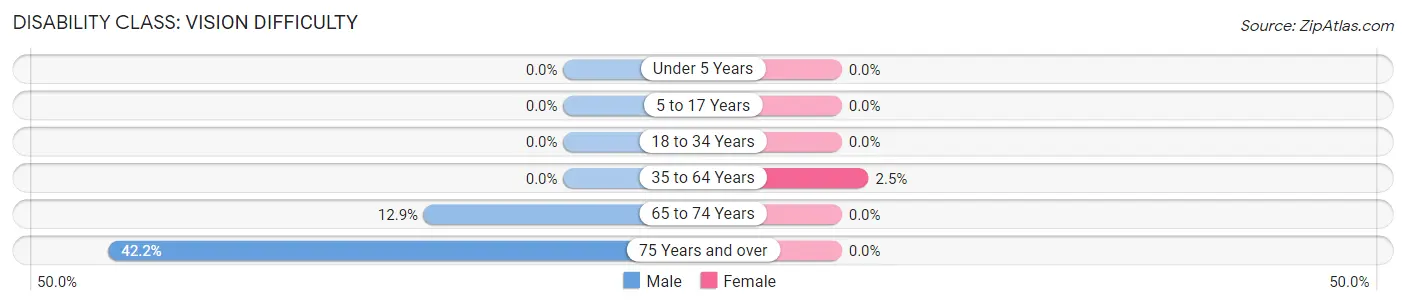
| Age Bracket | Male | Female |
| Under 5 Years | 0 (0.0%) | 0 (0.0%) |
| 5 to 17 Years | 0 (0.0%) | 0 (0.0%) |
| 18 to 34 Years | 0 (0.0%) | 0 (0.0%) |
| 35 to 64 Years | 0 (0.0%) | 13 (2.5%) |
| 65 to 74 Years | 11 (12.9%) | 0 (0.0%) |
| 75 Years and over | 38 (42.2%) | 0 (0.0%) |
Disability Class: Cognitive Difficulty
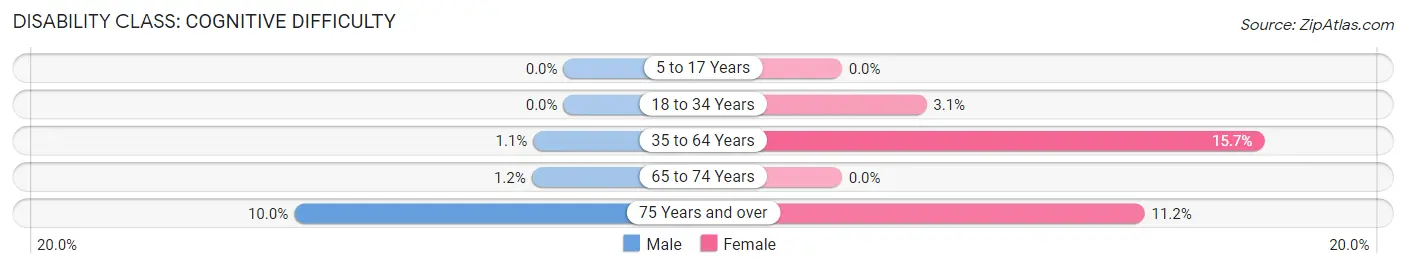
| Age Bracket | Male | Female |
| 5 to 17 Years | 0 (0.0%) | 0 (0.0%) |
| 18 to 34 Years | 0 (0.0%) | 8 (3.1%) |
| 35 to 64 Years | 5 (1.1%) | 82 (15.7%) |
| 65 to 74 Years | 1 (1.2%) | 0 (0.0%) |
| 75 Years and over | 9 (10.0%) | 10 (11.2%) |
Disability Class: Ambulatory Difficulty
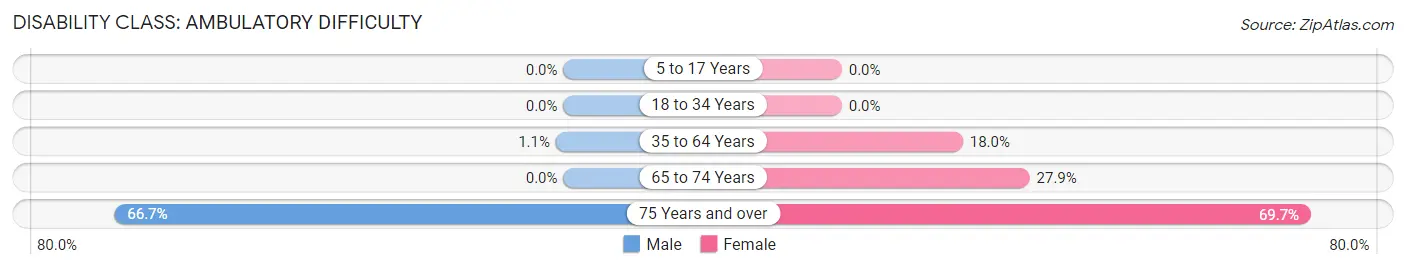
| Age Bracket | Male | Female |
| 5 to 17 Years | 0 (0.0%) | 0 (0.0%) |
| 18 to 34 Years | 0 (0.0%) | 0 (0.0%) |
| 35 to 64 Years | 5 (1.1%) | 94 (18.0%) |
| 65 to 74 Years | 0 (0.0%) | 53 (27.9%) |
| 75 Years and over | 60 (66.7%) | 62 (69.7%) |
Disability Class: Self-Care Difficulty
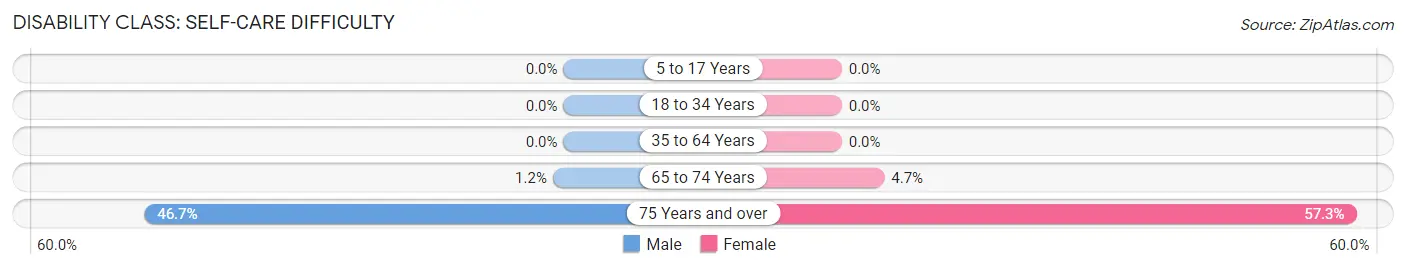
| Age Bracket | Male | Female |
| 5 to 17 Years | 0 (0.0%) | 0 (0.0%) |
| 18 to 34 Years | 0 (0.0%) | 0 (0.0%) |
| 35 to 64 Years | 0 (0.0%) | 0 (0.0%) |
| 65 to 74 Years | 1 (1.2%) | 9 (4.7%) |
| 75 Years and over | 42 (46.7%) | 51 (57.3%) |
Technology Access in Pepperell
Computing Device Access in Pepperell
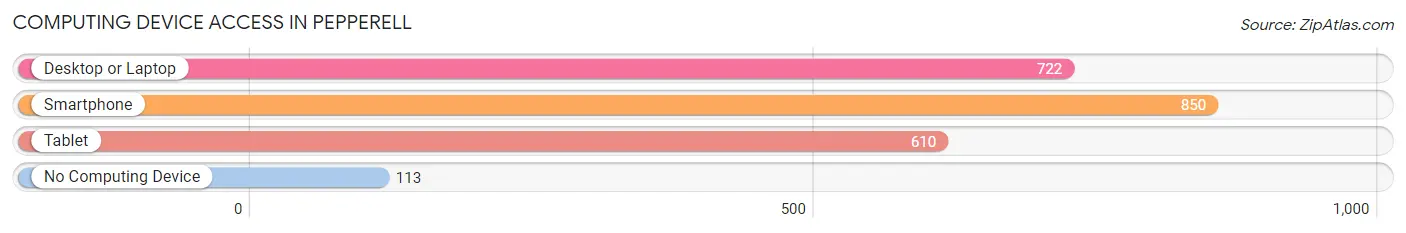
| Device Type | # Households | % Households |
| Desktop or Laptop | 722 | 69.0% |
| Smartphone | 850 | 81.2% |
| Tablet | 610 | 58.3% |
| No Computing Device | 113 | 10.8% |
| Total | 1,047 | 100.0% |
Internet Access in Pepperell
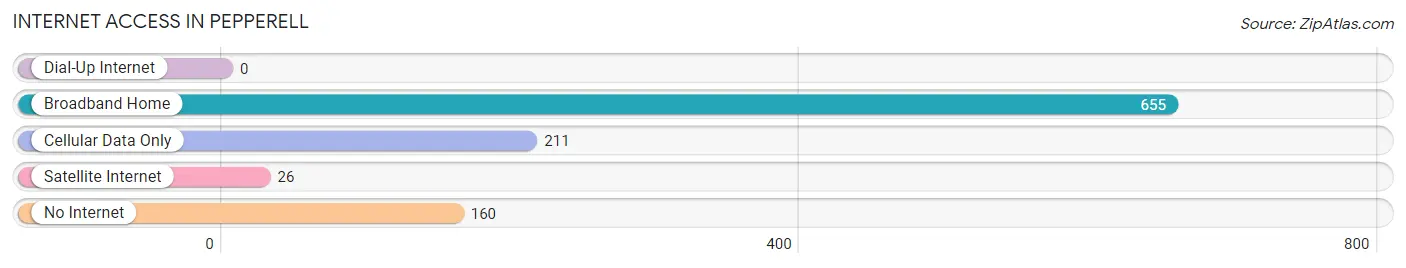
| Internet Type | # Households | % Households |
| Dial-Up Internet | 0 | 0.0% |
| Broadband Home | 655 | 62.6% |
| Cellular Data Only | 211 | 20.2% |
| Satellite Internet | 26 | 2.5% |
| No Internet | 160 | 15.3% |
| Total | 1,047 | 100.0% |
Pepperell Summary
Pepperell is a small town located in Middlesex County, Massachusetts, United States. It is situated along the Nashua River, approximately 25 miles northwest of Boston. The town was incorporated in 1775 and has a population of 11,497 as of the 2010 census.
History
Pepperell was first settled in 1720 by a group of settlers from Groton, Massachusetts. The town was originally known as "Petersham", after the town in England from which the settlers had emigrated. In 1753, the town was renamed "Pepperell" after Sir William Pepperrell, a British military leader who had served in the French and Indian War.
Pepperell was an important center of the Revolutionary War. In 1775, the town was the site of the Battle of Pepperell, a skirmish between British and American forces. The town was also the site of a major Revolutionary War supply depot, which was used to store weapons and ammunition for the Continental Army.
In the 19th century, Pepperell was an important center of the textile industry. The town was home to several large mills, including the Pepperell Manufacturing Company, which was founded in 1826 and was one of the largest textile mills in the United States. The mill was the site of a major strike in 1912, which resulted in the formation of the United Textile Workers of America.
Geography
Pepperell is located in northeastern Massachusetts, approximately 25 miles northwest of Boston. The town is situated along the Nashua River, which forms the town's western border. The town is bordered by Groton to the north, Townsend to the east, Dunstable to the south, and Hollis, New Hampshire to the west.
The town has a total area of 16.3 square miles, of which 16.2 square miles is land and 0.1 square miles is water. The town is mostly rural, with a few small villages and hamlets scattered throughout. The highest point in the town is the summit of Pepperell Hill, which has an elevation of 590 feet.
Economy
Pepperell's economy is largely based on agriculture and manufacturing. The town is home to several small farms, which produce a variety of crops, including apples, corn, and hay. The town is also home to several small manufacturing companies, which produce a variety of products, including textiles, paper products, and plastic products.
The town is also home to several small businesses, including restaurants, retail stores, and professional services. The town is also home to several small technology companies, which specialize in software development and web design.
Demographics
As of the 2010 census, Pepperell had a population of 11,497. The racial makeup of the town was 94.3% White, 1.2% African American, 0.3% Native American, 1.2% Asian, 0.1% Pacific Islander, 1.2% from other races, and 1.8% from two or more races. Hispanic or Latino of any race were 3.2% of the population.
The median household income in Pepperell was $71,944, and the median family income was $83,944. The per capita income for the town was $30,944. About 4.2% of families and 5.3% of the population were below the poverty line, including 6.2% of those under age 18 and 4.2% of those age 65 or over.
Common Questions
What is Per Capita Income in Pepperell?
Per Capita income in Pepperell is $51,102.
What is the Median Family Income in Pepperell?
Median Family Income in Pepperell is $139,773.
What is the Median Household income in Pepperell?
Median Household Income in Pepperell is $91,406.
What is Income or Wage Gap in Pepperell?
Income or Wage Gap in Pepperell is 39.6%.
Women in Pepperell earn 60.4 cents for every dollar earned by a man.
What is Inequality or Gini Index in Pepperell?
Inequality or Gini Index in Pepperell is 0.47.
What is the Total Population of Pepperell?
Total Population of Pepperell is 2,205.
What is the Total Male Population of Pepperell?
Total Male Population of Pepperell is 981.
What is the Total Female Population of Pepperell?
Total Female Population of Pepperell is 1,224.
What is the Ratio of Males per 100 Females in Pepperell?
There are 80.15 Males per 100 Females in Pepperell.
What is the Ratio of Females per 100 Males in Pepperell?
There are 124.77 Females per 100 Males in Pepperell.
What is the Median Population Age in Pepperell?
Median Population Age in Pepperell is 47.6 Years.
What is the Average Family Size in Pepperell
Average Family Size in Pepperell is 2.8 People.
What is the Average Household Size in Pepperell
Average Household Size in Pepperell is 2.0 People.
How Large is the Labor Force in Pepperell?
There are 1,183 People in the Labor Forcein in Pepperell.
What is the Percentage of People in the Labor Force in Pepperell?
61.8% of People are in the Labor Force in Pepperell.
What is the Unemployment Rate in Pepperell?
Unemployment Rate in Pepperell is 6.6%.