Duxbury, MA Map & Demographics
Duxbury Map
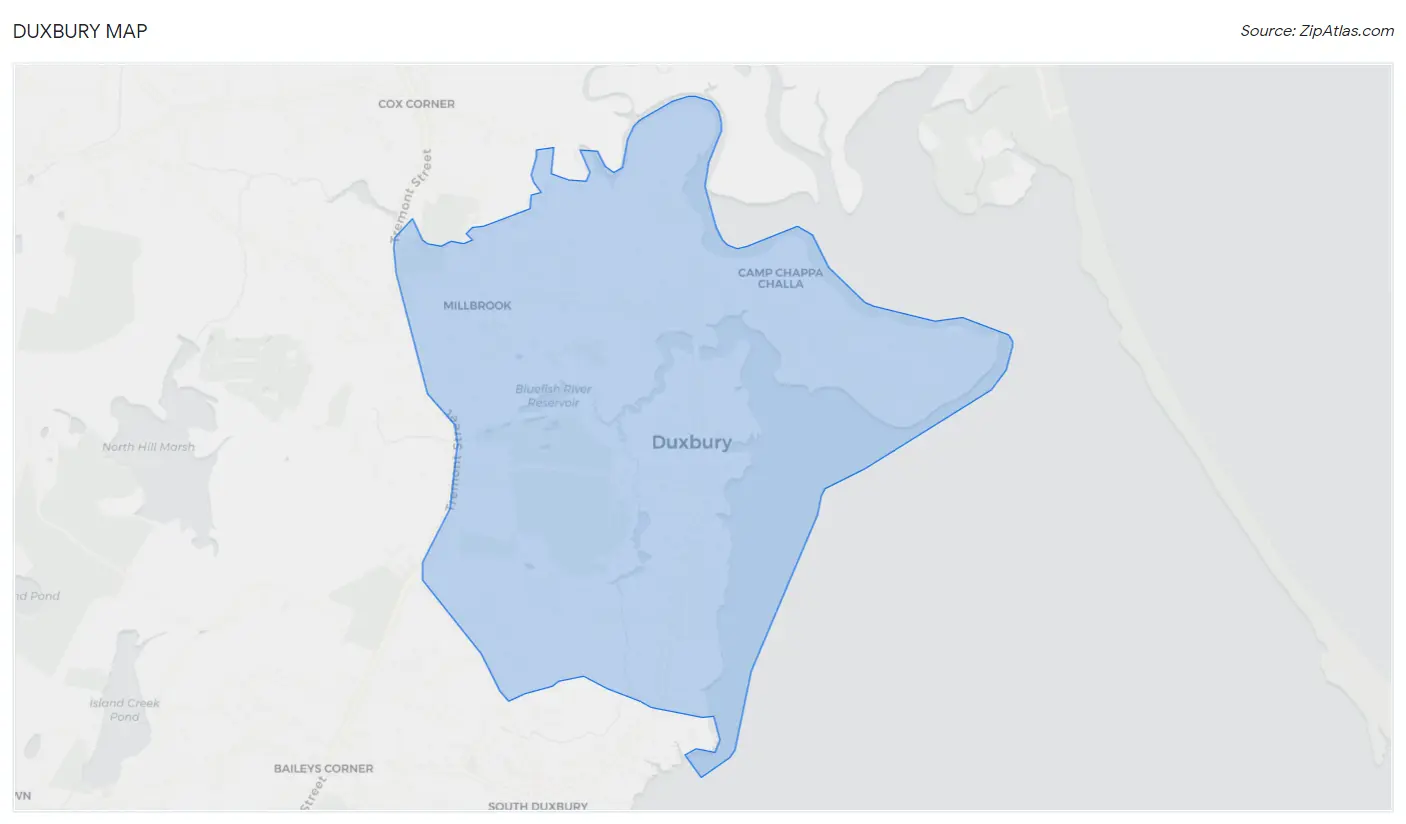
Duxbury Overview
$135,376
PER CAPITA INCOME
$213,472
AVG FAMILY INCOME
$128,000
AVG HOUSEHOLD INCOME
67.6%
WAGE / INCOME GAP [ % ]
32.4¢/ $1
WAGE / INCOME GAP [ $ ]
0.58
INEQUALITY / GINI INDEX
1,761
TOTAL POPULATION
939
MALE POPULATION
822
FEMALE POPULATION
114.23
MALES / 100 FEMALES
87.54
FEMALES / 100 MALES
55.5
MEDIAN AGE
3.0
AVG FAMILY SIZE
2.4
AVG HOUSEHOLD SIZE
1,057
LABOR FORCE [ PEOPLE ]
71.2%
PERCENT IN LABOR FORCE
5.6%
UNEMPLOYMENT RATE
Duxbury Zip Codes
Income in Duxbury
Income Overview in Duxbury
Per Capita Income in Duxbury is $135,376, while median incomes of families and households are $213,472 and $128,000 respectively.
| Characteristic | Number | Measure |
| Per Capita Income | 1,761 | $135,376 |
| Median Family Income | 509 | $213,472 |
| Mean Family Income | 509 | $421,184 |
| Median Household Income | 732 | $128,000 |
| Mean Household Income | 732 | $324,041 |
| Income Deficit | 509 | $0 |
| Wage / Income Gap (%) | 1,761 | 67.59% |
| Wage / Income Gap ($) | 1,761 | 32.41¢ per $1 |
| Gini / Inequality Index | 1,761 | 0.58 |
Earnings by Sex in Duxbury
Average Earnings in Duxbury are $93,468, $104,277 for men and $33,793 for women, a difference of 67.6%.
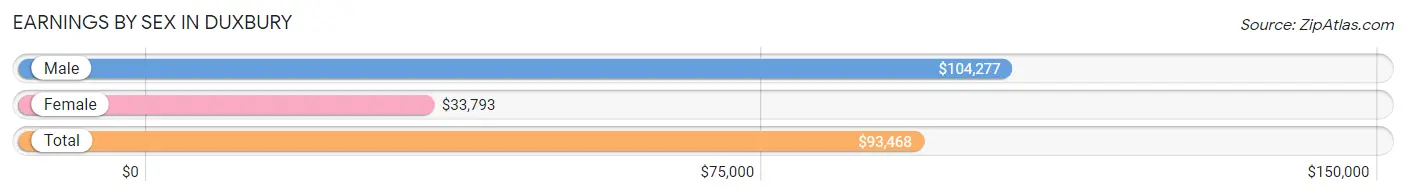
| Sex | Number | Average Earnings |
| Male | 672 (61.7%) | $104,277 |
| Female | 418 (38.4%) | $33,793 |
| Total | 1,090 (100.0%) | $93,468 |
Earnings by Sex by Income Bracket in Duxbury
The most common earnings brackets in Duxbury are $100,000+ for men (445 | 66.2%) and $100,000+ for women (81 | 19.4%).
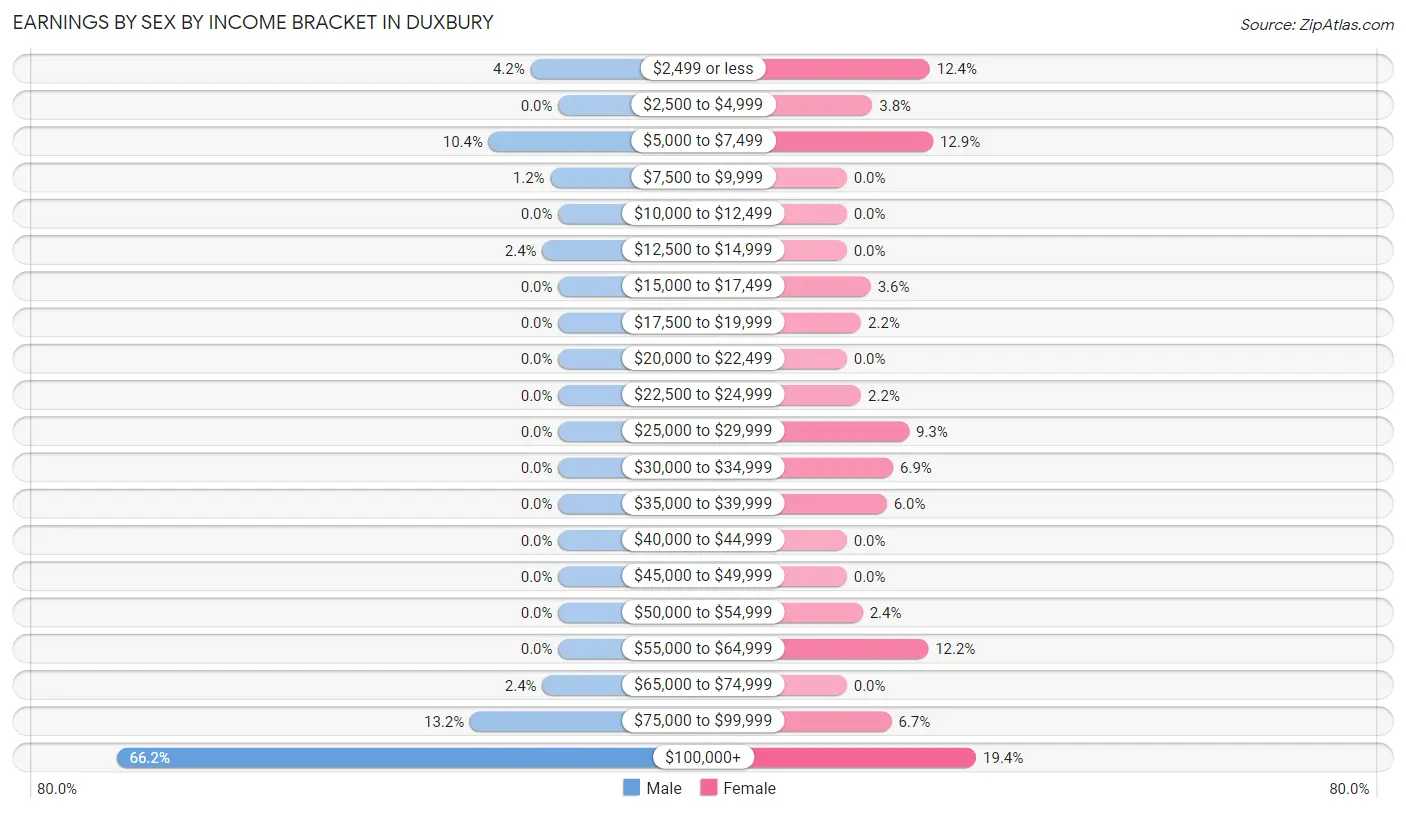
| Income | Male | Female |
| $2,499 or less | 28 (4.2%) | 52 (12.4%) |
| $2,500 to $4,999 | 0 (0.0%) | 16 (3.8%) |
| $5,000 to $7,499 | 70 (10.4%) | 54 (12.9%) |
| $7,500 to $9,999 | 8 (1.2%) | 0 (0.0%) |
| $10,000 to $12,499 | 0 (0.0%) | 0 (0.0%) |
| $12,500 to $14,999 | 16 (2.4%) | 0 (0.0%) |
| $15,000 to $17,499 | 0 (0.0%) | 15 (3.6%) |
| $17,500 to $19,999 | 0 (0.0%) | 9 (2.1%) |
| $20,000 to $22,499 | 0 (0.0%) | 0 (0.0%) |
| $22,500 to $24,999 | 0 (0.0%) | 9 (2.1%) |
| $25,000 to $29,999 | 0 (0.0%) | 39 (9.3%) |
| $30,000 to $34,999 | 0 (0.0%) | 29 (6.9%) |
| $35,000 to $39,999 | 0 (0.0%) | 25 (6.0%) |
| $40,000 to $44,999 | 0 (0.0%) | 0 (0.0%) |
| $45,000 to $49,999 | 0 (0.0%) | 0 (0.0%) |
| $50,000 to $54,999 | 0 (0.0%) | 10 (2.4%) |
| $55,000 to $64,999 | 0 (0.0%) | 51 (12.2%) |
| $65,000 to $74,999 | 16 (2.4%) | 0 (0.0%) |
| $75,000 to $99,999 | 89 (13.2%) | 28 (6.7%) |
| $100,000+ | 445 (66.2%) | 81 (19.4%) |
| Total | 672 (100.0%) | 418 (100.0%) |
Earnings by Sex by Educational Attainment in Duxbury
Average earnings in Duxbury are $104,590 for men and $39,150 for women, a difference of 62.6%. Men with an educational attainment of graduate degree enjoy the highest average annual earnings of $229,688, while those with bachelor's degree education earn the least with $103,422. Women with an educational attainment of bachelor's degree earn the most with the average annual earnings of $38,456, while those with graduate degree education have the smallest earnings of $34,318.
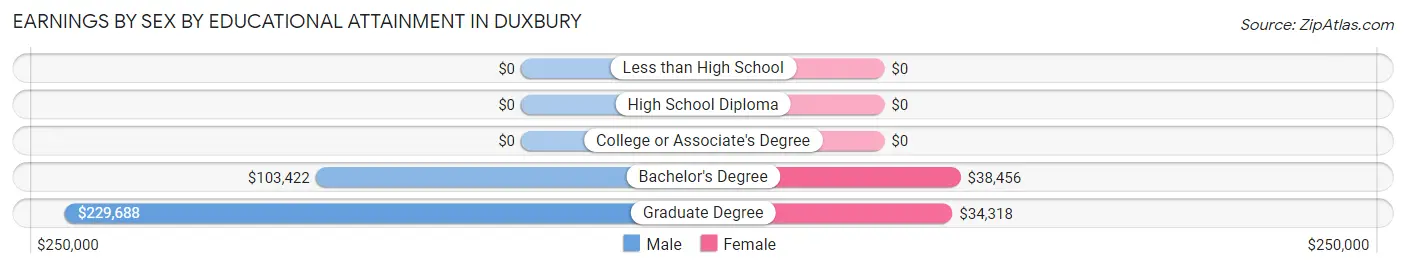
| Educational Attainment | Male Income | Female Income |
| Less than High School | - | - |
| High School Diploma | - | - |
| College or Associate's Degree | - | - |
| Bachelor's Degree | $103,422 | $38,456 |
| Graduate Degree | $229,688 | $34,318 |
| Total | $104,590 | $39,150 |
Family Income in Duxbury
Family Income Brackets in Duxbury
According to the Duxbury family income data, there are 279 families falling into the $200,000+ income range, which is the most common income bracket and makes up 54.8% of all families.
| Income Bracket | # Families | % Families |
| Less than $10,000 | 38 | 7.5% |
| $10,000 to $14,999 | 0 | 0.0% |
| $15,000 to $24,999 | 0 | 0.0% |
| $25,000 to $34,999 | 0 | 0.0% |
| $35,000 to $49,999 | 12 | 2.4% |
| $50,000 to $74,999 | 33 | 6.5% |
| $75,000 to $99,999 | 8 | 1.6% |
| $100,000 to $149,999 | 85 | 16.7% |
| $150,000 to $199,999 | 54 | 10.6% |
| $200,000+ | 279 | 54.8% |
Family Income by Famaliy Size in Duxbury
3-person families (49 | 9.6%) account for the highest median family income in Duxbury with $250,001 per family, while 2-person families (289 | 56.8%) have the highest median income of $121,797 per family member.
| Income Bracket | # Families | Median Income |
| 2-Person Families | 289 (56.8%) | $243,594 |
| 3-Person Families | 49 (9.6%) | $250,001 |
| 4-Person Families | 106 (20.8%) | $0 |
| 5-Person Families | 65 (12.8%) | $167,260 |
| 6-Person Families | 0 (0.0%) | $0 |
| 7+ Person Families | 0 (0.0%) | $0 |
| Total | 509 (100.0%) | $213,472 |
Family Income by Number of Earners in Duxbury
| Number of Earners | # Families | Median Income |
| No Earners | 57 (11.2%) | $169,241 |
| 1 Earner | 171 (33.6%) | $0 |
| 2 Earners | 193 (37.9%) | $250,001 |
| 3+ Earners | 88 (17.3%) | $250,001 |
| Total | 509 (100.0%) | $213,472 |
Household Income in Duxbury
Household Income Brackets in Duxbury
With 279 households falling in the category, the $200,000+ income range is the most frequent in Duxbury, accounting for 38.1% of all households.
| Income Bracket | # Households | % Households |
| Less than $10,000 | 38 | 5.2% |
| $10,000 to $14,999 | 0 | 0.0% |
| $15,000 to $24,999 | 0 | 0.0% |
| $25,000 to $34,999 | 0 | 0.0% |
| $35,000 to $49,999 | 12 | 1.6% |
| $50,000 to $74,999 | 63 | 8.6% |
| $75,000 to $99,999 | 8 | 1.1% |
| $100,000 to $149,999 | 278 | 38.0% |
| $150,000 to $199,999 | 54 | 7.4% |
| $200,000+ | 279 | 38.1% |
Household Income by Householder Age in Duxbury
The median household income in Duxbury is $128,000, with the highest median household income of $250,001 found in the 25 to 44 years age bracket for the primary householder. A total of 56 households (7.6%) fall into this category. Meanwhile, the 15 to 24 years age bracket for the primary householder has the lowest median household income of $0, with 7 households (1.0%) in this group.
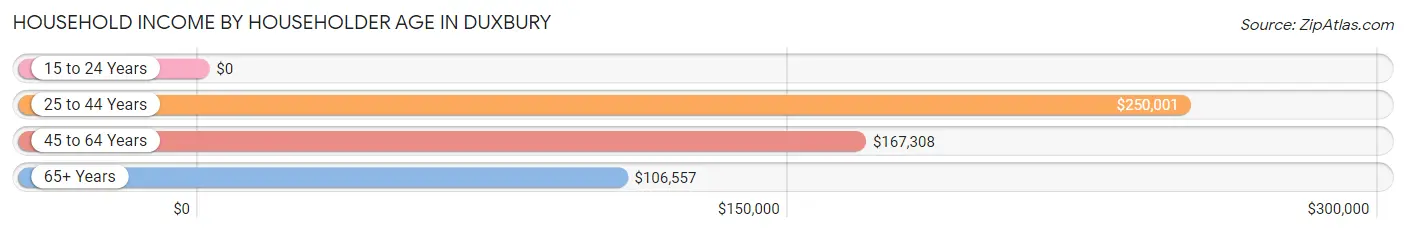
| Income Bracket | # Households | Median Income |
| 15 to 24 Years | 7 (1.0%) | $0 |
| 25 to 44 Years | 56 (7.6%) | $250,001 |
| 45 to 64 Years | 380 (51.9%) | $167,308 |
| 65+ Years | 289 (39.5%) | $106,557 |
| Total | 732 (100.0%) | $128,000 |
Poverty in Duxbury
Income Below Poverty by Sex and Age in Duxbury
With 12.8% poverty level for males and 4.4% for females among the residents of Duxbury, 12 to 14 year old males and 45 to 54 year old females are the most vulnerable to poverty, with 82 males (74.6%) and 36 females (32.4%) in their respective age groups living below the poverty level.
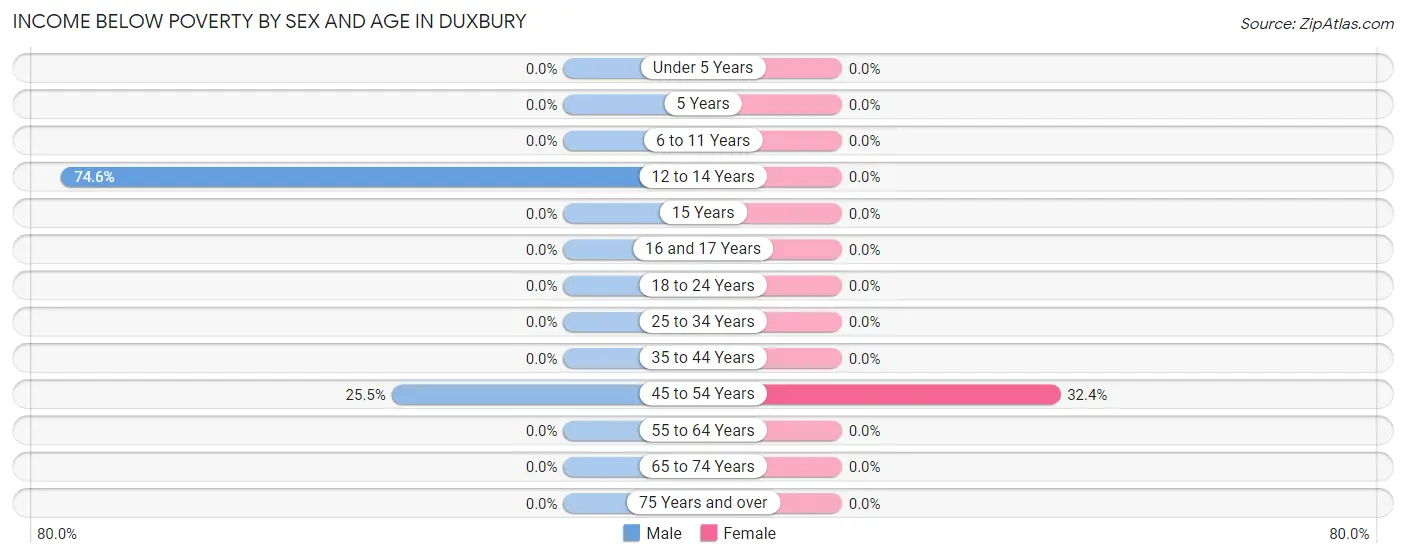
| Age Bracket | Male | Female |
| Under 5 Years | 0 (0.0%) | 0 (0.0%) |
| 5 Years | 0 (0.0%) | 0 (0.0%) |
| 6 to 11 Years | 0 (0.0%) | 0 (0.0%) |
| 12 to 14 Years | 82 (74.6%) | 0 (0.0%) |
| 15 Years | 0 (0.0%) | 0 (0.0%) |
| 16 and 17 Years | 0 (0.0%) | 0 (0.0%) |
| 18 to 24 Years | 0 (0.0%) | 0 (0.0%) |
| 25 to 34 Years | 0 (0.0%) | 0 (0.0%) |
| 35 to 44 Years | 0 (0.0%) | 0 (0.0%) |
| 45 to 54 Years | 38 (25.5%) | 36 (32.4%) |
| 55 to 64 Years | 0 (0.0%) | 0 (0.0%) |
| 65 to 74 Years | 0 (0.0%) | 0 (0.0%) |
| 75 Years and over | 0 (0.0%) | 0 (0.0%) |
| Total | 120 (12.8%) | 36 (4.4%) |
Income Above Poverty by Sex and Age in Duxbury
According to the poverty statistics in Duxbury, males aged under 5 years and females aged under 5 years are the age groups that are most secure financially, with 100.0% of males and 100.0% of females in these age groups living above the poverty line.
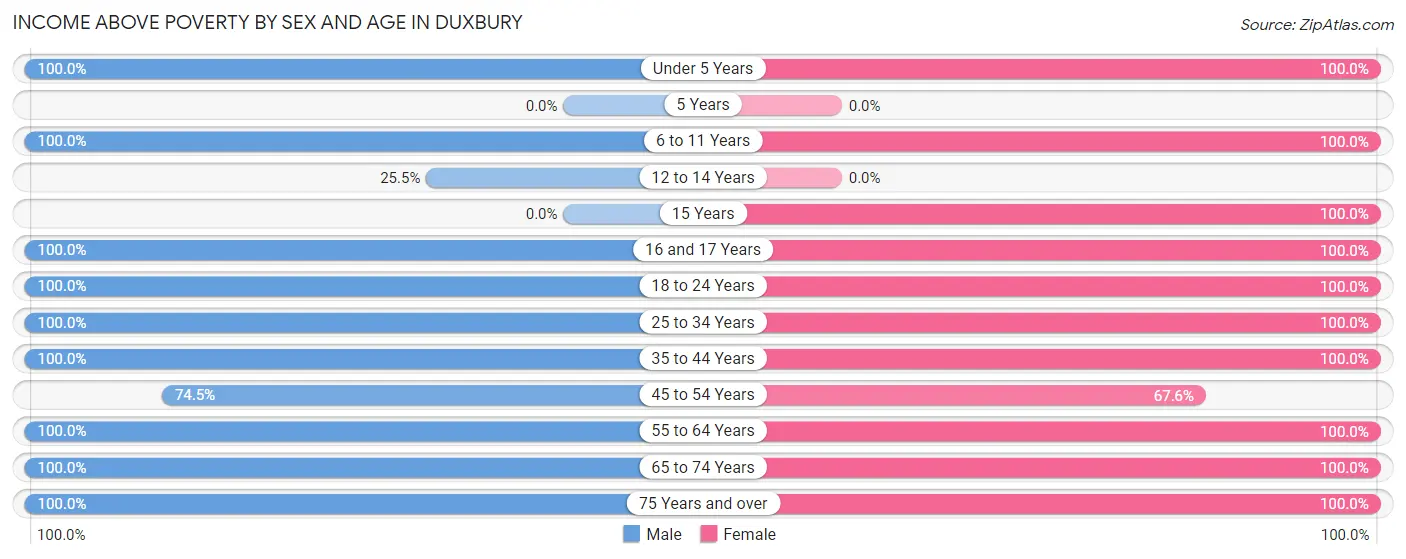
| Age Bracket | Male | Female |
| Under 5 Years | 17 (100.0%) | 38 (100.0%) |
| 5 Years | 0 (0.0%) | 0 (0.0%) |
| 6 to 11 Years | 26 (100.0%) | 52 (100.0%) |
| 12 to 14 Years | 28 (25.5%) | 0 (0.0%) |
| 15 Years | 0 (0.0%) | 33 (100.0%) |
| 16 and 17 Years | 8 (100.0%) | 8 (100.0%) |
| 18 to 24 Years | 32 (100.0%) | 78 (100.0%) |
| 25 to 34 Years | 44 (100.0%) | 59 (100.0%) |
| 35 to 44 Years | 40 (100.0%) | 54 (100.0%) |
| 45 to 54 Years | 111 (74.5%) | 75 (67.6%) |
| 55 to 64 Years | 208 (100.0%) | 263 (100.0%) |
| 65 to 74 Years | 135 (100.0%) | 62 (100.0%) |
| 75 Years and over | 170 (100.0%) | 64 (100.0%) |
| Total | 819 (87.2%) | 786 (95.6%) |
Income Below Poverty Among Married-Couple Families in Duxbury
The poverty statistics for married-couple families in Duxbury show that 7.9% or 38 of the total 483 families live below the poverty line. Families with 1 or 2 children have the highest poverty rate of 30.6%, comprising of 38 families. On the other hand, families with no children have the lowest poverty rate of 0.0%, which includes 0 families.
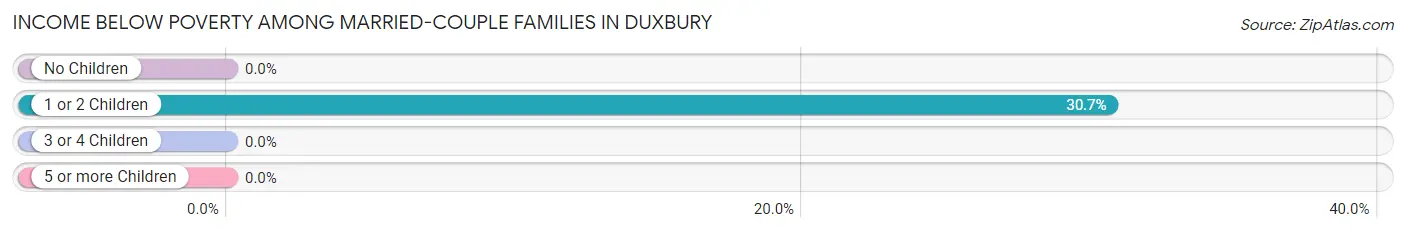
| Children | Above Poverty | Below Poverty |
| No Children | 337 (100.0%) | 0 (0.0%) |
| 1 or 2 Children | 86 (69.4%) | 38 (30.6%) |
| 3 or 4 Children | 22 (100.0%) | 0 (0.0%) |
| 5 or more Children | 0 (0.0%) | 0 (0.0%) |
| Total | 445 (92.1%) | 38 (7.9%) |
Income Below Poverty Among Single-Parent Households in Duxbury
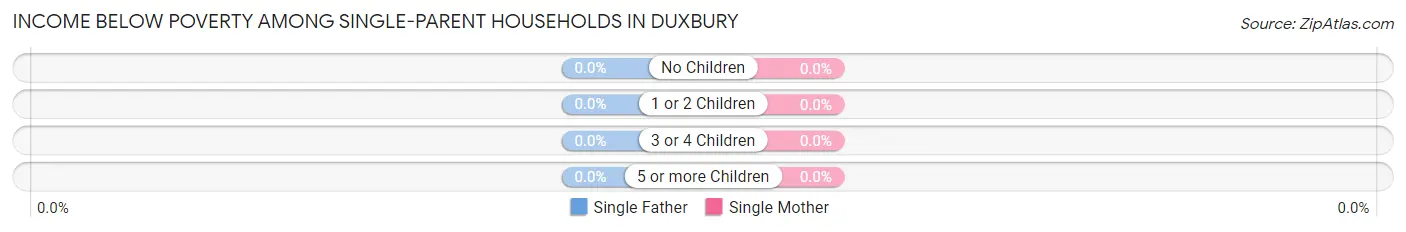
| Children | Single Father | Single Mother |
| No Children | 0 (0.0%) | 0 (0.0%) |
| 1 or 2 Children | 0 (0.0%) | 0 (0.0%) |
| 3 or 4 Children | 0 (0.0%) | 0 (0.0%) |
| 5 or more Children | 0 (0.0%) | 0 (0.0%) |
| Total | 0 (0.0%) | 0 (0.0%) |
Income Below Poverty Among Married-Couple vs Single-Parent Households in Duxbury
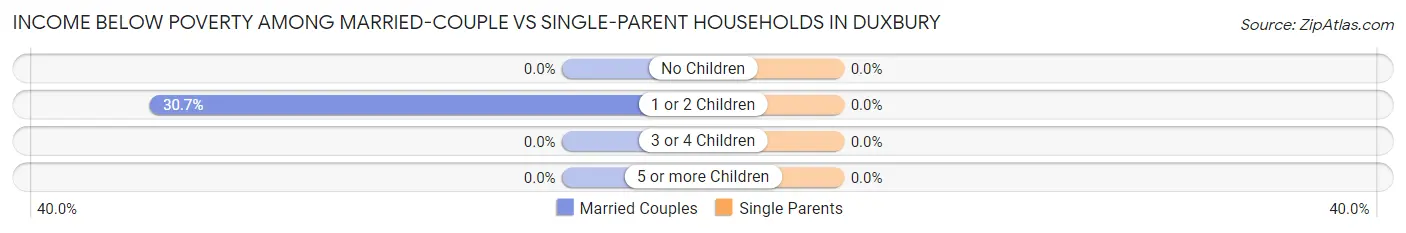
| Children | Married-Couple Families | Single-Parent Households |
| No Children | 0 (0.0%) | 0 (0.0%) |
| 1 or 2 Children | 38 (30.6%) | 0 (0.0%) |
| 3 or 4 Children | 0 (0.0%) | 0 (0.0%) |
| 5 or more Children | 0 (0.0%) | 0 (0.0%) |
| Total | 38 (7.9%) | 0 (0.0%) |
Race in Duxbury
The most populous races in Duxbury are White / Caucasian (1,725 | 98.0%), Two or more Races (36 | 2.0%), and Hispanic or Latino (6 | 0.3%).
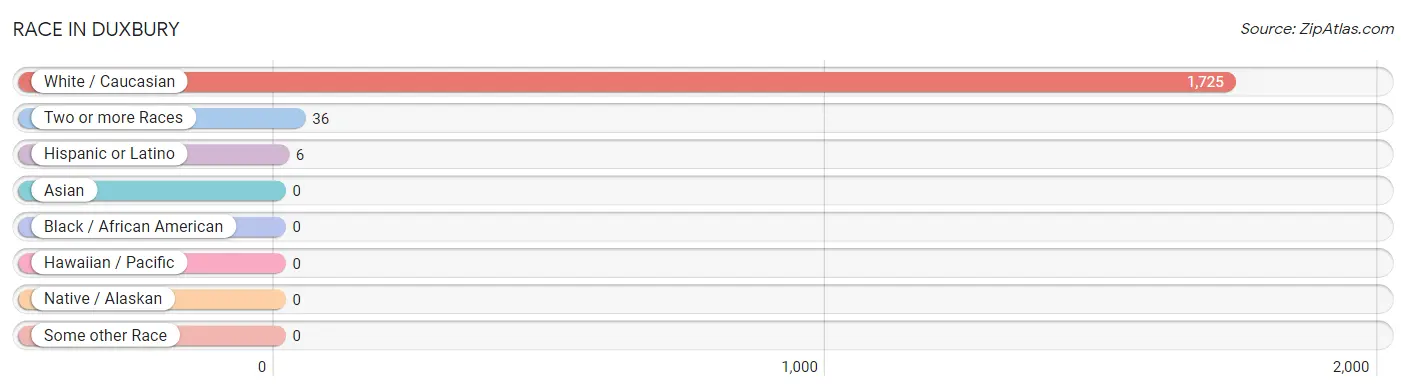
| Race | # Population | % Population |
| Asian | 0 | 0.0% |
| Black / African American | 0 | 0.0% |
| Hawaiian / Pacific | 0 | 0.0% |
| Hispanic or Latino | 6 | 0.3% |
| Native / Alaskan | 0 | 0.0% |
| White / Caucasian | 1,725 | 98.0% |
| Two or more Races | 36 | 2.0% |
| Some other Race | 0 | 0.0% |
| Total | 1,761 | 100.0% |
Ancestry in Duxbury
The most populous ancestries reported in Duxbury are Irish (763 | 43.3%), English (677 | 38.4%), German (303 | 17.2%), Italian (140 | 8.0%), and Swedish (89 | 5.1%), together accounting for 112.0% of all Duxbury residents.
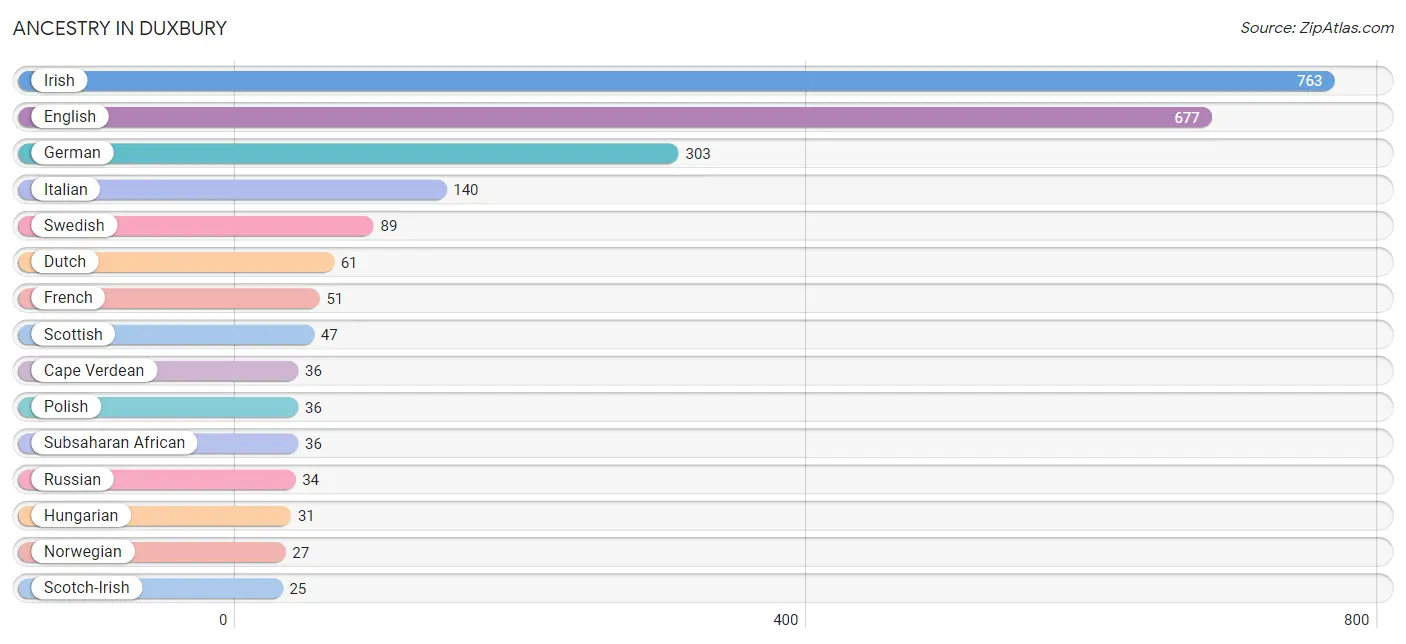
| Ancestry | # Population | % Population |
| American | 17 | 1.0% |
| Canadian | 9 | 0.5% |
| Cape Verdean | 36 | 2.0% |
| Dutch | 61 | 3.5% |
| English | 677 | 38.4% |
| European | 12 | 0.7% |
| French | 51 | 2.9% |
| French Canadian | 9 | 0.5% |
| German | 303 | 17.2% |
| Greek | 10 | 0.6% |
| Hungarian | 31 | 1.8% |
| Irish | 763 | 43.3% |
| Italian | 140 | 8.0% |
| Norwegian | 27 | 1.5% |
| Polish | 36 | 2.0% |
| Portuguese | 8 | 0.4% |
| Russian | 34 | 1.9% |
| Scotch-Irish | 25 | 1.4% |
| Scottish | 47 | 2.7% |
| Slovak | 14 | 0.8% |
| South American | 6 | 0.3% |
| Subsaharan African | 36 | 2.0% |
| Swedish | 89 | 5.1% |
| Venezuelan | 6 | 0.3% | View All 24 Rows |
Immigrants in Duxbury
The most numerous immigrant groups reported in Duxbury came from Europe (31 | 1.8%), France (20 | 1.1%), Western Europe (20 | 1.1%), and Northern Europe (11 | 0.6%), together accounting for 4.7% of all Duxbury residents.
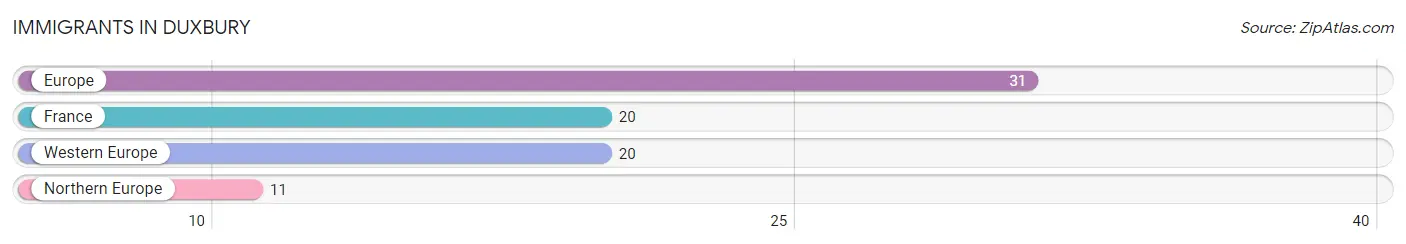
| Immigration Origin | # Population | % Population |
| Europe | 31 | 1.8% |
| France | 20 | 1.1% |
| Northern Europe | 11 | 0.6% |
| Western Europe | 20 | 1.1% | View All 4 Rows |
Sex and Age in Duxbury
Sex and Age in Duxbury
The most populous age groups in Duxbury are 10 to 14 Years (123 | 13.1%) for men and 55 to 59 Years (183 | 22.3%) for women.
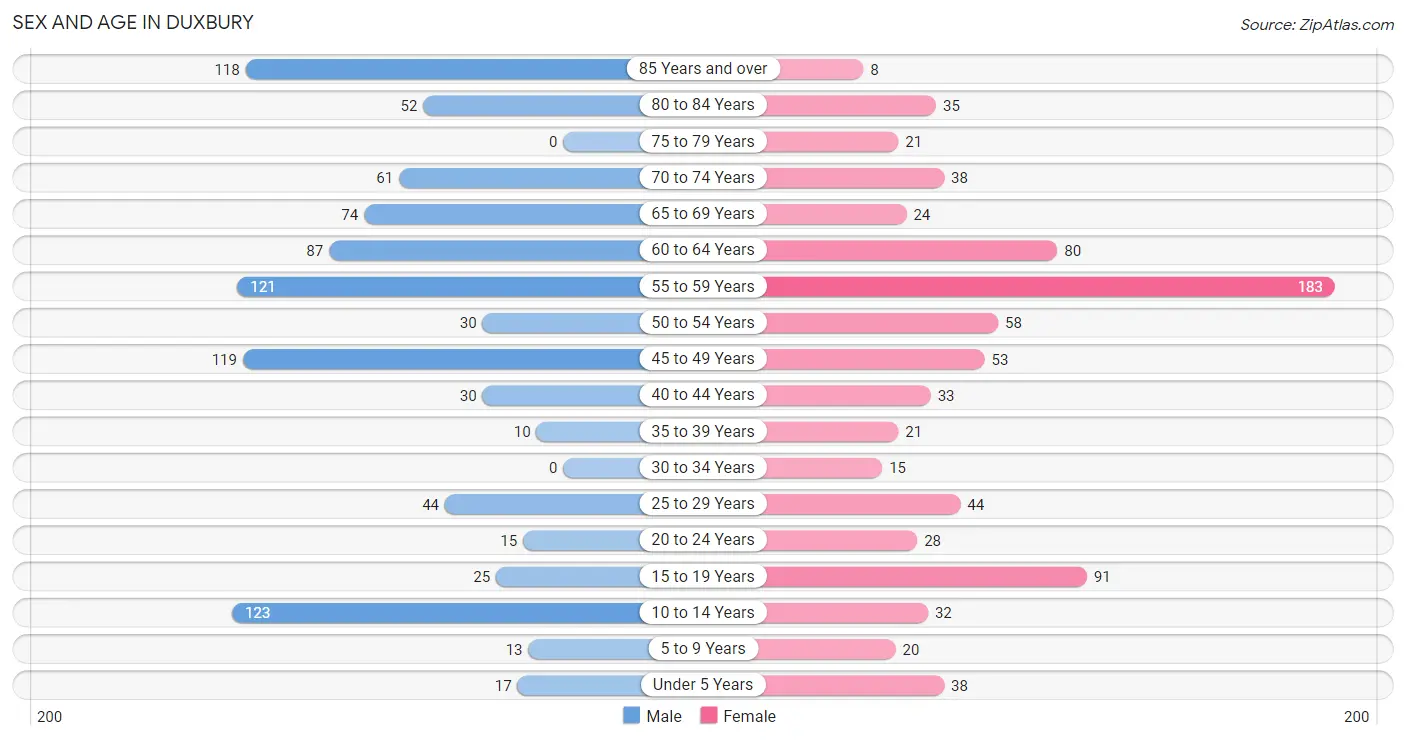
| Age Bracket | Male | Female |
| Under 5 Years | 17 (1.8%) | 38 (4.6%) |
| 5 to 9 Years | 13 (1.4%) | 20 (2.4%) |
| 10 to 14 Years | 123 (13.1%) | 32 (3.9%) |
| 15 to 19 Years | 25 (2.7%) | 91 (11.1%) |
| 20 to 24 Years | 15 (1.6%) | 28 (3.4%) |
| 25 to 29 Years | 44 (4.7%) | 44 (5.3%) |
| 30 to 34 Years | 0 (0.0%) | 15 (1.8%) |
| 35 to 39 Years | 10 (1.1%) | 21 (2.5%) |
| 40 to 44 Years | 30 (3.2%) | 33 (4.0%) |
| 45 to 49 Years | 119 (12.7%) | 53 (6.5%) |
| 50 to 54 Years | 30 (3.2%) | 58 (7.1%) |
| 55 to 59 Years | 121 (12.9%) | 183 (22.3%) |
| 60 to 64 Years | 87 (9.3%) | 80 (9.7%) |
| 65 to 69 Years | 74 (7.9%) | 24 (2.9%) |
| 70 to 74 Years | 61 (6.5%) | 38 (4.6%) |
| 75 to 79 Years | 0 (0.0%) | 21 (2.5%) |
| 80 to 84 Years | 52 (5.5%) | 35 (4.3%) |
| 85 Years and over | 118 (12.6%) | 8 (1.0%) |
| Total | 939 (100.0%) | 822 (100.0%) |
Families and Households in Duxbury
Median Family Size in Duxbury
The median family size in Duxbury is 2.99 persons per family, with single male/father families (11 | 2.2%) accounting for the largest median family size of 3.18 persons per family. On the other hand, single female/mother families (15 | 2.9%) represent the smallest median family size with 2.13 persons per family.
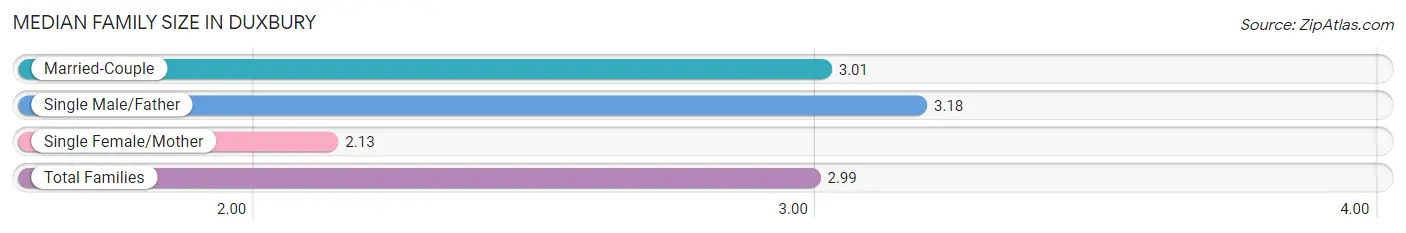
| Family Type | # Families | Family Size |
| Married-Couple | 483 (94.9%) | 3.01 |
| Single Male/Father | 11 (2.2%) | 3.18 |
| Single Female/Mother | 15 (2.9%) | 2.13 |
| Total Families | 509 (100.0%) | 2.99 |
Median Household Size in Duxbury
The median household size in Duxbury is 2.41 persons per household, with single male/father households (11 | 1.5%) accounting for the largest median household size of 3.18 persons per household. non-family households (223 | 30.5%) represent the smallest median household size with 1.08 persons per household.
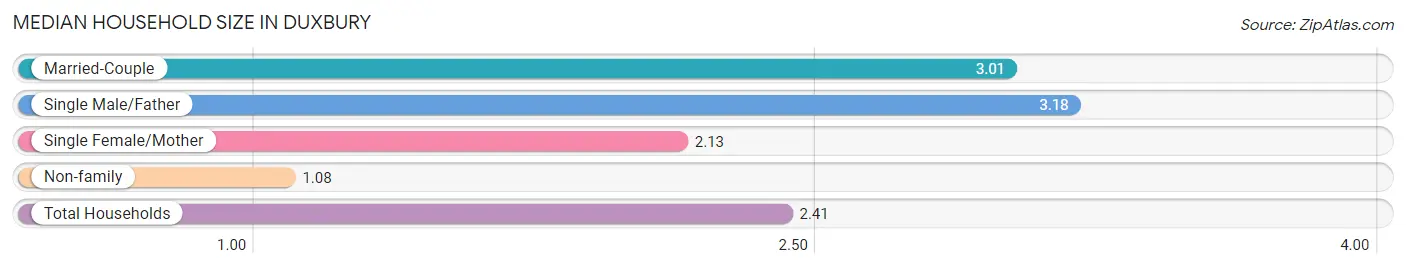
| Household Type | # Households | Household Size |
| Married-Couple | 483 (66.0%) | 3.01 |
| Single Male/Father | 11 (1.5%) | 3.18 |
| Single Female/Mother | 15 (2.1%) | 2.13 |
| Non-family | 223 (30.5%) | 1.08 |
| Total Households | 732 (100.0%) | 2.41 |
Household Size by Marriage Status in Duxbury
Out of a total of 732 households in Duxbury, 509 (69.5%) are family households, while 223 (30.5%) are nonfamily households. The most numerous type of family households are 2-person households, comprising 289, and the most common type of nonfamily households are 1-person households, comprising 203.
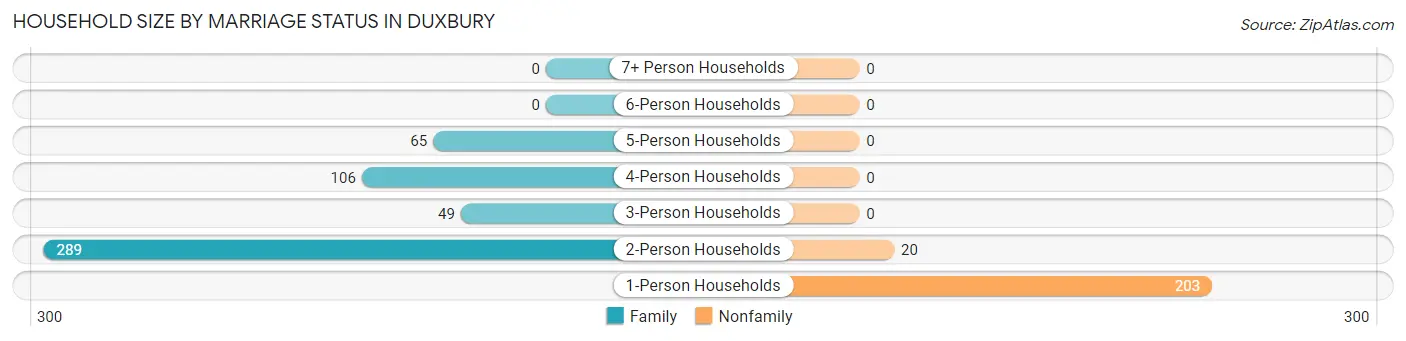
| Household Size | Family Households | Nonfamily Households |
| 1-Person Households | - | 203 (27.7%) |
| 2-Person Households | 289 (39.5%) | 20 (2.7%) |
| 3-Person Households | 49 (6.7%) | 0 (0.0%) |
| 4-Person Households | 106 (14.5%) | 0 (0.0%) |
| 5-Person Households | 65 (8.9%) | 0 (0.0%) |
| 6-Person Households | 0 (0.0%) | 0 (0.0%) |
| 7+ Person Households | 0 (0.0%) | 0 (0.0%) |
| Total | 509 (69.5%) | 223 (30.5%) |
Female Fertility in Duxbury
Fertility by Age in Duxbury
| Age Bracket | Women with Births | Births / 1,000 Women |
| 15 to 19 years | 0 (0.0%) | 0.0 |
| 20 to 34 years | 0 (0.0%) | 0.0 |
| 35 to 50 years | 0 (0.0%) | 0.0 |
| Total | 0 (0.0%) | 0.0 |
Fertility by Age by Marriage Status in Duxbury
| Age Bracket | Married | Unmarried |
| 15 to 19 years | 0 (0.0%) | 0 (0.0%) |
| 20 to 34 years | 0 (0.0%) | 0 (0.0%) |
| 35 to 50 years | 0 (0.0%) | 0 (0.0%) |
| Total | 0 (0.0%) | 0 (0.0%) |
Fertility by Education in Duxbury
| Educational Attainment | Women with Births | Births / 1,000 Women |
| Less than High School | 0 (0.0%) | 0.0 |
| High School Diploma | 0 (0.0%) | 0.0 |
| College or Associate's Degree | 0 (0.0%) | 0.0 |
| Bachelor's Degree | 0 (0.0%) | 0.0 |
| Graduate Degree | 0 (0.0%) | 0.0 |
| Total | 0 (0.0%) | 0.0 |
Fertility by Education by Marriage Status in Duxbury
| Educational Attainment | Married | Unmarried |
| Less than High School | 0 (0.0%) | 0 (0.0%) |
| High School Diploma | 0 (0.0%) | 0 (0.0%) |
| College or Associate's Degree | 0 (0.0%) | 0 (0.0%) |
| Bachelor's Degree | 0 (0.0%) | 0 (0.0%) |
| Graduate Degree | 0 (0.0%) | 0 (0.0%) |
| Total | 0 (0.0%) | 0 (0.0%) |
Employment Characteristics in Duxbury
Employment by Class of Employer in Duxbury
Among the 998 employed individuals in Duxbury, private company employees (626 | 62.7%), self-employed (incorporated) (187 | 18.7%), and self-employed (not incorporated) (104 | 10.4%) make up the most common classes of employment.
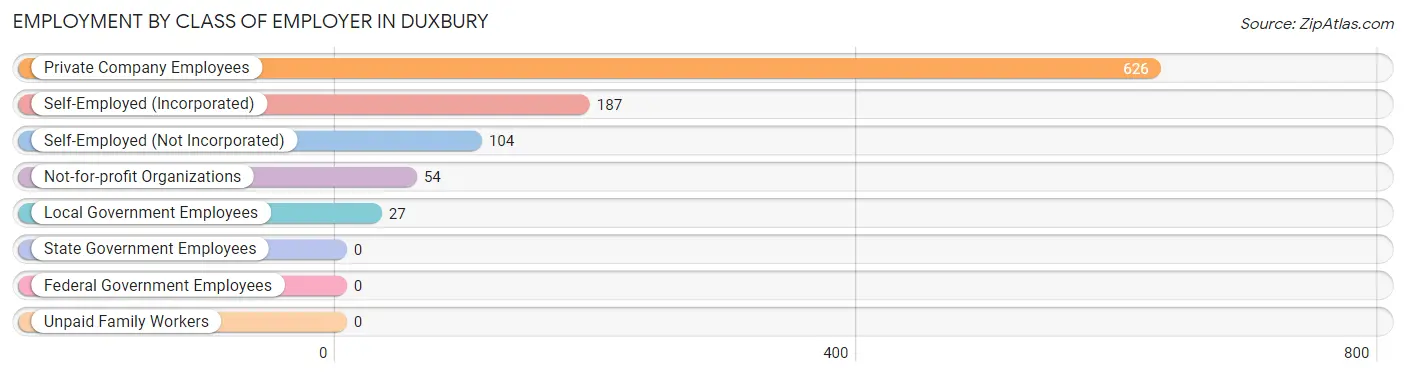
| Employer Class | # Employees | % Employees |
| Private Company Employees | 626 | 62.7% |
| Self-Employed (Incorporated) | 187 | 18.7% |
| Self-Employed (Not Incorporated) | 104 | 10.4% |
| Not-for-profit Organizations | 54 | 5.4% |
| Local Government Employees | 27 | 2.7% |
| State Government Employees | 0 | 0.0% |
| Federal Government Employees | 0 | 0.0% |
| Unpaid Family Workers | 0 | 0.0% |
| Total | 998 | 100.0% |
Employment Status by Age in Duxbury
According to the labor force statistics for Duxbury, out of the total population over 16 years of age (1,485), 71.2% or 1,057 individuals are in the labor force, with 5.6% or 59 of them unemployed. The age group with the highest labor force participation rate is 20 to 24 years, with 100.0% or 43 individuals in the labor force. Within the labor force, the 16 to 19 years age range has the highest percentage of unemployed individuals, with 19.5% or 8 of them being unemployed.
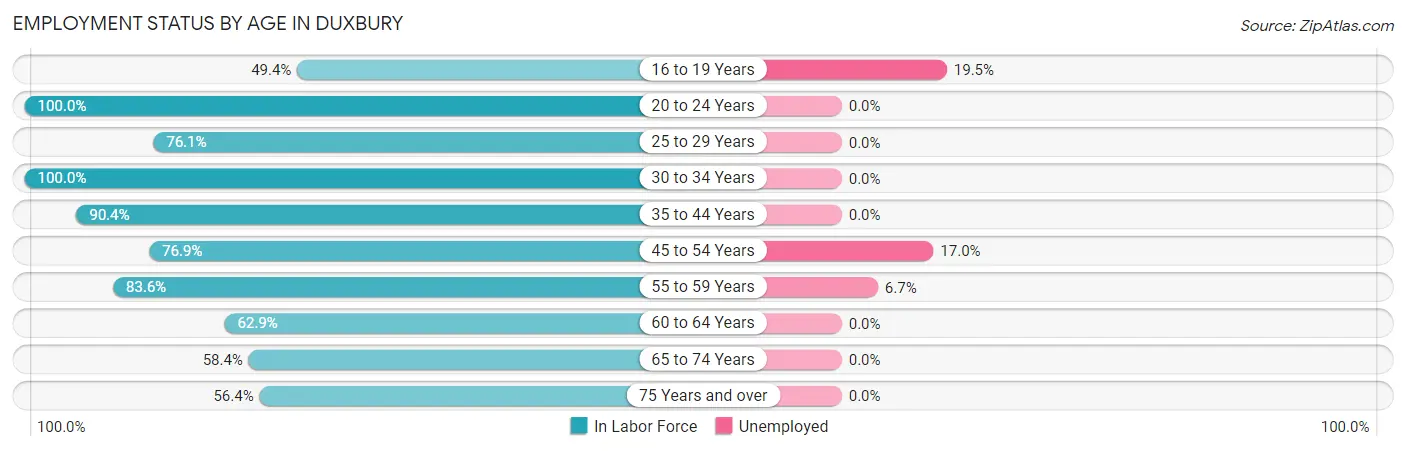
| Age Bracket | In Labor Force | Unemployed |
| 16 to 19 Years | 41 (49.4%) | 8 (19.5%) |
| 20 to 24 Years | 43 (100.0%) | 0 (0.0%) |
| 25 to 29 Years | 67 (76.1%) | 0 (0.0%) |
| 30 to 34 Years | 15 (100.0%) | 0 (0.0%) |
| 35 to 44 Years | 85 (90.4%) | 0 (0.0%) |
| 45 to 54 Years | 200 (76.9%) | 34 (17.0%) |
| 55 to 59 Years | 254 (83.6%) | 17 (6.7%) |
| 60 to 64 Years | 105 (62.9%) | 0 (0.0%) |
| 65 to 74 Years | 115 (58.4%) | 0 (0.0%) |
| 75 Years and over | 132 (56.4%) | 0 (0.0%) |
| Total | 1,057 (71.2%) | 59 (5.6%) |
Employment Status by Educational Attainment in Duxbury
According to labor force statistics for Duxbury, 78.2% of individuals (726) out of the total population between 25 and 64 years of age (928) are in the labor force, with 7.0% or 51 of them being unemployed. The group with the highest labor force participation rate are those with the educational attainment of less than high school, with 100.0% or 20 individuals in the labor force. Within the labor force, individuals with high school diploma education have the highest percentage of unemployment, with 32.1% or 17 of them being unemployed.
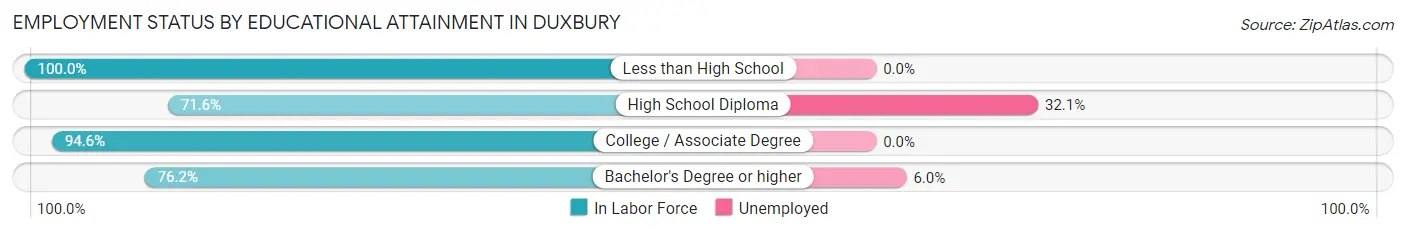
| Educational Attainment | In Labor Force | Unemployed |
| Less than High School | 20 (100.0%) | 0 (0.0%) |
| High School Diploma | 53 (71.6%) | 24 (32.1%) |
| College / Associate Degree | 88 (94.6%) | 0 (0.0%) |
| Bachelor's Degree or higher | 565 (76.2%) | 44 (6.0%) |
| Total | 726 (78.2%) | 65 (7.0%) |
Employment Occupations by Sex in Duxbury
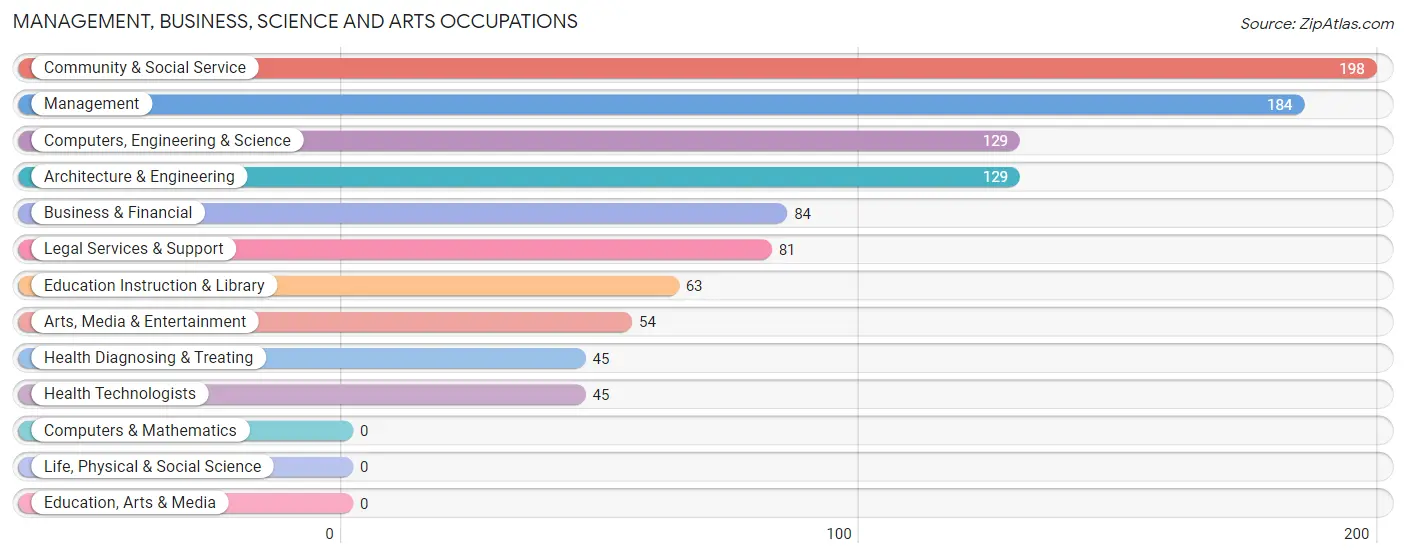
Management, Business, Science and Arts Occupations
The most common Management, Business, Science and Arts occupations in Duxbury are Community & Social Service (198 | 19.8%), Management (184 | 18.4%), Computers, Engineering & Science (129 | 12.9%), Architecture & Engineering (129 | 12.9%), and Business & Financial (84 | 8.4%).
Management, Business, Science and Arts Occupations by Sex
Within the Management, Business, Science and Arts occupations in Duxbury, the most male-oriented occupations are Business & Financial (100.0%), Computers, Engineering & Science (91.5%), and Architecture & Engineering (91.5%), while the most female-oriented occupations are Health Diagnosing & Treating (71.1%), Health Technologists (71.1%), and Education Instruction & Library (66.7%).
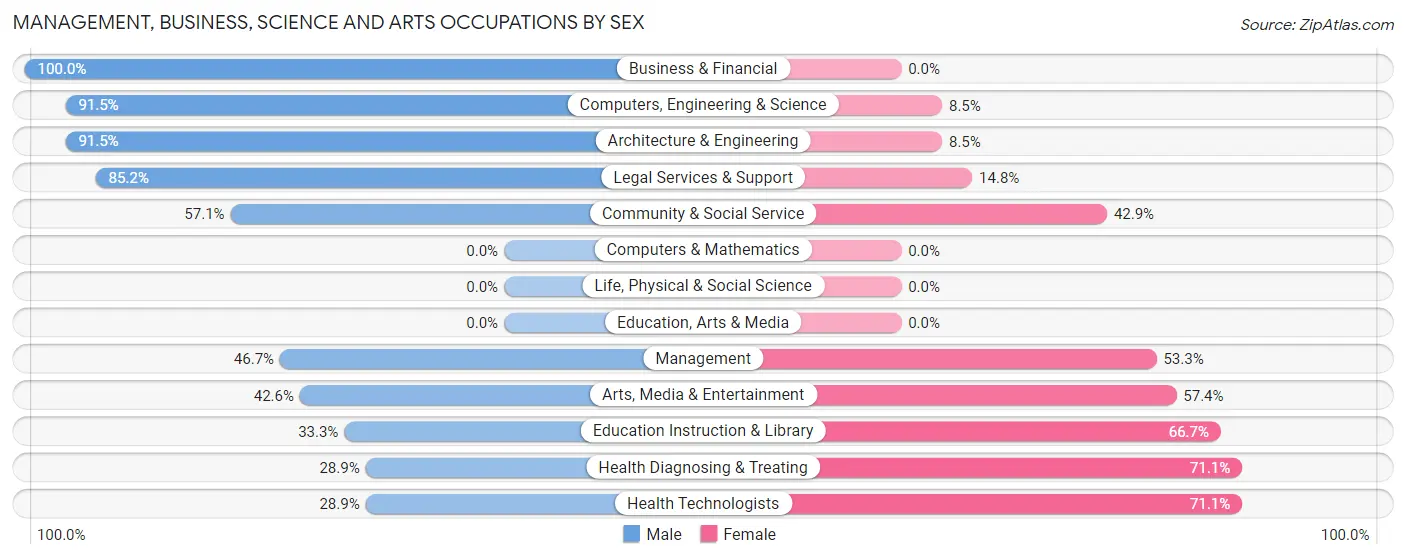
| Occupation | Male | Female |
| Management | 86 (46.7%) | 98 (53.3%) |
| Business & Financial | 84 (100.0%) | 0 (0.0%) |
| Computers, Engineering & Science | 118 (91.5%) | 11 (8.5%) |
| Computers & Mathematics | 0 (0.0%) | 0 (0.0%) |
| Architecture & Engineering | 118 (91.5%) | 11 (8.5%) |
| Life, Physical & Social Science | 0 (0.0%) | 0 (0.0%) |
| Community & Social Service | 113 (57.1%) | 85 (42.9%) |
| Education, Arts & Media | 0 (0.0%) | 0 (0.0%) |
| Legal Services & Support | 69 (85.2%) | 12 (14.8%) |
| Education Instruction & Library | 21 (33.3%) | 42 (66.7%) |
| Arts, Media & Entertainment | 23 (42.6%) | 31 (57.4%) |
| Health Diagnosing & Treating | 13 (28.9%) | 32 (71.1%) |
| Health Technologists | 13 (28.9%) | 32 (71.1%) |
| Total (Category) | 414 (64.7%) | 226 (35.3%) |
| Total (Overall) | 640 (64.1%) | 358 (35.9%) |
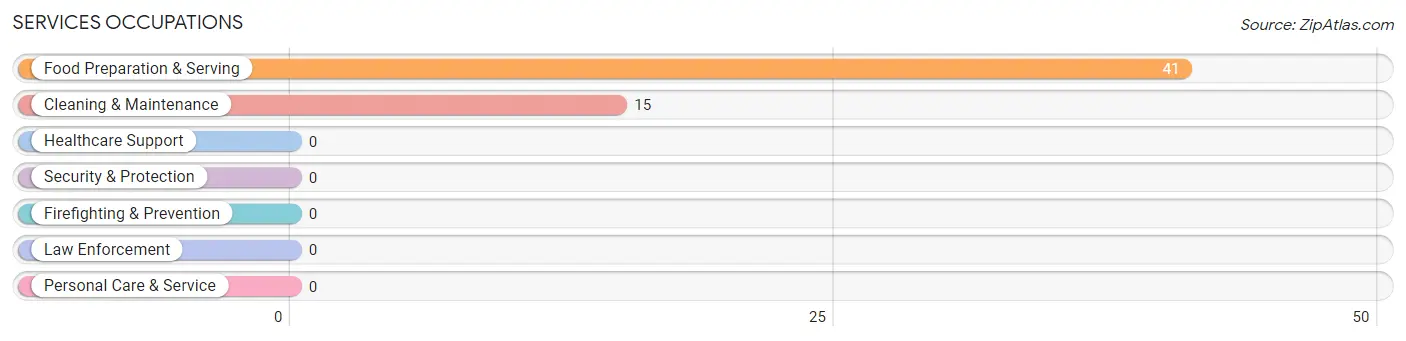
Services Occupations
The most common Services occupations in Duxbury are Food Preparation & Serving (41 | 4.1%), and Cleaning & Maintenance (15 | 1.5%).
Services Occupations by Sex
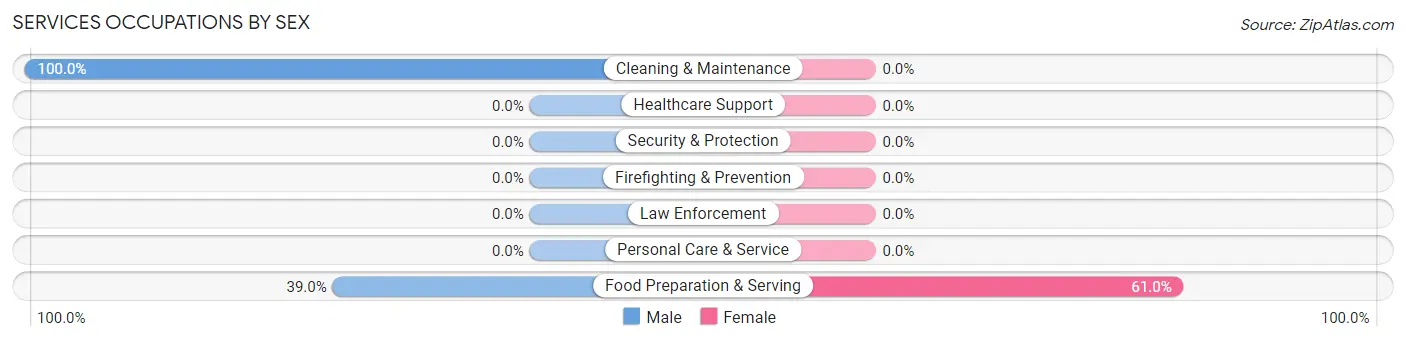
| Occupation | Male | Female |
| Healthcare Support | 0 (0.0%) | 0 (0.0%) |
| Security & Protection | 0 (0.0%) | 0 (0.0%) |
| Firefighting & Prevention | 0 (0.0%) | 0 (0.0%) |
| Law Enforcement | 0 (0.0%) | 0 (0.0%) |
| Food Preparation & Serving | 16 (39.0%) | 25 (61.0%) |
| Cleaning & Maintenance | 15 (100.0%) | 0 (0.0%) |
| Personal Care & Service | 0 (0.0%) | 0 (0.0%) |
| Total (Category) | 31 (55.4%) | 25 (44.6%) |
| Total (Overall) | 640 (64.1%) | 358 (35.9%) |
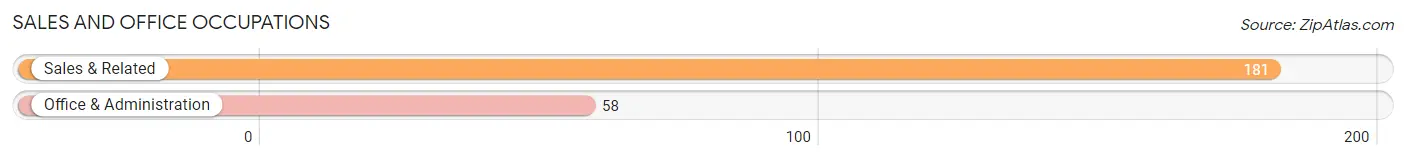
Sales and Office Occupations
The most common Sales and Office occupations in Duxbury are Sales & Related (181 | 18.1%), and Office & Administration (58 | 5.8%).
Sales and Office Occupations by Sex
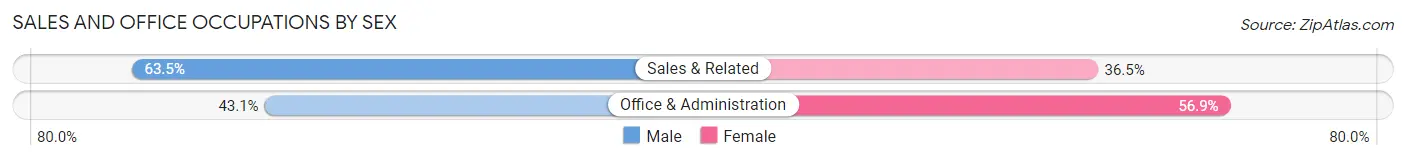
| Occupation | Male | Female |
| Sales & Related | 115 (63.5%) | 66 (36.5%) |
| Office & Administration | 25 (43.1%) | 33 (56.9%) |
| Total (Category) | 140 (58.6%) | 99 (41.4%) |
| Total (Overall) | 640 (64.1%) | 358 (35.9%) |
Natural Resources, Construction and Maintenance Occupations
Natural Resources, Construction and Maintenance Occupations by Sex
| Occupation | Male | Female |
| Farming, Fishing & Forestry | 0 (0.0%) | 0 (0.0%) |
| Construction & Extraction | 0 (0.0%) | 0 (0.0%) |
| Installation, Maintenance & Repair | 0 (0.0%) | 0 (0.0%) |
| Total (Category) | 0 (0.0%) | 0 (0.0%) |
| Total (Overall) | 640 (64.1%) | 358 (35.9%) |
Production, Transportation and Moving Occupations
The most common Production, Transportation and Moving occupations in Duxbury are Production (55 | 5.5%), and Material Moving (8 | 0.8%).
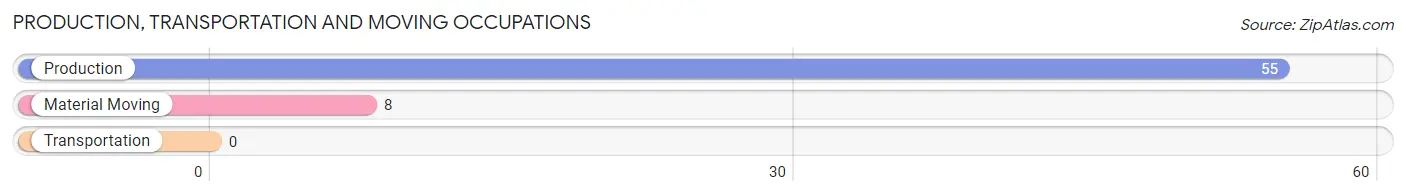
Production, Transportation and Moving Occupations by Sex
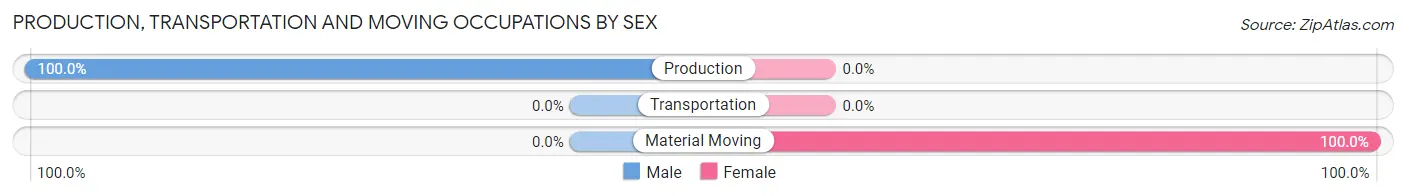
| Occupation | Male | Female |
| Production | 55 (100.0%) | 0 (0.0%) |
| Transportation | 0 (0.0%) | 0 (0.0%) |
| Material Moving | 0 (0.0%) | 8 (100.0%) |
| Total (Category) | 55 (87.3%) | 8 (12.7%) |
| Total (Overall) | 640 (64.1%) | 358 (35.9%) |
Employment Industries by Sex in Duxbury
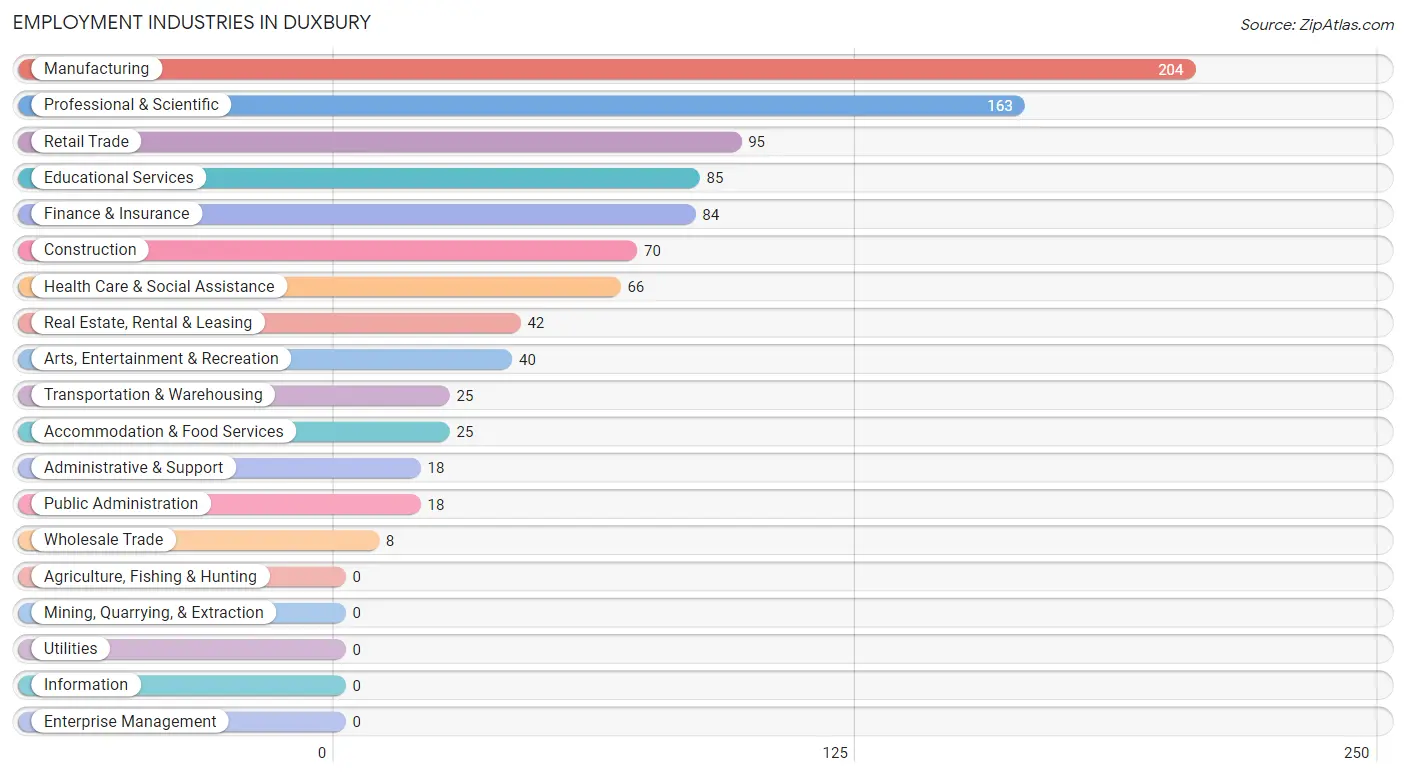
Employment Industries in Duxbury
The major employment industries in Duxbury include Manufacturing (204 | 20.4%), Professional & Scientific (163 | 16.3%), Retail Trade (95 | 9.5%), Educational Services (85 | 8.5%), and Finance & Insurance (84 | 8.4%).
Employment Industries by Sex in Duxbury
The Duxbury industries that see more men than women are Wholesale Trade (100.0%), Transportation & Warehousing (100.0%), and Finance & Insurance (100.0%), whereas the industries that tend to have a higher number of women are Health Care & Social Assistance (80.3%), Educational Services (75.3%), and Arts, Entertainment & Recreation (62.5%).
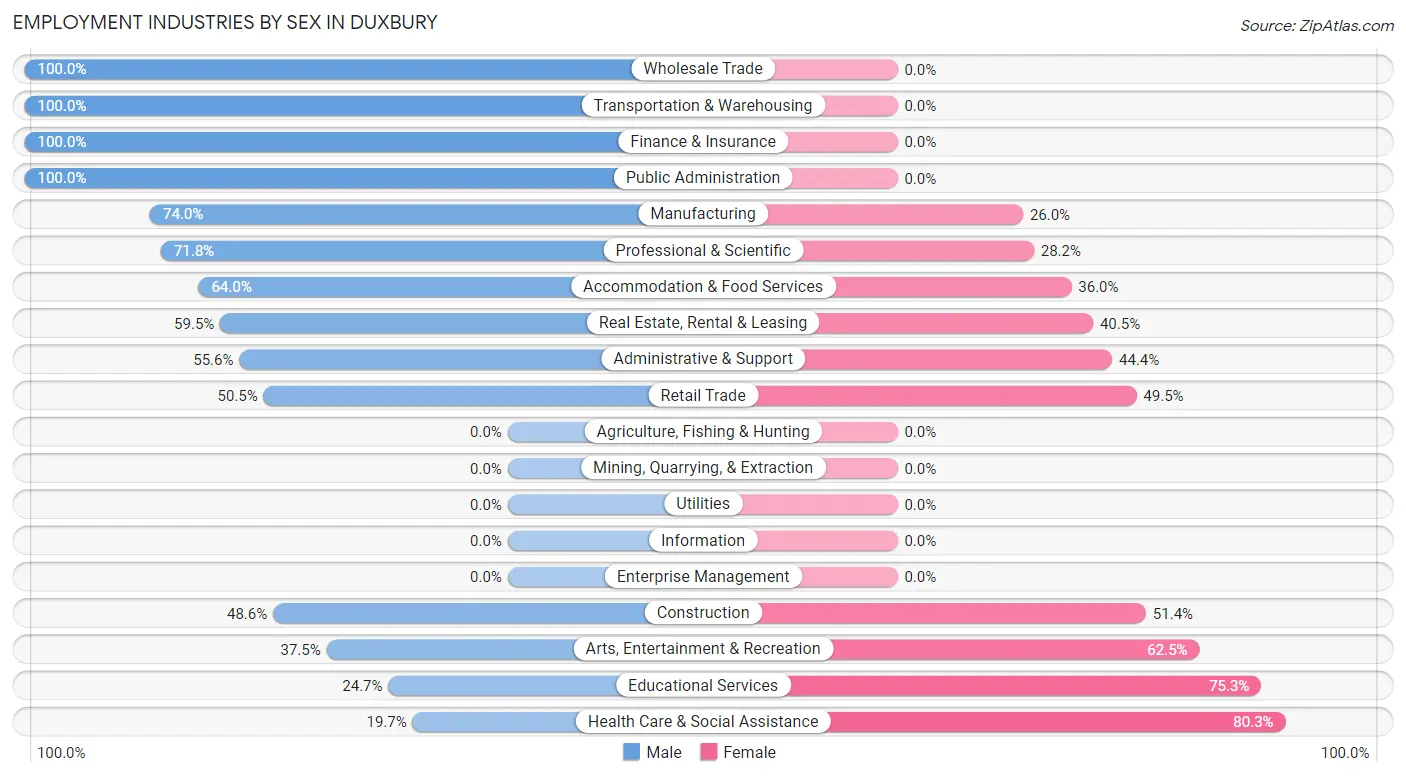
| Industry | Male | Female |
| Agriculture, Fishing & Hunting | 0 (0.0%) | 0 (0.0%) |
| Mining, Quarrying, & Extraction | 0 (0.0%) | 0 (0.0%) |
| Construction | 34 (48.6%) | 36 (51.4%) |
| Manufacturing | 151 (74.0%) | 53 (26.0%) |
| Wholesale Trade | 8 (100.0%) | 0 (0.0%) |
| Retail Trade | 48 (50.5%) | 47 (49.5%) |
| Transportation & Warehousing | 25 (100.0%) | 0 (0.0%) |
| Utilities | 0 (0.0%) | 0 (0.0%) |
| Information | 0 (0.0%) | 0 (0.0%) |
| Finance & Insurance | 84 (100.0%) | 0 (0.0%) |
| Real Estate, Rental & Leasing | 25 (59.5%) | 17 (40.5%) |
| Professional & Scientific | 117 (71.8%) | 46 (28.2%) |
| Enterprise Management | 0 (0.0%) | 0 (0.0%) |
| Administrative & Support | 10 (55.6%) | 8 (44.4%) |
| Educational Services | 21 (24.7%) | 64 (75.3%) |
| Health Care & Social Assistance | 13 (19.7%) | 53 (80.3%) |
| Arts, Entertainment & Recreation | 15 (37.5%) | 25 (62.5%) |
| Accommodation & Food Services | 16 (64.0%) | 9 (36.0%) |
| Public Administration | 18 (100.0%) | 0 (0.0%) |
| Total | 640 (64.1%) | 358 (35.9%) |
Education in Duxbury
School Enrollment in Duxbury
The most common levels of schooling among the 383 students in Duxbury are high school (134 | 35.0%), middle school (114 | 29.8%), and college / undergraduate (59 | 15.4%).
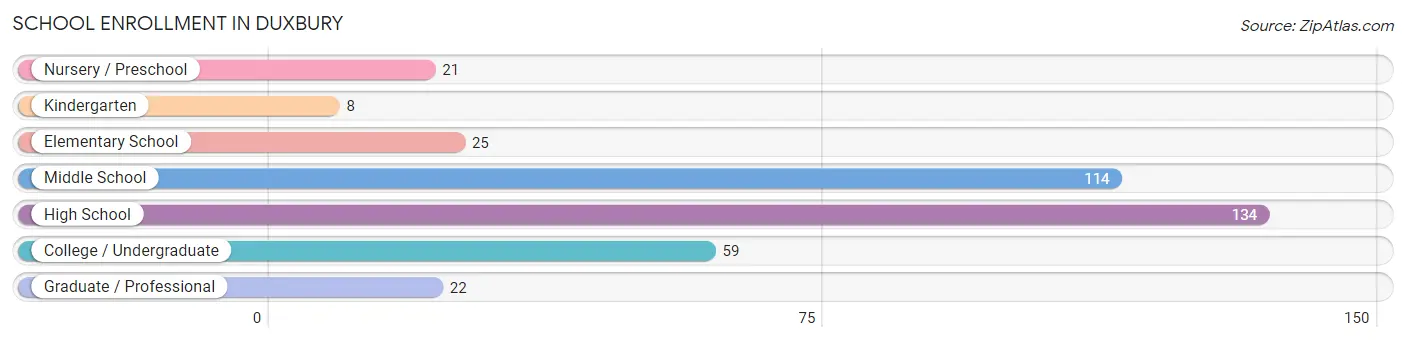
| School Level | # Students | % Students |
| Nursery / Preschool | 21 | 5.5% |
| Kindergarten | 8 | 2.1% |
| Elementary School | 25 | 6.5% |
| Middle School | 114 | 29.8% |
| High School | 134 | 35.0% |
| College / Undergraduate | 59 | 15.4% |
| Graduate / Professional | 22 | 5.7% |
| Total | 383 | 100.0% |
School Enrollment by Age by Funding Source in Duxbury
Out of a total of 383 students who are enrolled in schools in Duxbury, 89 (23.2%) attend a private institution, while the remaining 294 (76.8%) are enrolled in public schools. The age group of 18 to 19 year olds has the highest likelihood of being enrolled in private schools, with 25 (37.3% in the age bracket) enrolled. Conversely, the age group of 3 to 4 year olds has the lowest likelihood of being enrolled in a private school, with 21 (100.0% in the age bracket) attending a public institution.
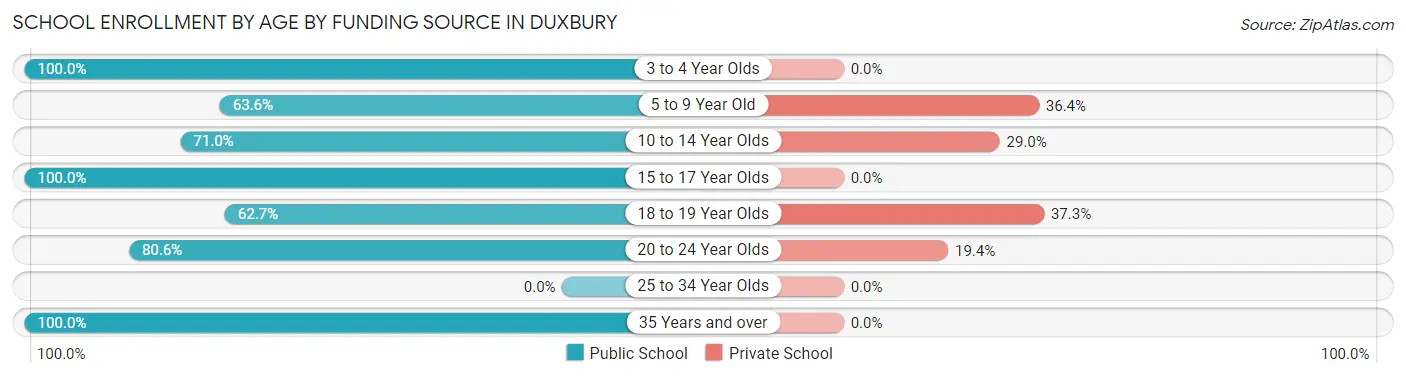
| Age Bracket | Public School | Private School |
| 3 to 4 Year Olds | 21 (100.0%) | 0 (0.0%) |
| 5 to 9 Year Old | 21 (63.6%) | 12 (36.4%) |
| 10 to 14 Year Olds | 110 (71.0%) | 45 (29.0%) |
| 15 to 17 Year Olds | 49 (100.0%) | 0 (0.0%) |
| 18 to 19 Year Olds | 42 (62.7%) | 25 (37.3%) |
| 20 to 24 Year Olds | 29 (80.6%) | 7 (19.4%) |
| 25 to 34 Year Olds | 0 (0.0%) | 0 (0.0%) |
| 35 Years and over | 22 (100.0%) | 0 (0.0%) |
| Total | 294 (76.8%) | 89 (23.2%) |
Educational Attainment by Field of Study in Duxbury
Business (196 | 16.9%), engineering (150 | 12.9%), social sciences (129 | 11.1%), liberal arts & history (123 | 10.6%), and science & technology (115 | 9.9%) are the most common fields of study among 1,161 individuals in Duxbury who have obtained a bachelor's degree or higher.
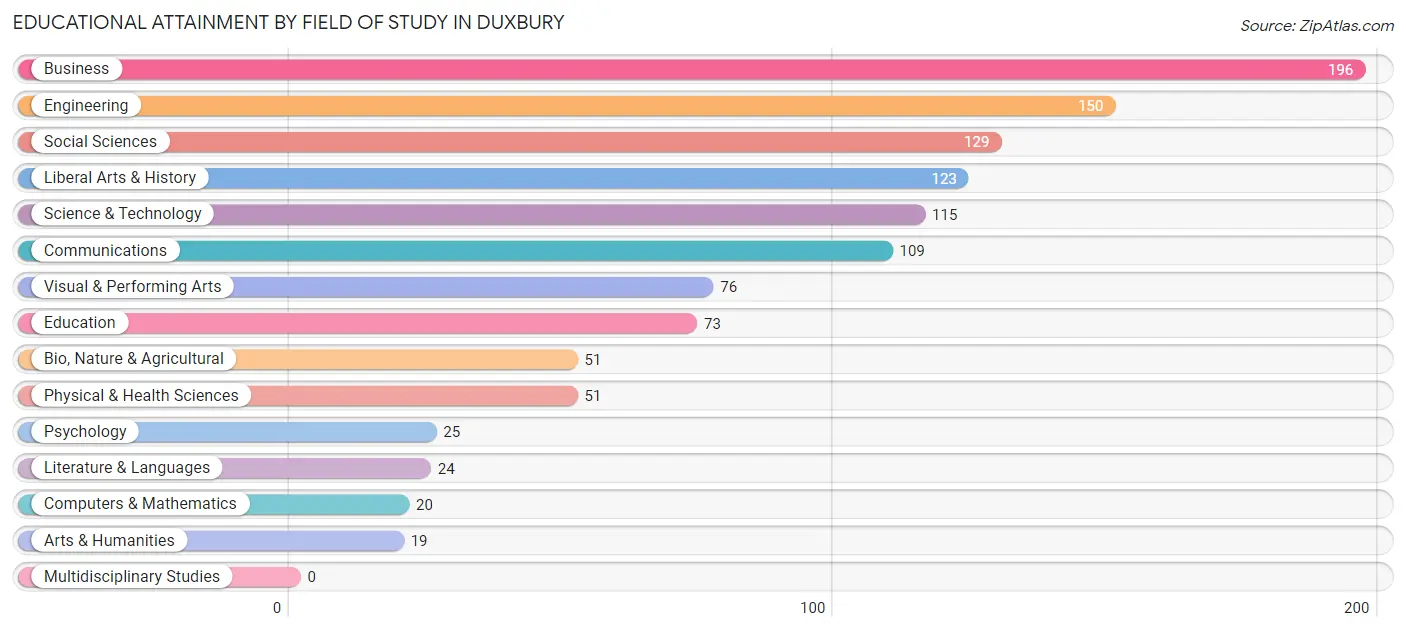
| Field of Study | # Graduates | % Graduates |
| Computers & Mathematics | 20 | 1.7% |
| Bio, Nature & Agricultural | 51 | 4.4% |
| Physical & Health Sciences | 51 | 4.4% |
| Psychology | 25 | 2.1% |
| Social Sciences | 129 | 11.1% |
| Engineering | 150 | 12.9% |
| Multidisciplinary Studies | 0 | 0.0% |
| Science & Technology | 115 | 9.9% |
| Business | 196 | 16.9% |
| Education | 73 | 6.3% |
| Literature & Languages | 24 | 2.1% |
| Liberal Arts & History | 123 | 10.6% |
| Visual & Performing Arts | 76 | 6.6% |
| Communications | 109 | 9.4% |
| Arts & Humanities | 19 | 1.6% |
| Total | 1,161 | 100.0% |
Transportation & Commute in Duxbury
Vehicle Availability by Sex in Duxbury
The most prevalent vehicle ownership categories in Duxbury are males with 2 vehicles (295, accounting for 46.1%) and females with 2 vehicles (110, making up 82.4%).
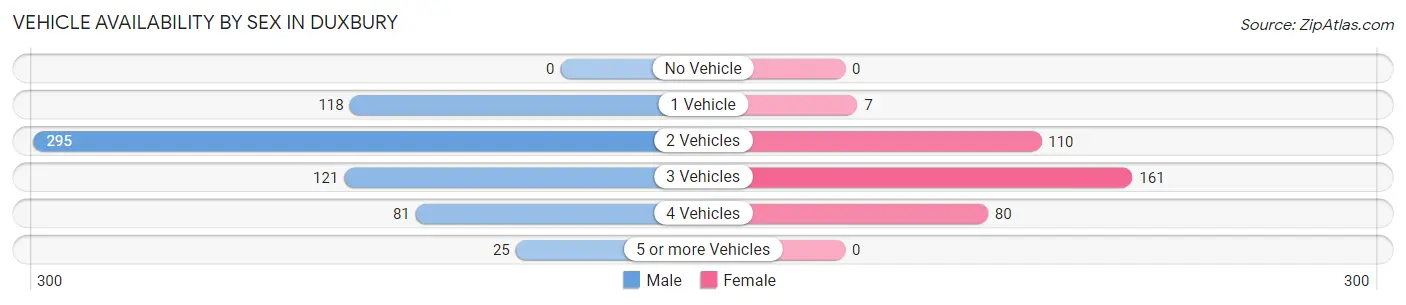
| Vehicles Available | Male | Female |
| No Vehicle | 0 (0.0%) | 0 (0.0%) |
| 1 Vehicle | 118 (18.4%) | 7 (2.0%) |
| 2 Vehicles | 295 (46.1%) | 110 (30.7%) |
| 3 Vehicles | 121 (18.9%) | 161 (45.0%) |
| 4 Vehicles | 81 (12.7%) | 80 (22.4%) |
| 5 or more Vehicles | 25 (3.9%) | 0 (0.0%) |
| Total | 640 (100.0%) | 358 (100.0%) |
Commute Time in Duxbury
The most frequently occuring commute durations in Duxbury are 90 or more minutes (168 commuters, 21.3%), 20 to 24 minutes (132 commuters, 16.7%), and 5 to 9 minutes (127 commuters, 16.1%).
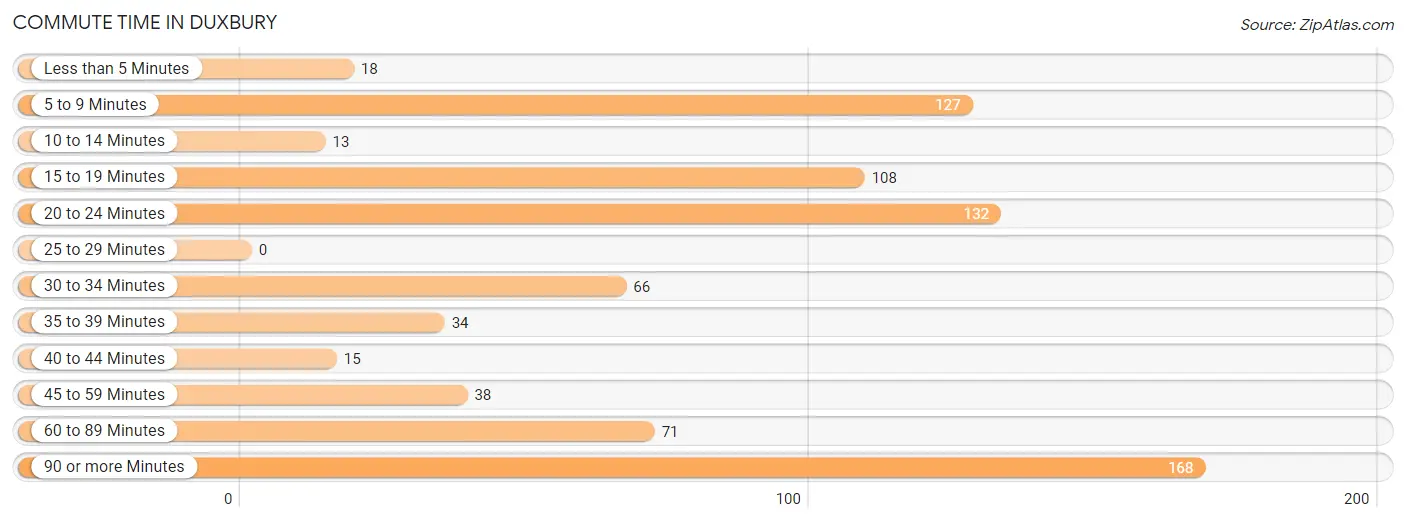
| Commute Time | # Commuters | % Commuters |
| Less than 5 Minutes | 18 | 2.3% |
| 5 to 9 Minutes | 127 | 16.1% |
| 10 to 14 Minutes | 13 | 1.7% |
| 15 to 19 Minutes | 108 | 13.7% |
| 20 to 24 Minutes | 132 | 16.7% |
| 25 to 29 Minutes | 0 | 0.0% |
| 30 to 34 Minutes | 66 | 8.4% |
| 35 to 39 Minutes | 34 | 4.3% |
| 40 to 44 Minutes | 15 | 1.9% |
| 45 to 59 Minutes | 38 | 4.8% |
| 60 to 89 Minutes | 71 | 9.0% |
| 90 or more Minutes | 168 | 21.3% |
Commute Time by Sex in Duxbury
The most common commute times in Duxbury are 90 or more minutes (168 commuters, 32.3%) for males and 5 to 9 minutes (74 commuters, 27.5%) for females.
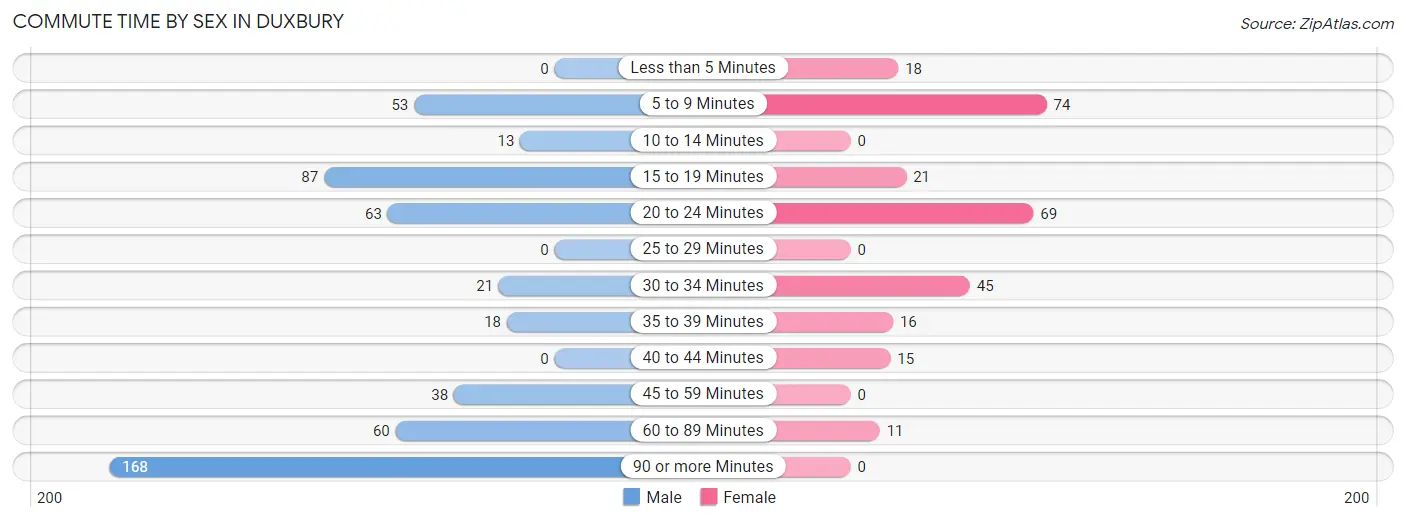
| Commute Time | Male | Female |
| Less than 5 Minutes | 0 (0.0%) | 18 (6.7%) |
| 5 to 9 Minutes | 53 (10.2%) | 74 (27.5%) |
| 10 to 14 Minutes | 13 (2.5%) | 0 (0.0%) |
| 15 to 19 Minutes | 87 (16.7%) | 21 (7.8%) |
| 20 to 24 Minutes | 63 (12.1%) | 69 (25.7%) |
| 25 to 29 Minutes | 0 (0.0%) | 0 (0.0%) |
| 30 to 34 Minutes | 21 (4.0%) | 45 (16.7%) |
| 35 to 39 Minutes | 18 (3.5%) | 16 (5.9%) |
| 40 to 44 Minutes | 0 (0.0%) | 15 (5.6%) |
| 45 to 59 Minutes | 38 (7.3%) | 0 (0.0%) |
| 60 to 89 Minutes | 60 (11.5%) | 11 (4.1%) |
| 90 or more Minutes | 168 (32.3%) | 0 (0.0%) |
Time of Departure to Work by Sex in Duxbury
The most frequent times of departure to work in Duxbury are 12:00 AM to 4:59 AM (134, 25.7%) for males and 9:00 AM to 9:59 AM (123, 45.7%) for females.
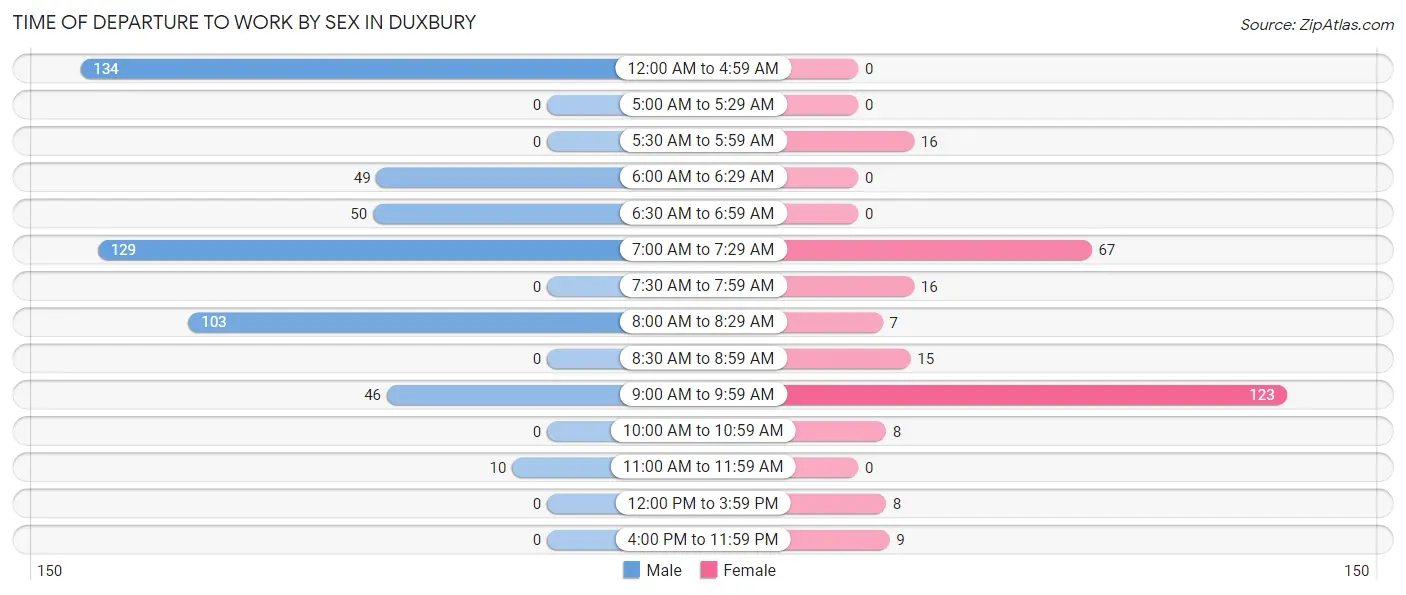
| Time of Departure | Male | Female |
| 12:00 AM to 4:59 AM | 134 (25.7%) | 0 (0.0%) |
| 5:00 AM to 5:29 AM | 0 (0.0%) | 0 (0.0%) |
| 5:30 AM to 5:59 AM | 0 (0.0%) | 16 (5.9%) |
| 6:00 AM to 6:29 AM | 49 (9.4%) | 0 (0.0%) |
| 6:30 AM to 6:59 AM | 50 (9.6%) | 0 (0.0%) |
| 7:00 AM to 7:29 AM | 129 (24.8%) | 67 (24.9%) |
| 7:30 AM to 7:59 AM | 0 (0.0%) | 16 (5.9%) |
| 8:00 AM to 8:29 AM | 103 (19.8%) | 7 (2.6%) |
| 8:30 AM to 8:59 AM | 0 (0.0%) | 15 (5.6%) |
| 9:00 AM to 9:59 AM | 46 (8.8%) | 123 (45.7%) |
| 10:00 AM to 10:59 AM | 0 (0.0%) | 8 (3.0%) |
| 11:00 AM to 11:59 AM | 10 (1.9%) | 0 (0.0%) |
| 12:00 PM to 3:59 PM | 0 (0.0%) | 8 (3.0%) |
| 4:00 PM to 11:59 PM | 0 (0.0%) | 9 (3.4%) |
| Total | 521 (100.0%) | 269 (100.0%) |
Housing Occupancy in Duxbury
Occupancy by Ownership in Duxbury
Of the total 732 dwellings in Duxbury, owner-occupied units account for 715 (97.7%), while renter-occupied units make up 17 (2.3%).
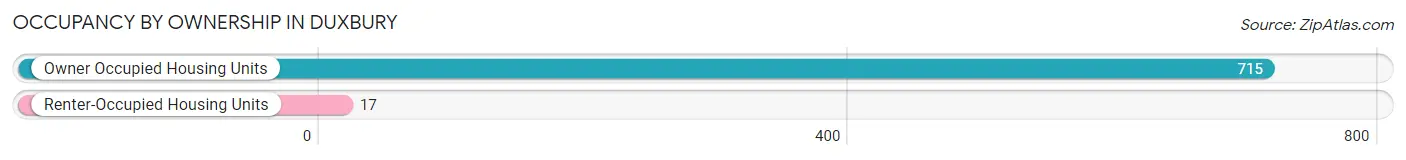
| Occupancy | # Housing Units | % Housing Units |
| Owner Occupied Housing Units | 715 | 97.7% |
| Renter-Occupied Housing Units | 17 | 2.3% |
| Total Occupied Housing Units | 732 | 100.0% |
Occupancy by Household Size in Duxbury
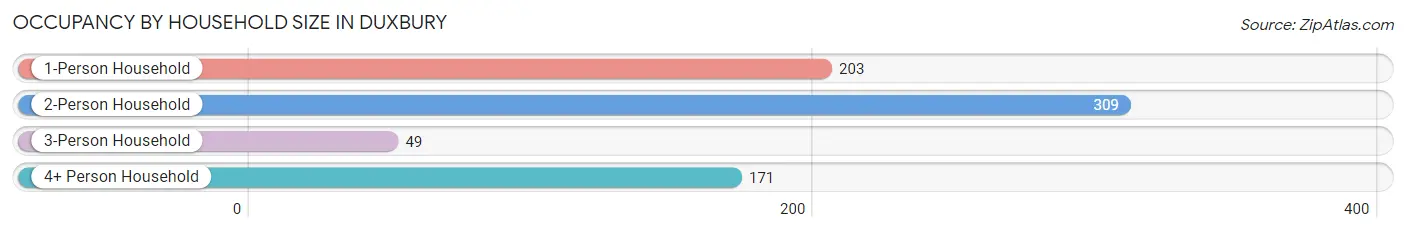
| Household Size | # Housing Units | % Housing Units |
| 1-Person Household | 203 | 27.7% |
| 2-Person Household | 309 | 42.2% |
| 3-Person Household | 49 | 6.7% |
| 4+ Person Household | 171 | 23.4% |
| Total Housing Units | 732 | 100.0% |
Occupancy by Ownership by Household Size in Duxbury
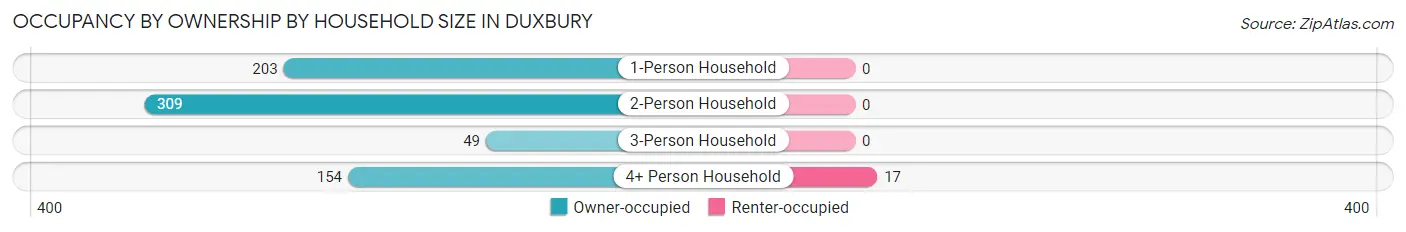
| Household Size | Owner-occupied | Renter-occupied |
| 1-Person Household | 203 (100.0%) | 0 (0.0%) |
| 2-Person Household | 309 (100.0%) | 0 (0.0%) |
| 3-Person Household | 49 (100.0%) | 0 (0.0%) |
| 4+ Person Household | 154 (90.1%) | 17 (9.9%) |
| Total Housing Units | 715 (97.7%) | 17 (2.3%) |
Occupancy by Educational Attainment in Duxbury
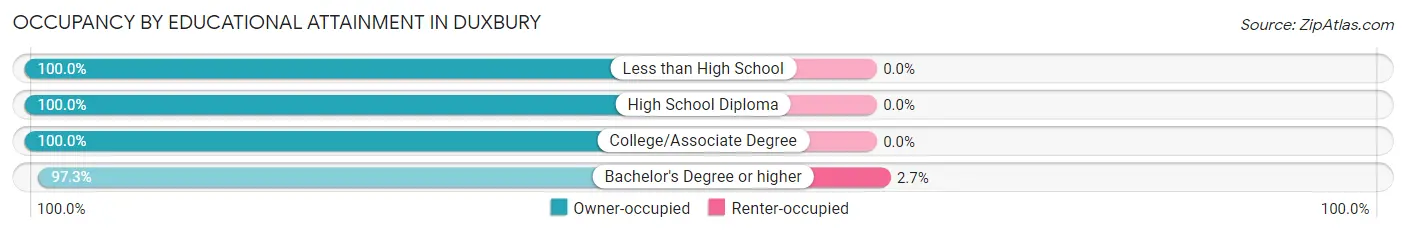
| Household Size | Owner-occupied | Renter-occupied |
| Less than High School | 8 (100.0%) | 0 (0.0%) |
| High School Diploma | 50 (100.0%) | 0 (0.0%) |
| College/Associate Degree | 51 (100.0%) | 0 (0.0%) |
| Bachelor's Degree or higher | 606 (97.3%) | 17 (2.7%) |
Occupancy by Age of Householder in Duxbury
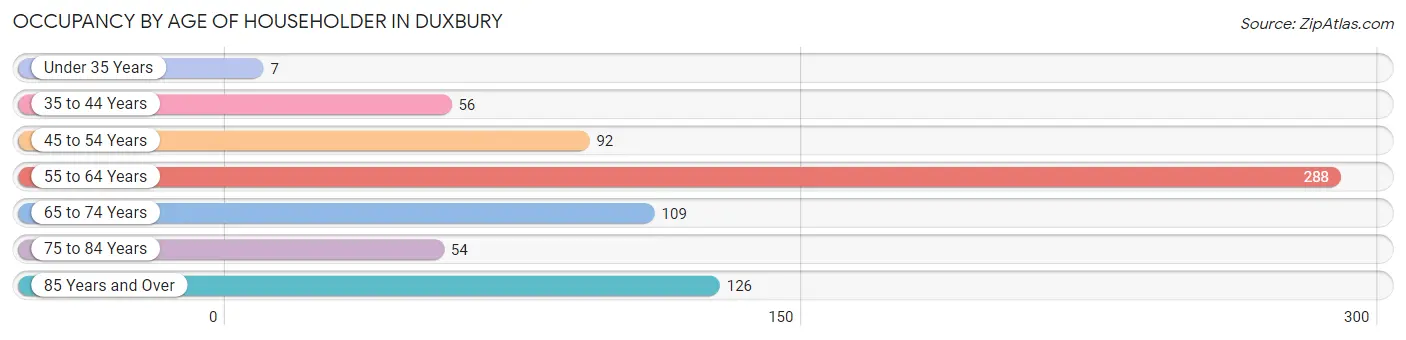
| Age Bracket | # Households | % Households |
| Under 35 Years | 7 | 1.0% |
| 35 to 44 Years | 56 | 7.6% |
| 45 to 54 Years | 92 | 12.6% |
| 55 to 64 Years | 288 | 39.3% |
| 65 to 74 Years | 109 | 14.9% |
| 75 to 84 Years | 54 | 7.4% |
| 85 Years and Over | 126 | 17.2% |
| Total | 732 | 100.0% |
Housing Finances in Duxbury
Median Income by Occupancy in Duxbury
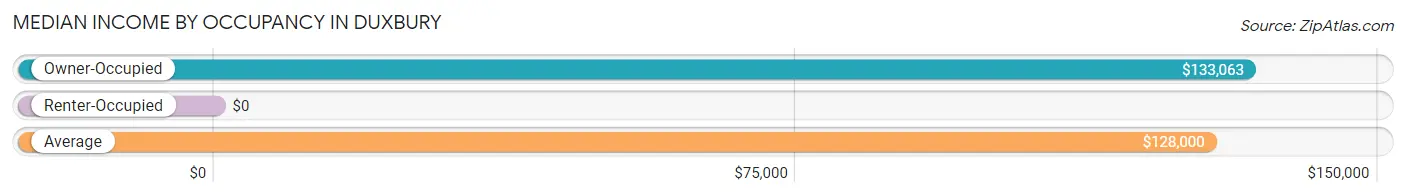
| Occupancy Type | # Households | Median Income |
| Owner-Occupied | 715 (97.7%) | $133,063 |
| Renter-Occupied | 17 (2.3%) | $0 |
| Average | 732 (100.0%) | $128,000 |
Occupancy by Householder Income Bracket in Duxbury
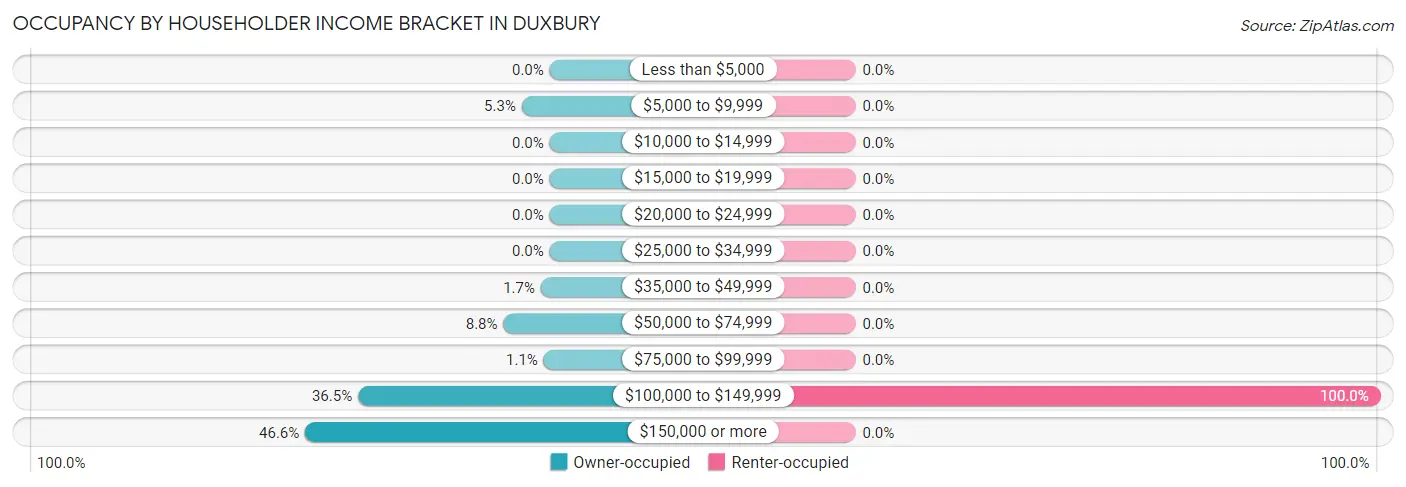
| Income Bracket | Owner-occupied | Renter-occupied |
| Less than $5,000 | 0 (0.0%) | 0 (0.0%) |
| $5,000 to $9,999 | 38 (5.3%) | 0 (0.0%) |
| $10,000 to $14,999 | 0 (0.0%) | 0 (0.0%) |
| $15,000 to $19,999 | 0 (0.0%) | 0 (0.0%) |
| $20,000 to $24,999 | 0 (0.0%) | 0 (0.0%) |
| $25,000 to $34,999 | 0 (0.0%) | 0 (0.0%) |
| $35,000 to $49,999 | 12 (1.7%) | 0 (0.0%) |
| $50,000 to $74,999 | 63 (8.8%) | 0 (0.0%) |
| $75,000 to $99,999 | 8 (1.1%) | 0 (0.0%) |
| $100,000 to $149,999 | 261 (36.5%) | 17 (100.0%) |
| $150,000 or more | 333 (46.6%) | 0 (0.0%) |
| Total | 715 (100.0%) | 17 (100.0%) |
Monthly Housing Cost Tiers in Duxbury
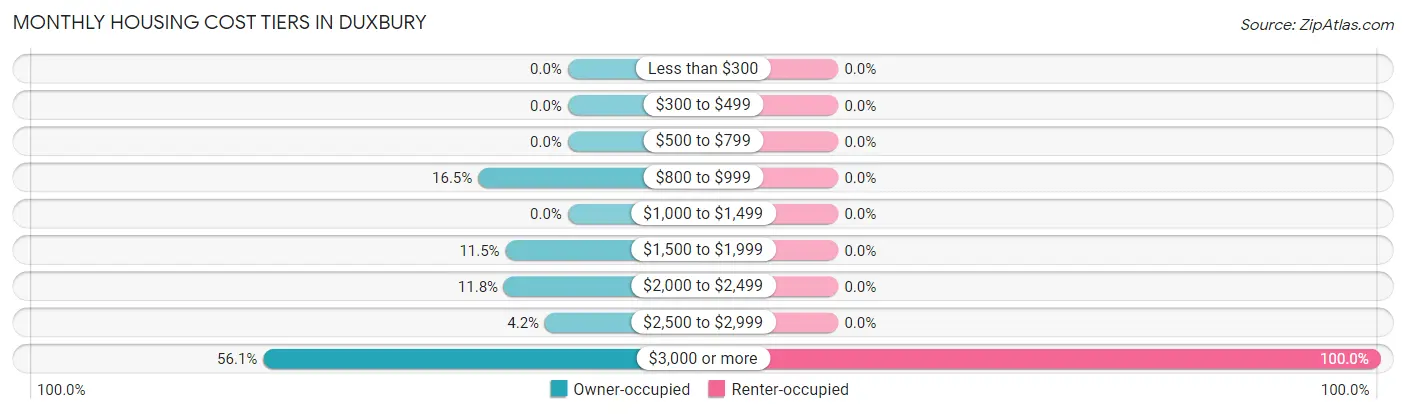
| Monthly Cost | Owner-occupied | Renter-occupied |
| Less than $300 | 0 (0.0%) | 0 (0.0%) |
| $300 to $499 | 0 (0.0%) | 0 (0.0%) |
| $500 to $799 | 0 (0.0%) | 0 (0.0%) |
| $800 to $999 | 118 (16.5%) | 0 (0.0%) |
| $1,000 to $1,499 | 0 (0.0%) | 0 (0.0%) |
| $1,500 to $1,999 | 82 (11.5%) | 0 (0.0%) |
| $2,000 to $2,499 | 84 (11.7%) | 0 (0.0%) |
| $2,500 to $2,999 | 30 (4.2%) | 0 (0.0%) |
| $3,000 or more | 401 (56.1%) | 17 (100.0%) |
| Total | 715 (100.0%) | 17 (100.0%) |
Physical Housing Characteristics in Duxbury
Housing Structures in Duxbury
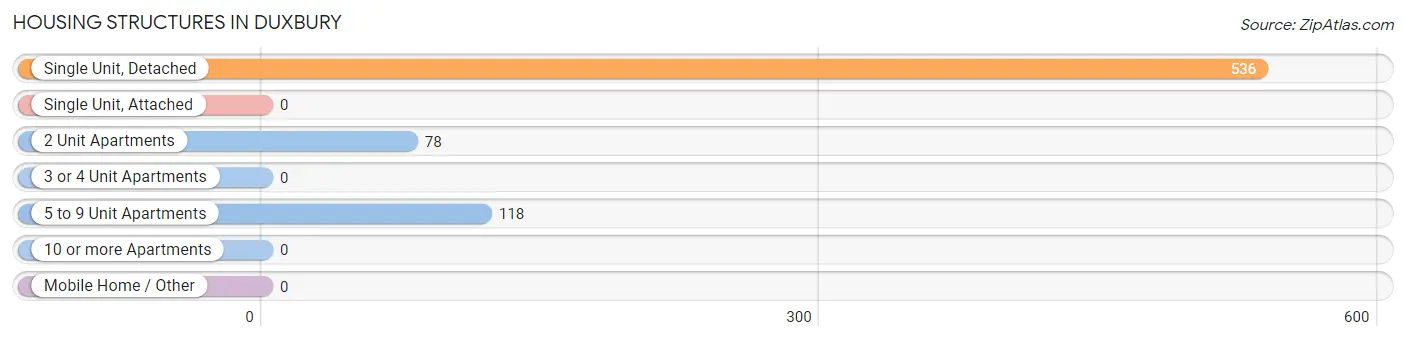
| Structure Type | # Housing Units | % Housing Units |
| Single Unit, Detached | 536 | 73.2% |
| Single Unit, Attached | 0 | 0.0% |
| 2 Unit Apartments | 78 | 10.7% |
| 3 or 4 Unit Apartments | 0 | 0.0% |
| 5 to 9 Unit Apartments | 118 | 16.1% |
| 10 or more Apartments | 0 | 0.0% |
| Mobile Home / Other | 0 | 0.0% |
| Total | 732 | 100.0% |
Housing Structures by Occupancy in Duxbury
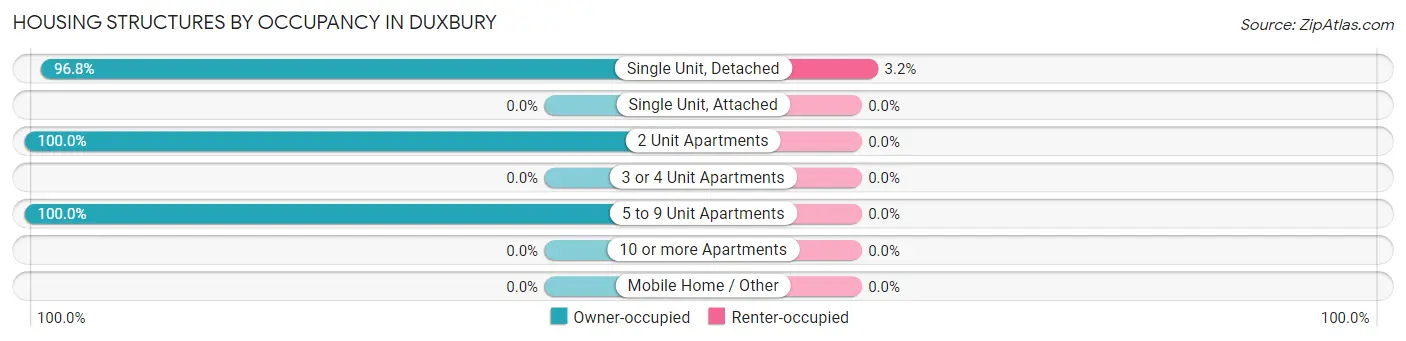
| Structure Type | Owner-occupied | Renter-occupied |
| Single Unit, Detached | 519 (96.8%) | 17 (3.2%) |
| Single Unit, Attached | 0 (0.0%) | 0 (0.0%) |
| 2 Unit Apartments | 78 (100.0%) | 0 (0.0%) |
| 3 or 4 Unit Apartments | 0 (0.0%) | 0 (0.0%) |
| 5 to 9 Unit Apartments | 118 (100.0%) | 0 (0.0%) |
| 10 or more Apartments | 0 (0.0%) | 0 (0.0%) |
| Mobile Home / Other | 0 (0.0%) | 0 (0.0%) |
| Total | 715 (97.7%) | 17 (2.3%) |
Housing Structures by Number of Rooms in Duxbury
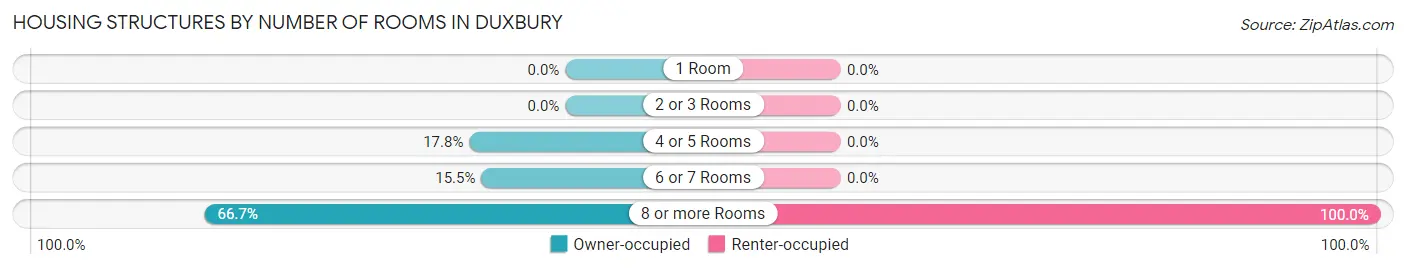
| Number of Rooms | Owner-occupied | Renter-occupied |
| 1 Room | 0 (0.0%) | 0 (0.0%) |
| 2 or 3 Rooms | 0 (0.0%) | 0 (0.0%) |
| 4 or 5 Rooms | 127 (17.8%) | 0 (0.0%) |
| 6 or 7 Rooms | 111 (15.5%) | 0 (0.0%) |
| 8 or more Rooms | 477 (66.7%) | 17 (100.0%) |
| Total | 715 (100.0%) | 17 (100.0%) |
Housing Structure by Heating Type in Duxbury
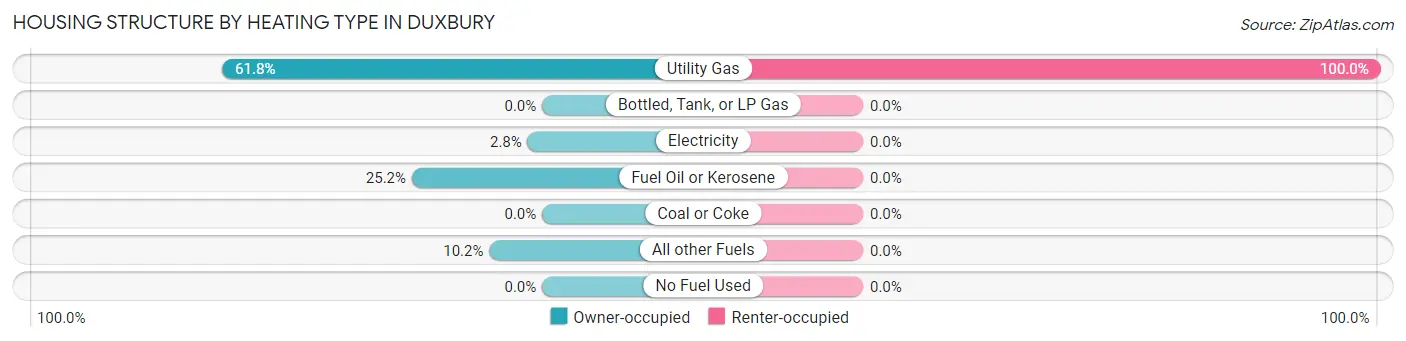
| Heating Type | Owner-occupied | Renter-occupied |
| Utility Gas | 442 (61.8%) | 17 (100.0%) |
| Bottled, Tank, or LP Gas | 0 (0.0%) | 0 (0.0%) |
| Electricity | 20 (2.8%) | 0 (0.0%) |
| Fuel Oil or Kerosene | 180 (25.2%) | 0 (0.0%) |
| Coal or Coke | 0 (0.0%) | 0 (0.0%) |
| All other Fuels | 73 (10.2%) | 0 (0.0%) |
| No Fuel Used | 0 (0.0%) | 0 (0.0%) |
| Total | 715 (100.0%) | 17 (100.0%) |
Household Vehicle Usage in Duxbury
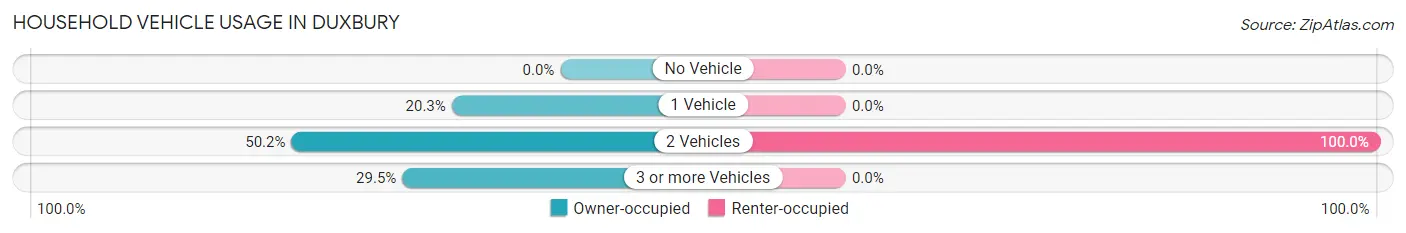
| Vehicles per Household | Owner-occupied | Renter-occupied |
| No Vehicle | 0 (0.0%) | 0 (0.0%) |
| 1 Vehicle | 145 (20.3%) | 0 (0.0%) |
| 2 Vehicles | 359 (50.2%) | 17 (100.0%) |
| 3 or more Vehicles | 211 (29.5%) | 0 (0.0%) |
| Total | 715 (100.0%) | 17 (100.0%) |
Real Estate & Mortgages in Duxbury
Real Estate and Mortgage Overview in Duxbury
| Characteristic | Without Mortgage | With Mortgage |
| Housing Units | 382 | 333 |
| Median Property Value | $1,122,800 | $1,491,700 |
| Median Household Income | $106,123 | $254 |
| Monthly Housing Costs | $1,501 | $306 |
| Real Estate Taxes | $10,001 | $0 |
Property Value by Mortgage Status in Duxbury
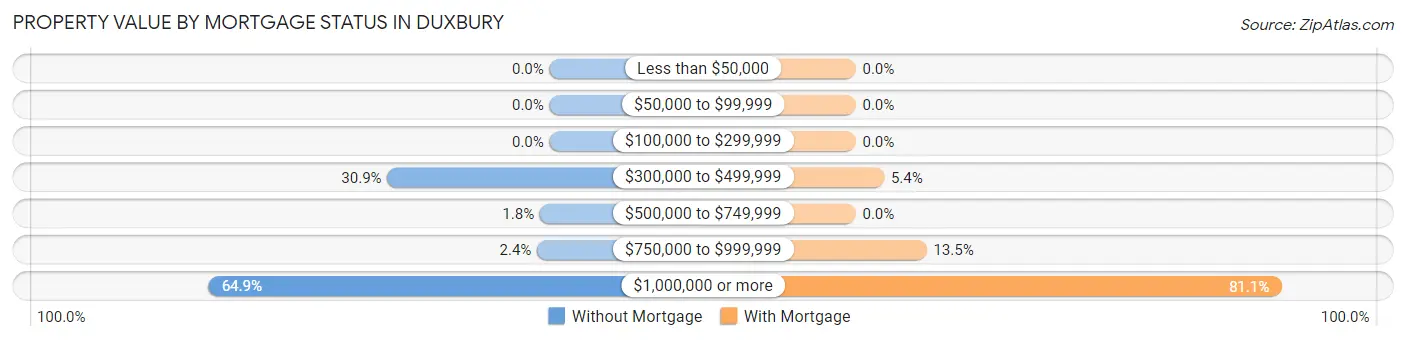
| Property Value | Without Mortgage | With Mortgage |
| Less than $50,000 | 0 (0.0%) | 0 (0.0%) |
| $50,000 to $99,999 | 0 (0.0%) | 0 (0.0%) |
| $100,000 to $299,999 | 0 (0.0%) | 0 (0.0%) |
| $300,000 to $499,999 | 118 (30.9%) | 18 (5.4%) |
| $500,000 to $749,999 | 7 (1.8%) | 0 (0.0%) |
| $750,000 to $999,999 | 9 (2.4%) | 45 (13.5%) |
| $1,000,000 or more | 248 (64.9%) | 270 (81.1%) |
| Total | 382 (100.0%) | 333 (100.0%) |
Household Income by Mortgage Status in Duxbury
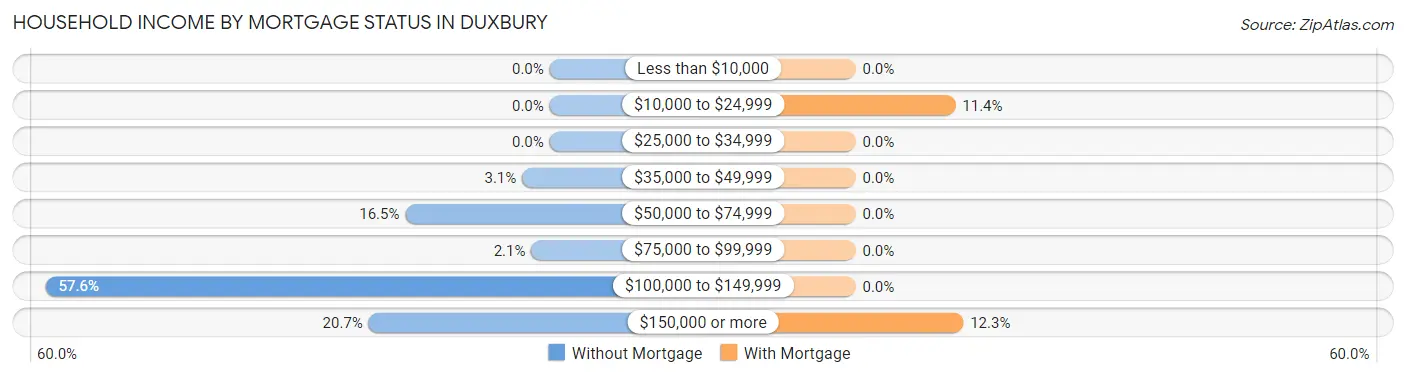
| Household Income | Without Mortgage | With Mortgage |
| Less than $10,000 | 0 (0.0%) | 0 (0.0%) |
| $10,000 to $24,999 | 0 (0.0%) | 38 (11.4%) |
| $25,000 to $34,999 | 0 (0.0%) | 0 (0.0%) |
| $35,000 to $49,999 | 12 (3.1%) | 0 (0.0%) |
| $50,000 to $74,999 | 63 (16.5%) | 0 (0.0%) |
| $75,000 to $99,999 | 8 (2.1%) | 0 (0.0%) |
| $100,000 to $149,999 | 220 (57.6%) | 0 (0.0%) |
| $150,000 or more | 79 (20.7%) | 41 (12.3%) |
| Total | 382 (100.0%) | 333 (100.0%) |
Property Value to Household Income Ratio in Duxbury
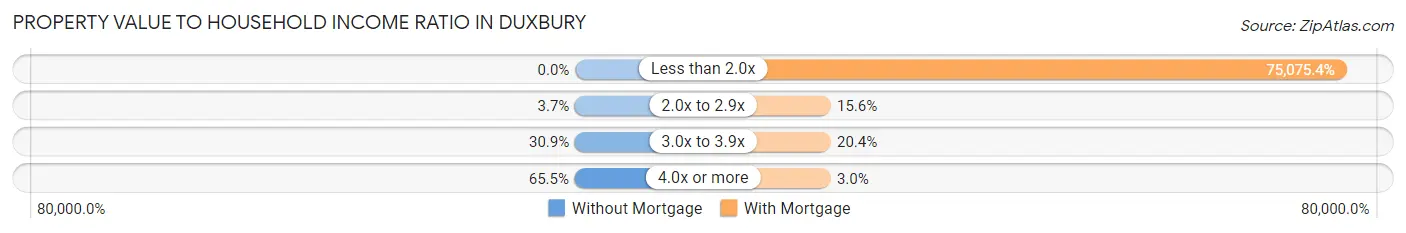
| Value-to-Income Ratio | Without Mortgage | With Mortgage |
| Less than 2.0x | 0 (0.0%) | 250,001 (75,075.4%) |
| 2.0x to 2.9x | 14 (3.7%) | 52 (15.6%) |
| 3.0x to 3.9x | 118 (30.9%) | 68 (20.4%) |
| 4.0x or more | 250 (65.4%) | 10 (3.0%) |
| Total | 382 (100.0%) | 333 (100.0%) |
Real Estate Taxes by Mortgage Status in Duxbury
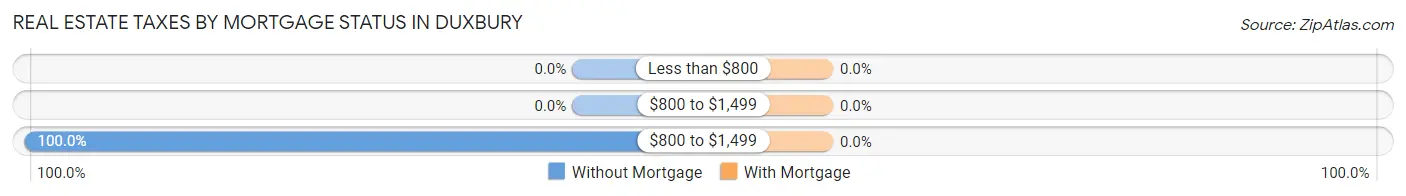
| Property Taxes | Without Mortgage | With Mortgage |
| Less than $800 | 0 (0.0%) | 0 (0.0%) |
| $800 to $1,499 | 0 (0.0%) | 0 (0.0%) |
| $800 to $1,499 | 382 (100.0%) | 0 (0.0%) |
| Total | 382 (100.0%) | 333 (100.0%) |
Health & Disability in Duxbury
Health Insurance Coverage by Age in Duxbury
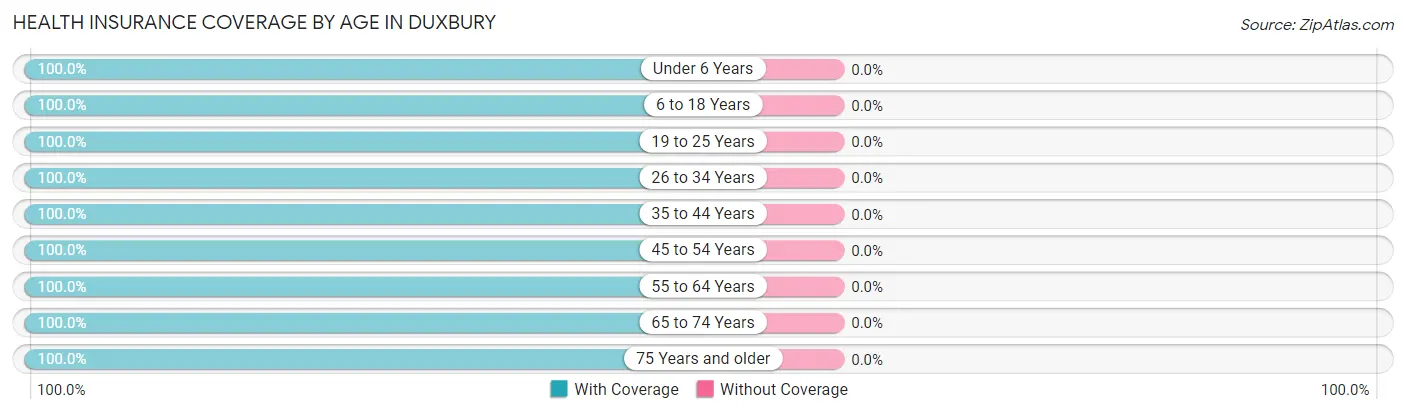
| Age Bracket | With Coverage | Without Coverage |
| Under 6 Years | 55 (100.0%) | 0 (0.0%) |
| 6 to 18 Years | 271 (100.0%) | 0 (0.0%) |
| 19 to 25 Years | 76 (100.0%) | 0 (0.0%) |
| 26 to 34 Years | 103 (100.0%) | 0 (0.0%) |
| 35 to 44 Years | 94 (100.0%) | 0 (0.0%) |
| 45 to 54 Years | 260 (100.0%) | 0 (0.0%) |
| 55 to 64 Years | 471 (100.0%) | 0 (0.0%) |
| 65 to 74 Years | 197 (100.0%) | 0 (0.0%) |
| 75 Years and older | 234 (100.0%) | 0 (0.0%) |
| Total | 1,761 (100.0%) | 0 (0.0%) |
Health Insurance Coverage by Citizenship Status in Duxbury
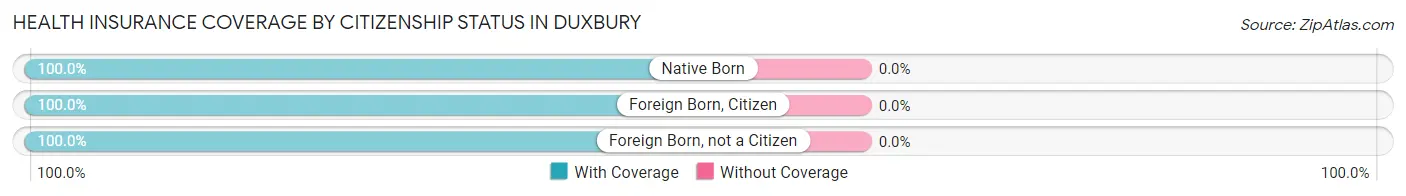
| Citizenship Status | With Coverage | Without Coverage |
| Native Born | 55 (100.0%) | 0 (0.0%) |
| Foreign Born, Citizen | 271 (100.0%) | 0 (0.0%) |
| Foreign Born, not a Citizen | 76 (100.0%) | 0 (0.0%) |
Health Insurance Coverage by Household Income in Duxbury
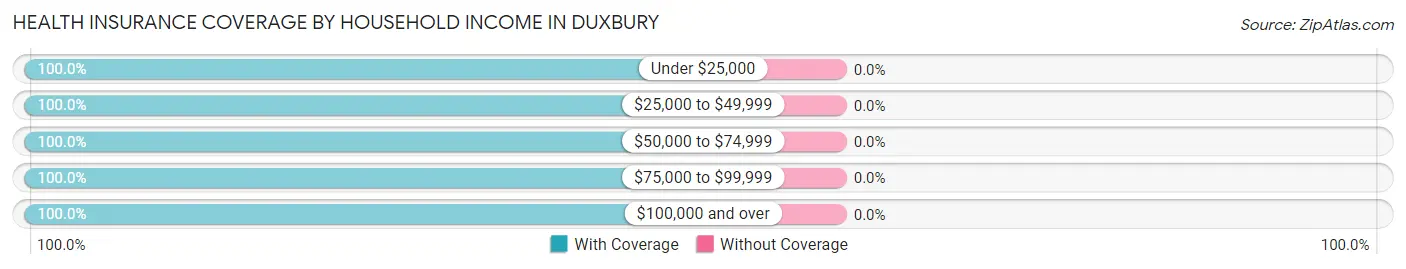
| Household Income | With Coverage | Without Coverage |
| Under $25,000 | 156 (100.0%) | 0 (0.0%) |
| $25,000 to $49,999 | 59 (100.0%) | 0 (0.0%) |
| $50,000 to $74,999 | 95 (100.0%) | 0 (0.0%) |
| $75,000 to $99,999 | 24 (100.0%) | 0 (0.0%) |
| $100,000 and over | 1,427 (100.0%) | 0 (0.0%) |
Public vs Private Health Insurance Coverage by Age in Duxbury
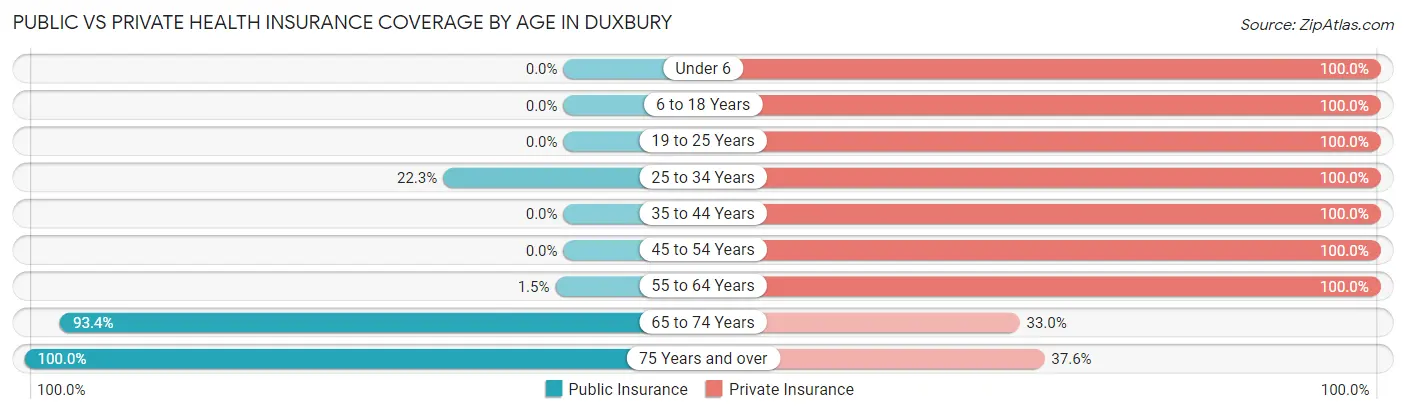
| Age Bracket | Public Insurance | Private Insurance |
| Under 6 | 0 (0.0%) | 55 (100.0%) |
| 6 to 18 Years | 0 (0.0%) | 271 (100.0%) |
| 19 to 25 Years | 0 (0.0%) | 76 (100.0%) |
| 25 to 34 Years | 23 (22.3%) | 103 (100.0%) |
| 35 to 44 Years | 0 (0.0%) | 94 (100.0%) |
| 45 to 54 Years | 0 (0.0%) | 260 (100.0%) |
| 55 to 64 Years | 7 (1.5%) | 471 (100.0%) |
| 65 to 74 Years | 184 (93.4%) | 65 (33.0%) |
| 75 Years and over | 234 (100.0%) | 88 (37.6%) |
| Total | 448 (25.4%) | 1,483 (84.2%) |
Disability Status by Sex by Age in Duxbury
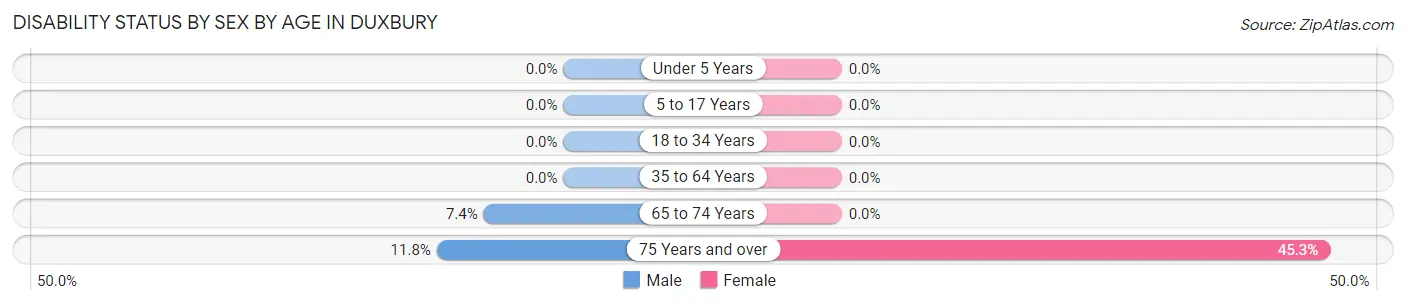
| Age Bracket | Male | Female |
| Under 5 Years | 0 (0.0%) | 0 (0.0%) |
| 5 to 17 Years | 0 (0.0%) | 0 (0.0%) |
| 18 to 34 Years | 0 (0.0%) | 0 (0.0%) |
| 35 to 64 Years | 0 (0.0%) | 0 (0.0%) |
| 65 to 74 Years | 10 (7.4%) | 0 (0.0%) |
| 75 Years and over | 20 (11.8%) | 29 (45.3%) |
Disability Class by Sex by Age in Duxbury
Disability Class: Hearing Difficulty
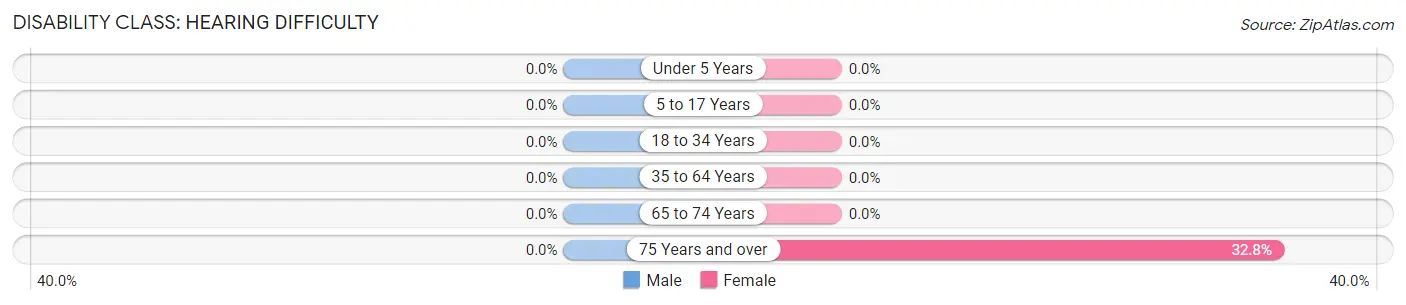
| Age Bracket | Male | Female |
| Under 5 Years | 0 (0.0%) | 0 (0.0%) |
| 5 to 17 Years | 0 (0.0%) | 0 (0.0%) |
| 18 to 34 Years | 0 (0.0%) | 0 (0.0%) |
| 35 to 64 Years | 0 (0.0%) | 0 (0.0%) |
| 65 to 74 Years | 0 (0.0%) | 0 (0.0%) |
| 75 Years and over | 0 (0.0%) | 21 (32.8%) |
Disability Class: Vision Difficulty
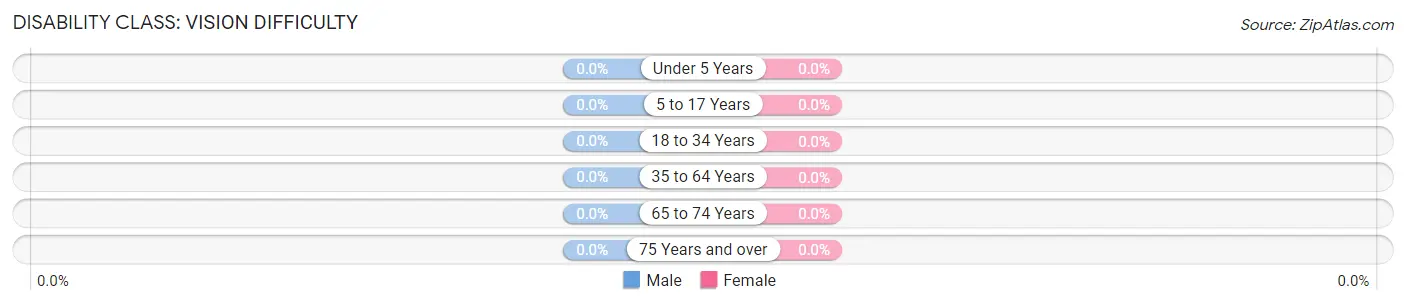
| Age Bracket | Male | Female |
| Under 5 Years | 0 (0.0%) | 0 (0.0%) |
| 5 to 17 Years | 0 (0.0%) | 0 (0.0%) |
| 18 to 34 Years | 0 (0.0%) | 0 (0.0%) |
| 35 to 64 Years | 0 (0.0%) | 0 (0.0%) |
| 65 to 74 Years | 0 (0.0%) | 0 (0.0%) |
| 75 Years and over | 0 (0.0%) | 0 (0.0%) |
Disability Class: Cognitive Difficulty
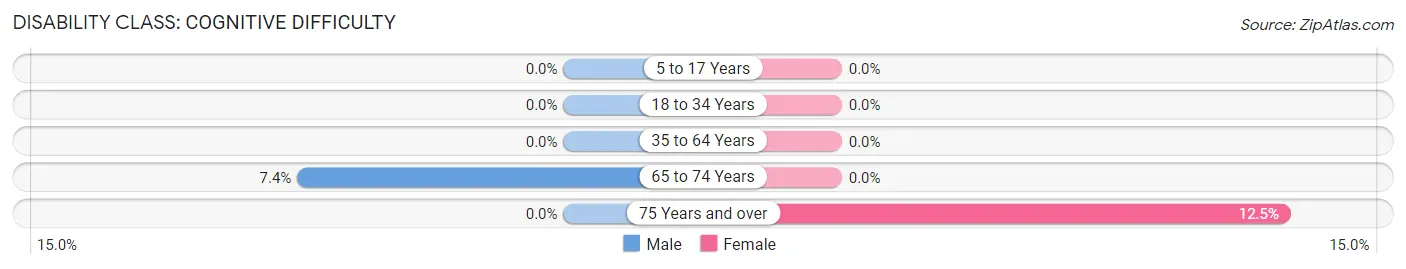
| Age Bracket | Male | Female |
| 5 to 17 Years | 0 (0.0%) | 0 (0.0%) |
| 18 to 34 Years | 0 (0.0%) | 0 (0.0%) |
| 35 to 64 Years | 0 (0.0%) | 0 (0.0%) |
| 65 to 74 Years | 10 (7.4%) | 0 (0.0%) |
| 75 Years and over | 0 (0.0%) | 8 (12.5%) |
Disability Class: Ambulatory Difficulty
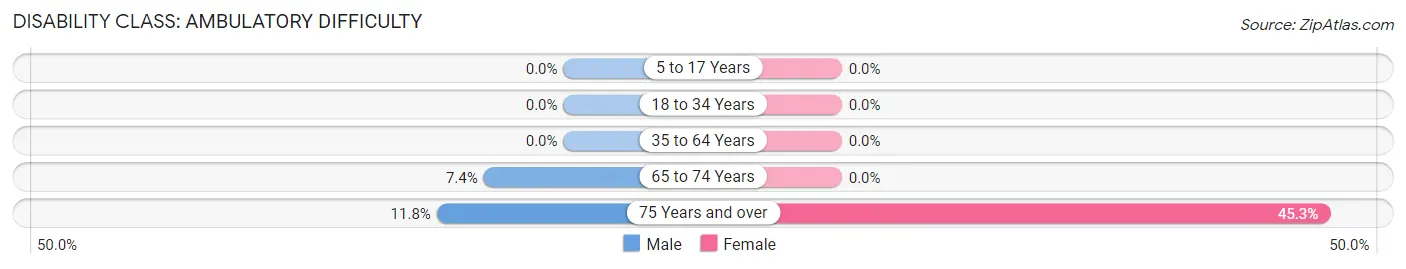
| Age Bracket | Male | Female |
| 5 to 17 Years | 0 (0.0%) | 0 (0.0%) |
| 18 to 34 Years | 0 (0.0%) | 0 (0.0%) |
| 35 to 64 Years | 0 (0.0%) | 0 (0.0%) |
| 65 to 74 Years | 10 (7.4%) | 0 (0.0%) |
| 75 Years and over | 20 (11.8%) | 29 (45.3%) |
Disability Class: Self-Care Difficulty
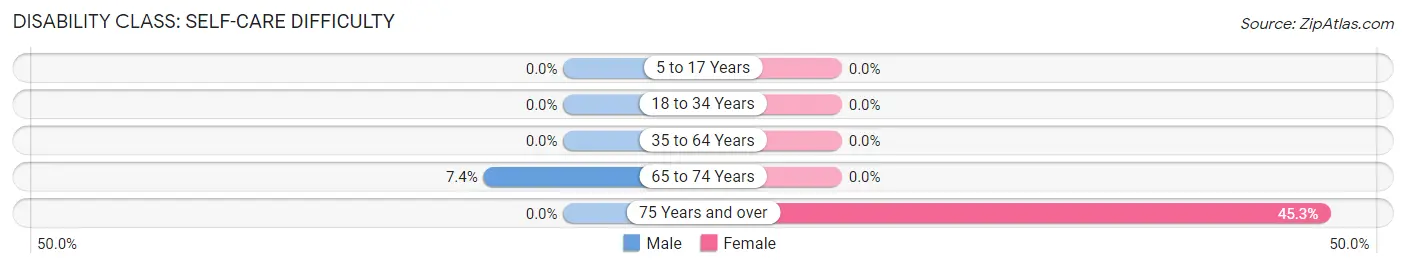
| Age Bracket | Male | Female |
| 5 to 17 Years | 0 (0.0%) | 0 (0.0%) |
| 18 to 34 Years | 0 (0.0%) | 0 (0.0%) |
| 35 to 64 Years | 0 (0.0%) | 0 (0.0%) |
| 65 to 74 Years | 10 (7.4%) | 0 (0.0%) |
| 75 Years and over | 0 (0.0%) | 29 (45.3%) |
Technology Access in Duxbury
Computing Device Access in Duxbury
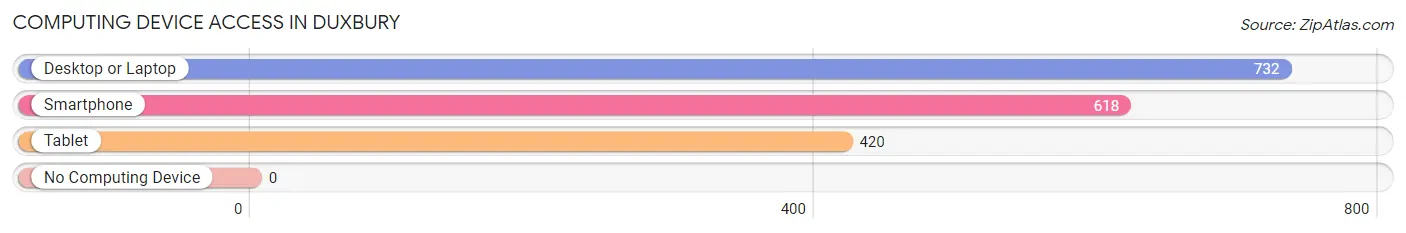
| Device Type | # Households | % Households |
| Desktop or Laptop | 732 | 100.0% |
| Smartphone | 618 | 84.4% |
| Tablet | 420 | 57.4% |
| No Computing Device | 0 | 0.0% |
| Total | 732 | 100.0% |
Internet Access in Duxbury
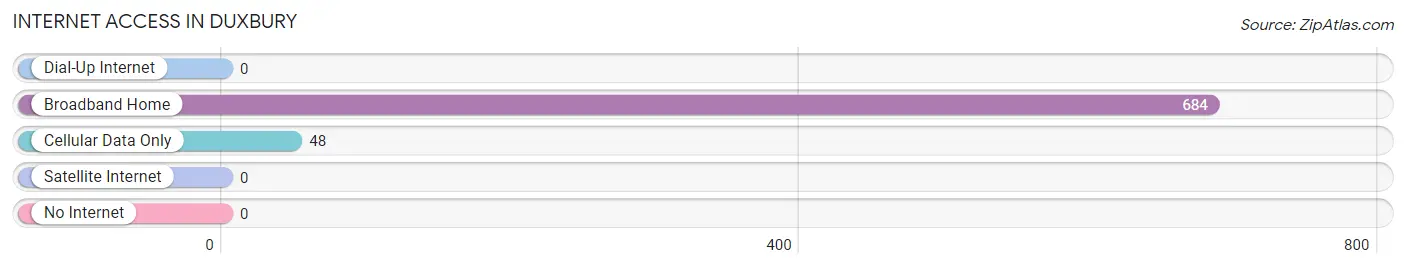
| Internet Type | # Households | % Households |
| Dial-Up Internet | 0 | 0.0% |
| Broadband Home | 684 | 93.4% |
| Cellular Data Only | 48 | 6.6% |
| Satellite Internet | 0 | 0.0% |
| No Internet | 0 | 0.0% |
| Total | 732 | 100.0% |
Duxbury Summary
Duxbury, Massachusetts is a town located in Plymouth County, in the southeastern part of the state. It is situated on the south shore of Massachusetts Bay, about 35 miles south of Boston. The town has a population of about 15,000 people, and is known for its historic homes, beaches, and maritime heritage.
History
Duxbury was first settled in 1627 by English colonists, who named it after the town of Duxbury in England. The town was initially part of the Plymouth Colony, and was later incorporated in 1637. During the American Revolution, Duxbury was a major shipbuilding center, and was home to several privateers. In the 19th century, the town became a popular summer resort for wealthy Bostonians, and many of the town's historic homes were built during this period.
Geography
Duxbury is located in southeastern Massachusetts, on the south shore of Massachusetts Bay. It is bordered by the towns of Plymouth to the north, Kingston to the east, Marshfield to the south, and Pembroke to the west. The town covers an area of about 28 square miles, and is home to several beaches, including Duxbury Beach, Gurnet Beach, and Saquish Beach.
Economy
Duxbury's economy is largely based on tourism, with many visitors coming to the town to enjoy its beaches and historic homes. The town is also home to several businesses, including a number of restaurants, retail stores, and professional services. The town is also home to several marinas, which provide services to recreational boaters.
Demographics
As of the 2010 census, Duxbury had a population of 15,059 people. The racial makeup of the town was 94.3% White, 1.3% African American, 0.3% Native American, 1.7% Asian, 0.1% Pacific Islander, 0.9% from other races, and 1.7% from two or more races. The median household income was $97,817, and the median family income was $117,817.
Duxbury is a predominantly white town, with a small but growing minority population. The town is home to a large number of retirees, and the median age is 47. The town is also home to a large number of seasonal residents, who come to the town to enjoy its beaches and other attractions.
Common Questions
What is Per Capita Income in Duxbury?
Per Capita income in Duxbury is $135,376.
What is the Median Family Income in Duxbury?
Median Family Income in Duxbury is $213,472.
What is the Median Household income in Duxbury?
Median Household Income in Duxbury is $128,000.
What is Income or Wage Gap in Duxbury?
Income or Wage Gap in Duxbury is 67.6%.
Women in Duxbury earn 32.4 cents for every dollar earned by a man.
What is Inequality or Gini Index in Duxbury?
Inequality or Gini Index in Duxbury is 0.58.
What is the Total Population of Duxbury?
Total Population of Duxbury is 1,761.
What is the Total Male Population of Duxbury?
Total Male Population of Duxbury is 939.
What is the Total Female Population of Duxbury?
Total Female Population of Duxbury is 822.
What is the Ratio of Males per 100 Females in Duxbury?
There are 114.23 Males per 100 Females in Duxbury.
What is the Ratio of Females per 100 Males in Duxbury?
There are 87.54 Females per 100 Males in Duxbury.
What is the Median Population Age in Duxbury?
Median Population Age in Duxbury is 55.5 Years.
What is the Average Family Size in Duxbury
Average Family Size in Duxbury is 3.0 People.
What is the Average Household Size in Duxbury
Average Household Size in Duxbury is 2.4 People.
How Large is the Labor Force in Duxbury?
There are 1,057 People in the Labor Forcein in Duxbury.
What is the Percentage of People in the Labor Force in Duxbury?
71.2% of People are in the Labor Force in Duxbury.
What is the Unemployment Rate in Duxbury?
Unemployment Rate in Duxbury is 5.6%.