Upton, MA Map & Demographics
Upton Map
Upton Overview
$52,391
PER CAPITA INCOME
$118,224
AVG FAMILY INCOME
$104,913
AVG HOUSEHOLD INCOME
1.8%
WAGE / INCOME GAP [ % ]
98.2¢/ $1
WAGE / INCOME GAP [ $ ]
0.39
INEQUALITY / GINI INDEX
2,596
TOTAL POPULATION
1,287
MALE POPULATION
1,309
FEMALE POPULATION
98.32
MALES / 100 FEMALES
101.71
FEMALES / 100 MALES
50.3
MEDIAN AGE
3.0
AVG FAMILY SIZE
2.6
AVG HOUSEHOLD SIZE
1,538
LABOR FORCE [ PEOPLE ]
68.0%
PERCENT IN LABOR FORCE
6.4%
UNEMPLOYMENT RATE
Upton Zip Codes
Income in Upton
Income Overview in Upton
Per Capita Income in Upton is $52,391, while median incomes of families and households are $118,224 and $104,913 respectively.
| Characteristic | Number | Measure |
| Per Capita Income | 2,596 | $52,391 |
| Median Family Income | 768 | $118,224 |
| Mean Family Income | 768 | $147,768 |
| Median Household Income | 985 | $104,913 |
| Mean Household Income | 985 | $133,553 |
| Income Deficit | 768 | $0 |
| Wage / Income Gap (%) | 2,596 | 1.75% |
| Wage / Income Gap ($) | 2,596 | 98.25¢ per $1 |
| Gini / Inequality Index | 2,596 | 0.39 |
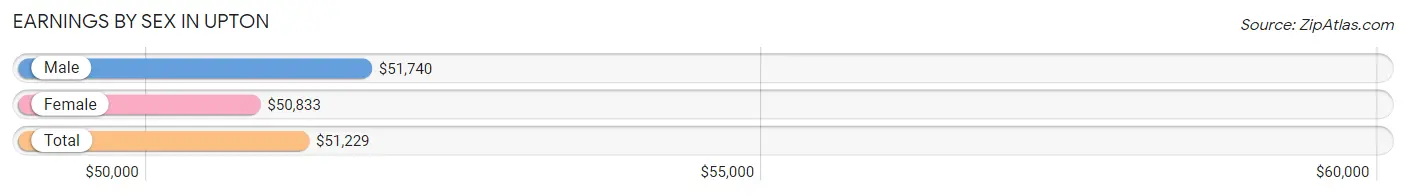
Earnings by Sex in Upton
Average Earnings in Upton are $51,229, $51,740 for men and $50,833 for women, a difference of 1.8%.
| Sex | Number | Average Earnings |
| Male | 893 (53.8%) | $51,740 |
| Female | 766 (46.2%) | $50,833 |
| Total | 1,659 (100.0%) | $51,229 |
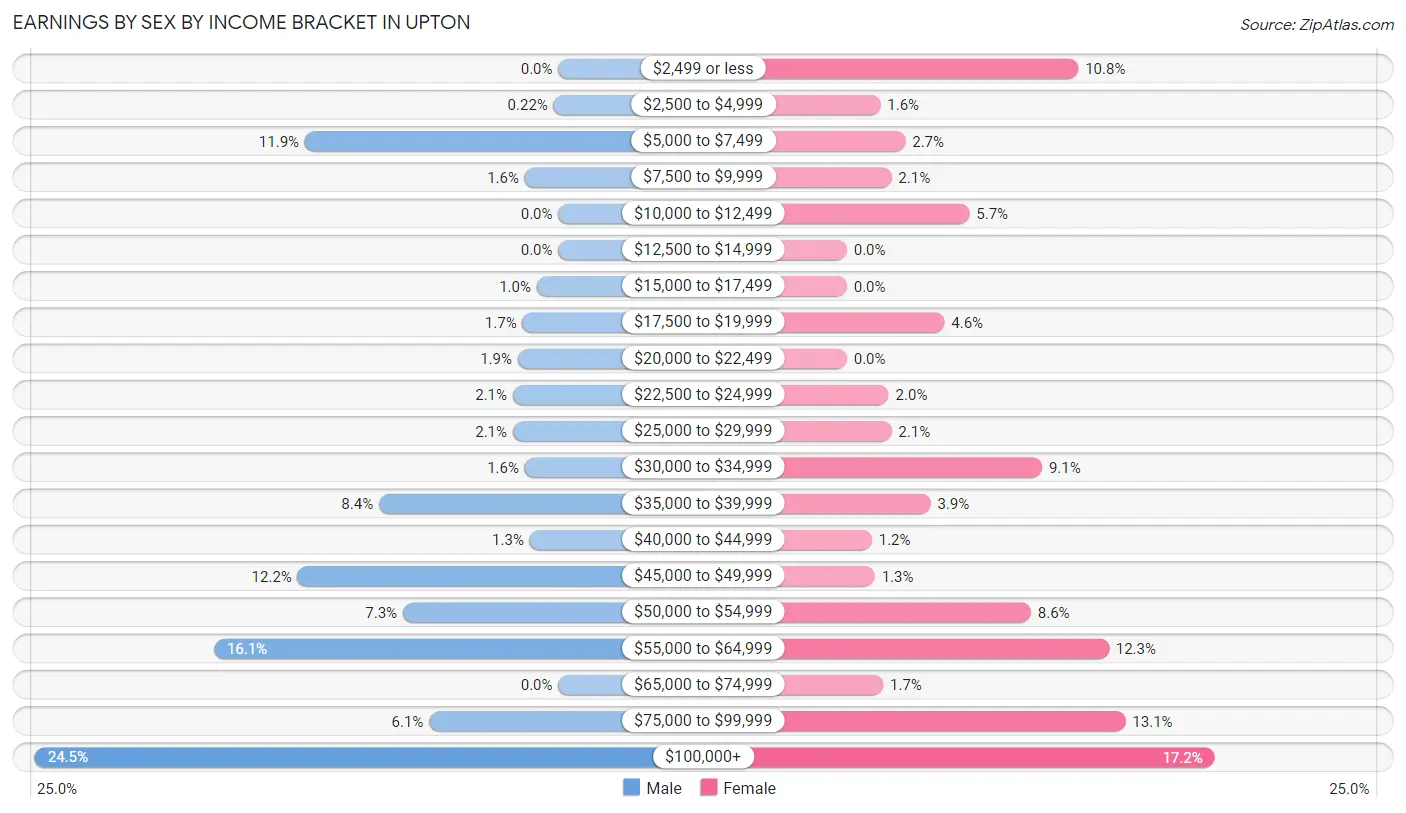
Earnings by Sex by Income Bracket in Upton
The most common earnings brackets in Upton are $100,000+ for men (219 | 24.5%) and $100,000+ for women (132 | 17.2%).
| Income | Male | Female |
| $2,499 or less | 0 (0.0%) | 83 (10.8%) |
| $2,500 to $4,999 | 2 (0.2%) | 12 (1.6%) |
| $5,000 to $7,499 | 106 (11.9%) | 21 (2.7%) |
| $7,500 to $9,999 | 14 (1.6%) | 16 (2.1%) |
| $10,000 to $12,499 | 0 (0.0%) | 44 (5.7%) |
| $12,500 to $14,999 | 0 (0.0%) | 0 (0.0%) |
| $15,000 to $17,499 | 9 (1.0%) | 0 (0.0%) |
| $17,500 to $19,999 | 15 (1.7%) | 35 (4.6%) |
| $20,000 to $22,499 | 17 (1.9%) | 0 (0.0%) |
| $22,500 to $24,999 | 19 (2.1%) | 15 (2.0%) |
| $25,000 to $29,999 | 19 (2.1%) | 16 (2.1%) |
| $30,000 to $34,999 | 14 (1.6%) | 70 (9.1%) |
| $35,000 to $39,999 | 75 (8.4%) | 30 (3.9%) |
| $40,000 to $44,999 | 12 (1.3%) | 9 (1.2%) |
| $45,000 to $49,999 | 109 (12.2%) | 10 (1.3%) |
| $50,000 to $54,999 | 65 (7.3%) | 66 (8.6%) |
| $55,000 to $64,999 | 144 (16.1%) | 94 (12.3%) |
| $65,000 to $74,999 | 0 (0.0%) | 13 (1.7%) |
| $75,000 to $99,999 | 54 (6.0%) | 100 (13.1%) |
| $100,000+ | 219 (24.5%) | 132 (17.2%) |
| Total | 893 (100.0%) | 766 (100.0%) |
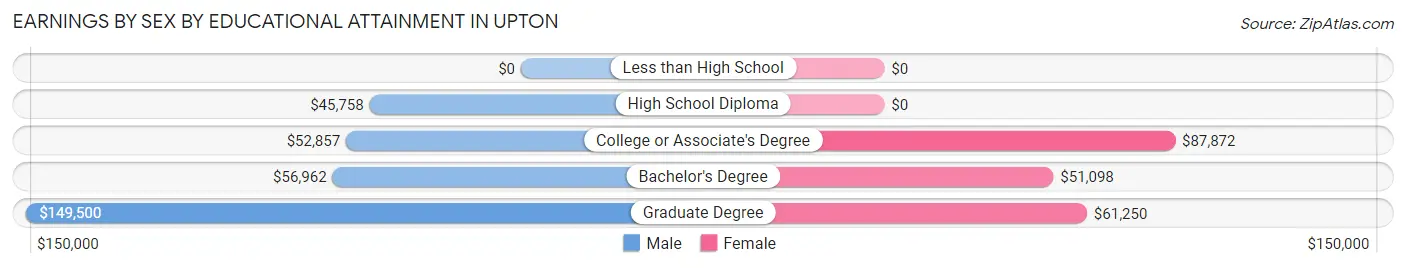
Earnings by Sex by Educational Attainment in Upton
Average earnings in Upton are $55,721 for men and $59,896 for women, a difference of 7.0%. Men with an educational attainment of graduate degree enjoy the highest average annual earnings of $149,500, while those with high school diploma education earn the least with $45,758. Women with an educational attainment of college or associate's degree earn the most with the average annual earnings of $87,872, while those with bachelor's degree education have the smallest earnings of $51,098.
| Educational Attainment | Male Income | Female Income |
| Less than High School | - | - |
| High School Diploma | $45,758 | $0 |
| College or Associate's Degree | $52,857 | $87,872 |
| Bachelor's Degree | $56,962 | $51,098 |
| Graduate Degree | $149,500 | $61,250 |
| Total | $55,721 | $59,896 |
Family Income in Upton
Family Income Brackets in Upton
According to the Upton family income data, there are 210 families falling into the $100,000 to $149,999 income range, which is the most common income bracket and makes up 27.3% of all families.
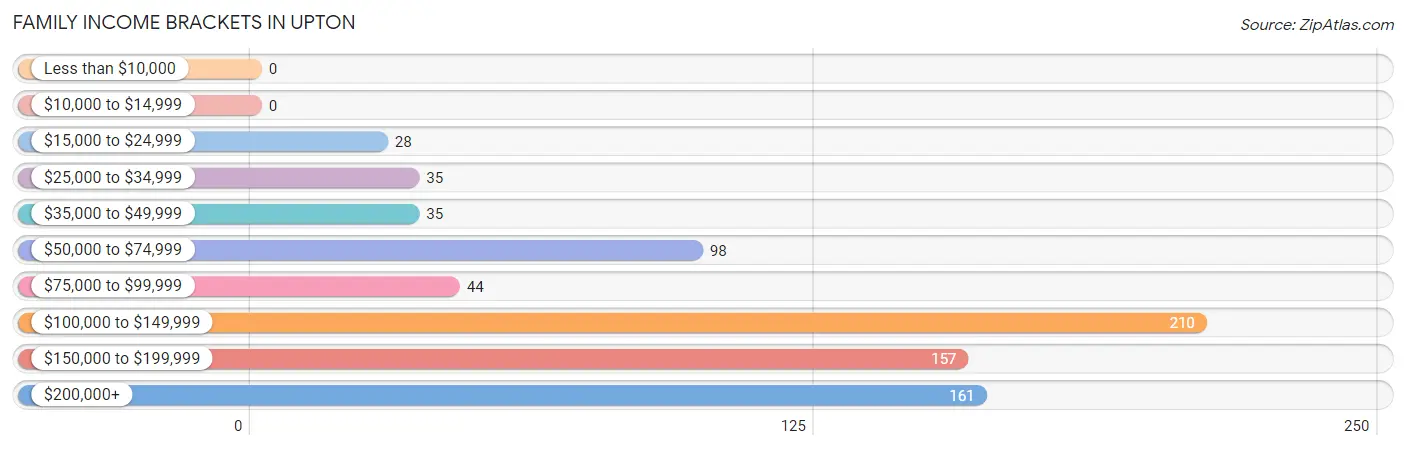
| Income Bracket | # Families | % Families |
| Less than $10,000 | 0 | 0.0% |
| $10,000 to $14,999 | 0 | 0.0% |
| $15,000 to $24,999 | 28 | 3.6% |
| $25,000 to $34,999 | 35 | 4.6% |
| $35,000 to $49,999 | 35 | 4.6% |
| $50,000 to $74,999 | 98 | 12.8% |
| $75,000 to $99,999 | 44 | 5.7% |
| $100,000 to $149,999 | 210 | 27.3% |
| $150,000 to $199,999 | 157 | 20.4% |
| $200,000+ | 161 | 21.0% |
Family Income by Famaliy Size in Upton
5-person families (45 | 5.9%) account for the highest median family income in Upton with $250,001 per family, while 5-person families (45 | 5.9%) have the highest median income of $50,000 per family member.
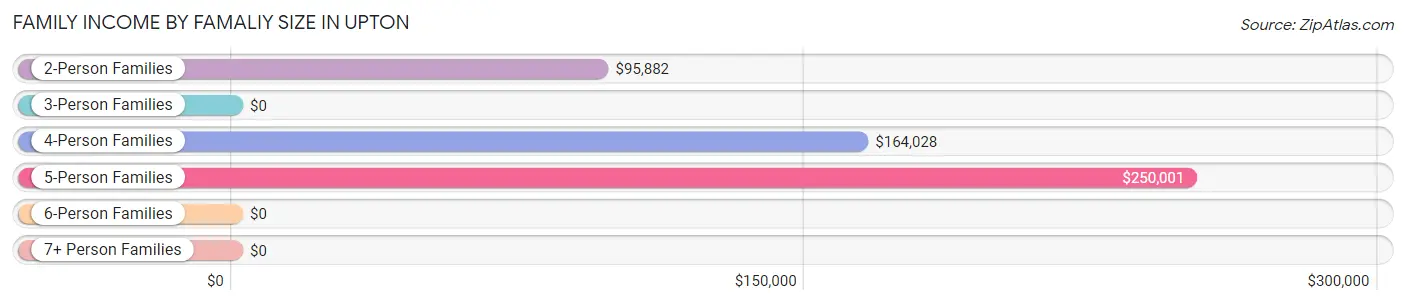
| Income Bracket | # Families | Median Income |
| 2-Person Families | 374 (48.7%) | $95,882 |
| 3-Person Families | 204 (26.6%) | $0 |
| 4-Person Families | 126 (16.4%) | $164,028 |
| 5-Person Families | 45 (5.9%) | $250,001 |
| 6-Person Families | 19 (2.5%) | $0 |
| 7+ Person Families | 0 (0.0%) | $0 |
| Total | 768 (100.0%) | $118,224 |
Family Income by Number of Earners in Upton
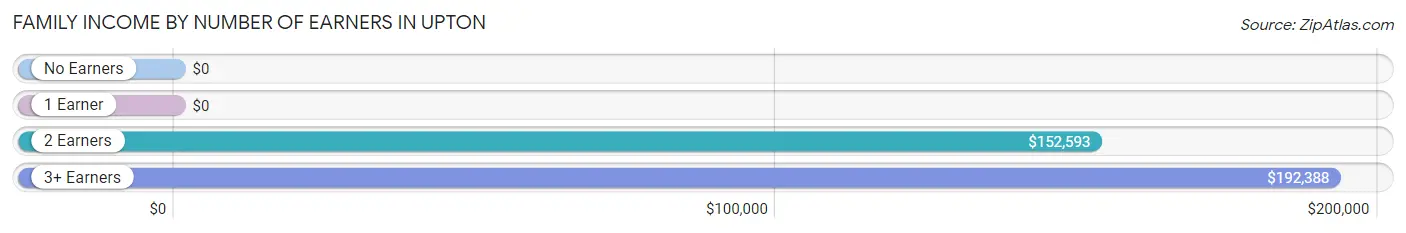
| Number of Earners | # Families | Median Income |
| No Earners | 53 (6.9%) | $0 |
| 1 Earner | 278 (36.2%) | $0 |
| 2 Earners | 240 (31.2%) | $152,593 |
| 3+ Earners | 197 (25.7%) | $192,388 |
| Total | 768 (100.0%) | $118,224 |
Household Income in Upton
Household Income Brackets in Upton
With 244 households falling in the category, the $100,000 to $149,999 income range is the most frequent in Upton, accounting for 24.8% of all households.
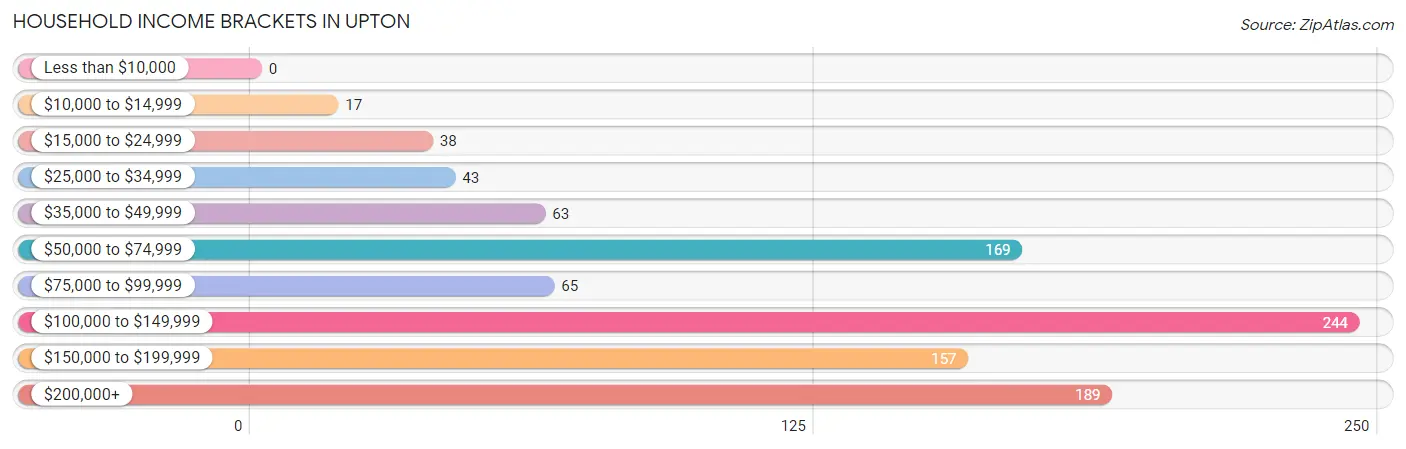
| Income Bracket | # Households | % Households |
| Less than $10,000 | 0 | 0.0% |
| $10,000 to $14,999 | 17 | 1.7% |
| $15,000 to $24,999 | 38 | 3.9% |
| $25,000 to $34,999 | 43 | 4.4% |
| $35,000 to $49,999 | 63 | 6.4% |
| $50,000 to $74,999 | 169 | 17.2% |
| $75,000 to $99,999 | 65 | 6.6% |
| $100,000 to $149,999 | 244 | 24.8% |
| $150,000 to $199,999 | 157 | 15.9% |
| $200,000+ | 189 | 19.2% |
Household Income by Householder Age in Upton
The median household income in Upton is $104,913, with the highest median household income of $190,179 found in the 25 to 44 years age bracket for the primary householder. A total of 148 households (15.0%) fall into this category. Meanwhile, the 15 to 24 years age bracket for the primary householder has the lowest median household income of $0, with 19 households (1.9%) in this group.
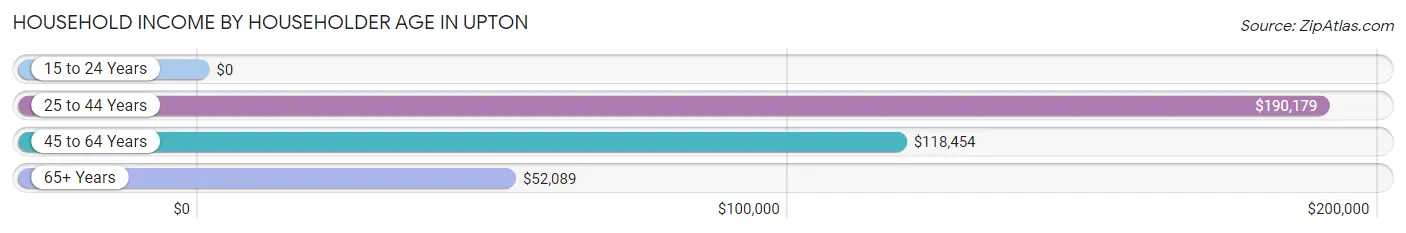
| Income Bracket | # Households | Median Income |
| 15 to 24 Years | 19 (1.9%) | $0 |
| 25 to 44 Years | 148 (15.0%) | $190,179 |
| 45 to 64 Years | 499 (50.7%) | $118,454 |
| 65+ Years | 319 (32.4%) | $52,089 |
| Total | 985 (100.0%) | $104,913 |
Poverty in Upton
Income Below Poverty by Sex and Age in Upton
With 3.5% poverty level for males and 3.1% for females among the residents of Upton, 75 year old and over males and 25 to 34 year old females are the most vulnerable to poverty, with 17 males (20.7%) and 18 females (16.2%) in their respective age groups living below the poverty level.
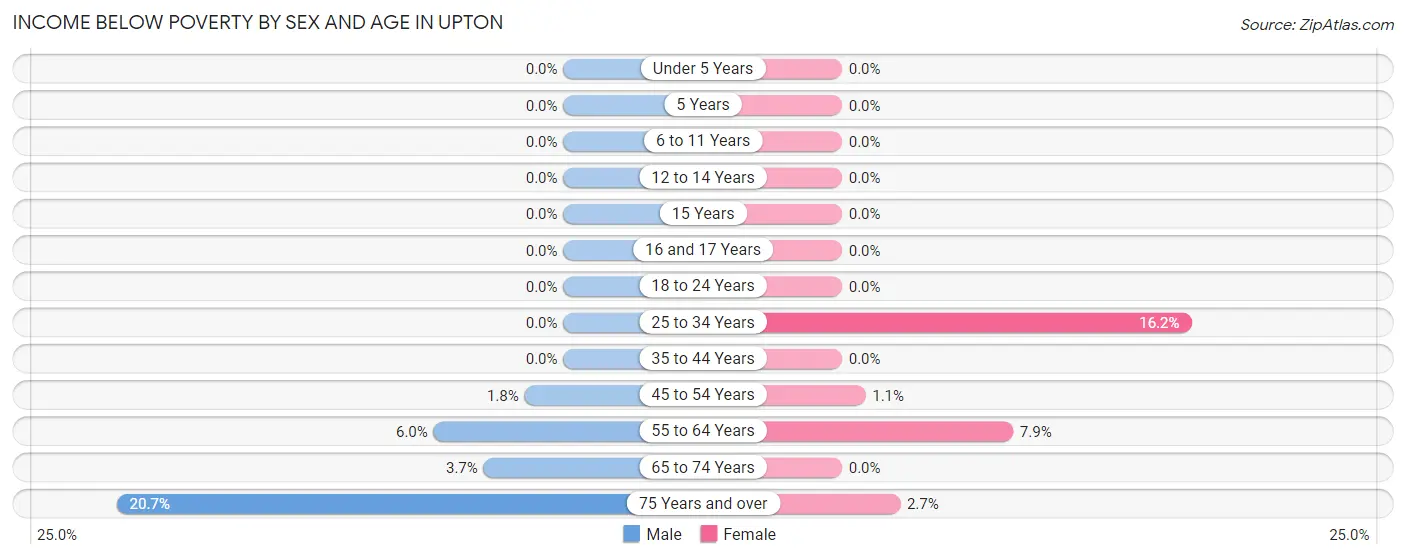
| Age Bracket | Male | Female |
| Under 5 Years | 0 (0.0%) | 0 (0.0%) |
| 5 Years | 0 (0.0%) | 0 (0.0%) |
| 6 to 11 Years | 0 (0.0%) | 0 (0.0%) |
| 12 to 14 Years | 0 (0.0%) | 0 (0.0%) |
| 15 Years | 0 (0.0%) | 0 (0.0%) |
| 16 and 17 Years | 0 (0.0%) | 0 (0.0%) |
| 18 to 24 Years | 0 (0.0%) | 0 (0.0%) |
| 25 to 34 Years | 0 (0.0%) | 18 (16.2%) |
| 35 to 44 Years | 0 (0.0%) | 0 (0.0%) |
| 45 to 54 Years | 2 (1.8%) | 3 (1.1%) |
| 55 to 64 Years | 21 (6.0%) | 17 (7.9%) |
| 65 to 74 Years | 5 (3.7%) | 0 (0.0%) |
| 75 Years and over | 17 (20.7%) | 2 (2.7%) |
| Total | 45 (3.5%) | 40 (3.1%) |
Income Above Poverty by Sex and Age in Upton
According to the poverty statistics in Upton, males aged under 5 years and females aged under 5 years are the age groups that are most secure financially, with 100.0% of males and 100.0% of females in these age groups living above the poverty line.
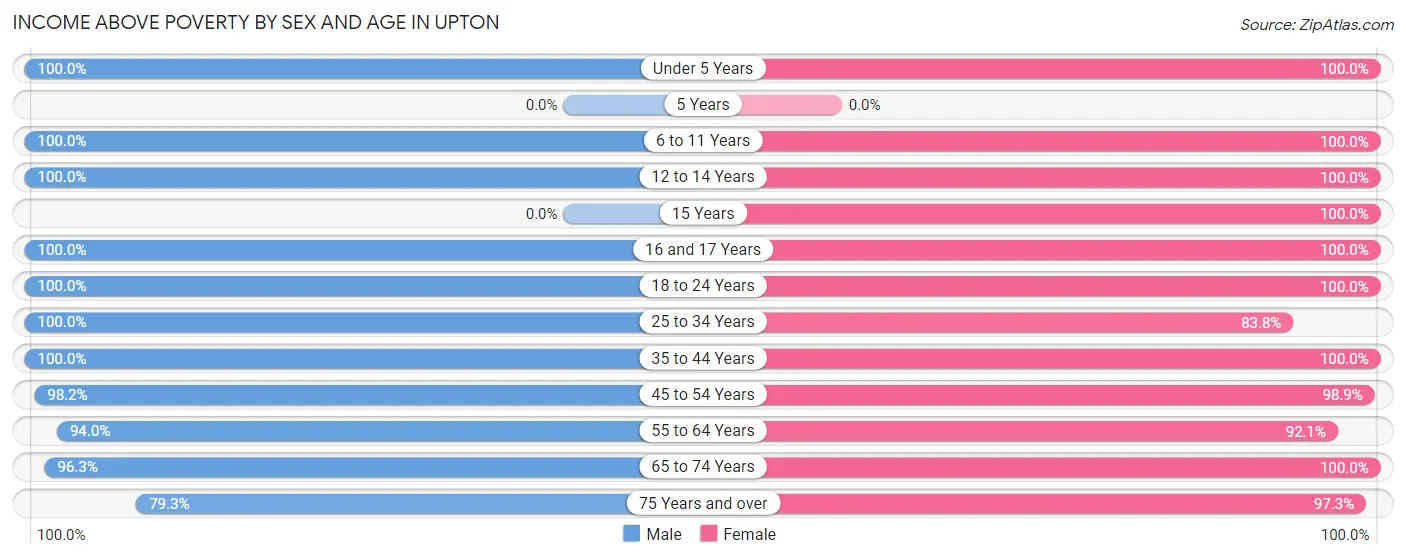
| Age Bracket | Male | Female |
| Under 5 Years | 8 (100.0%) | 114 (100.0%) |
| 5 Years | 0 (0.0%) | 0 (0.0%) |
| 6 to 11 Years | 52 (100.0%) | 53 (100.0%) |
| 12 to 14 Years | 59 (100.0%) | 10 (100.0%) |
| 15 Years | 0 (0.0%) | 19 (100.0%) |
| 16 and 17 Years | 19 (100.0%) | 54 (100.0%) |
| 18 to 24 Years | 104 (100.0%) | 87 (100.0%) |
| 25 to 34 Years | 121 (100.0%) | 93 (83.8%) |
| 35 to 44 Years | 228 (100.0%) | 77 (100.0%) |
| 45 to 54 Years | 109 (98.2%) | 272 (98.9%) |
| 55 to 64 Years | 328 (94.0%) | 197 (92.1%) |
| 65 to 74 Years | 130 (96.3%) | 221 (100.0%) |
| 75 Years and over | 65 (79.3%) | 72 (97.3%) |
| Total | 1,223 (96.5%) | 1,269 (96.9%) |
Income Below Poverty Among Married-Couple Families in Upton
The poverty statistics for married-couple families in Upton show that 3.0% or 17 of the total 565 families live below the poverty line. Families with no children have the highest poverty rate of 4.2%, comprising of 17 families. On the other hand, families with 1 or 2 children have the lowest poverty rate of 0.0%, which includes 0 families.
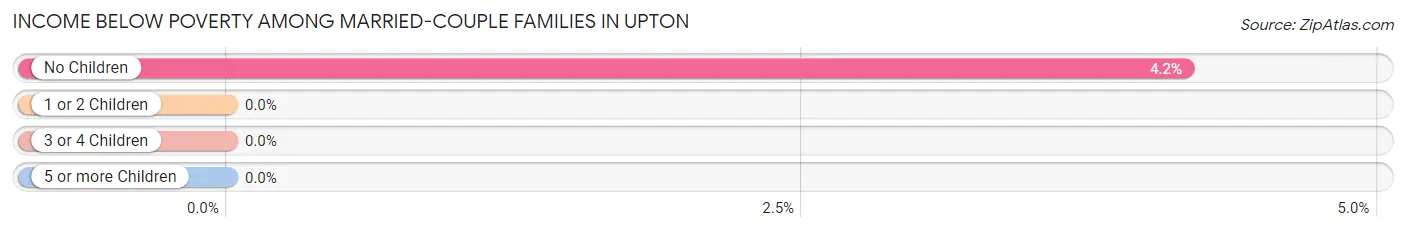
| Children | Above Poverty | Below Poverty |
| No Children | 392 (95.8%) | 17 (4.2%) |
| 1 or 2 Children | 134 (100.0%) | 0 (0.0%) |
| 3 or 4 Children | 22 (100.0%) | 0 (0.0%) |
| 5 or more Children | 0 (0.0%) | 0 (0.0%) |
| Total | 548 (97.0%) | 17 (3.0%) |
Income Below Poverty Among Single-Parent Households in Upton
| Children | Single Father | Single Mother |
| No Children | 0 (0.0%) | 0 (0.0%) |
| 1 or 2 Children | 0 (0.0%) | 0 (0.0%) |
| 3 or 4 Children | 0 (0.0%) | 0 (0.0%) |
| 5 or more Children | 0 (0.0%) | 0 (0.0%) |
| Total | 0 (0.0%) | 0 (0.0%) |
Income Below Poverty Among Married-Couple vs Single-Parent Households in Upton
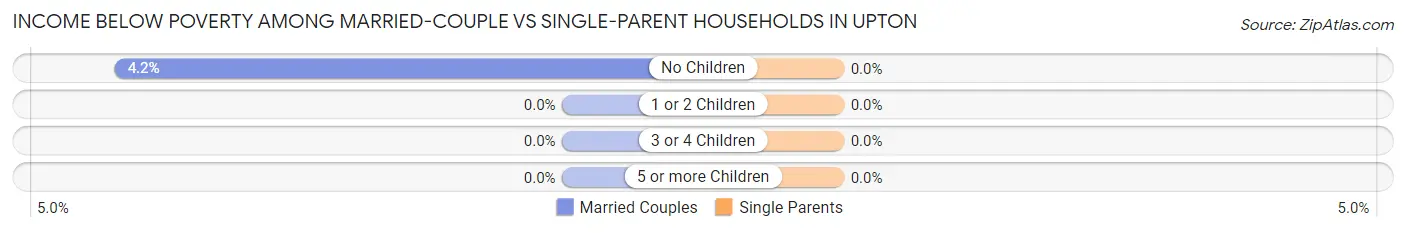
| Children | Married-Couple Families | Single-Parent Households |
| No Children | 17 (4.2%) | 0 (0.0%) |
| 1 or 2 Children | 0 (0.0%) | 0 (0.0%) |
| 3 or 4 Children | 0 (0.0%) | 0 (0.0%) |
| 5 or more Children | 0 (0.0%) | 0 (0.0%) |
| Total | 17 (3.0%) | 0 (0.0%) |
Race in Upton
The most populous races in Upton are White / Caucasian (2,308 | 88.9%), Hispanic or Latino (220 | 8.5%), and Two or more Races (137 | 5.3%).

| Race | # Population | % Population |
| Asian | 69 | 2.7% |
| Black / African American | 82 | 3.2% |
| Hawaiian / Pacific | 0 | 0.0% |
| Hispanic or Latino | 220 | 8.5% |
| Native / Alaskan | 0 | 0.0% |
| White / Caucasian | 2,308 | 88.9% |
| Two or more Races | 137 | 5.3% |
| Some other Race | 0 | 0.0% |
| Total | 2,596 | 100.0% |
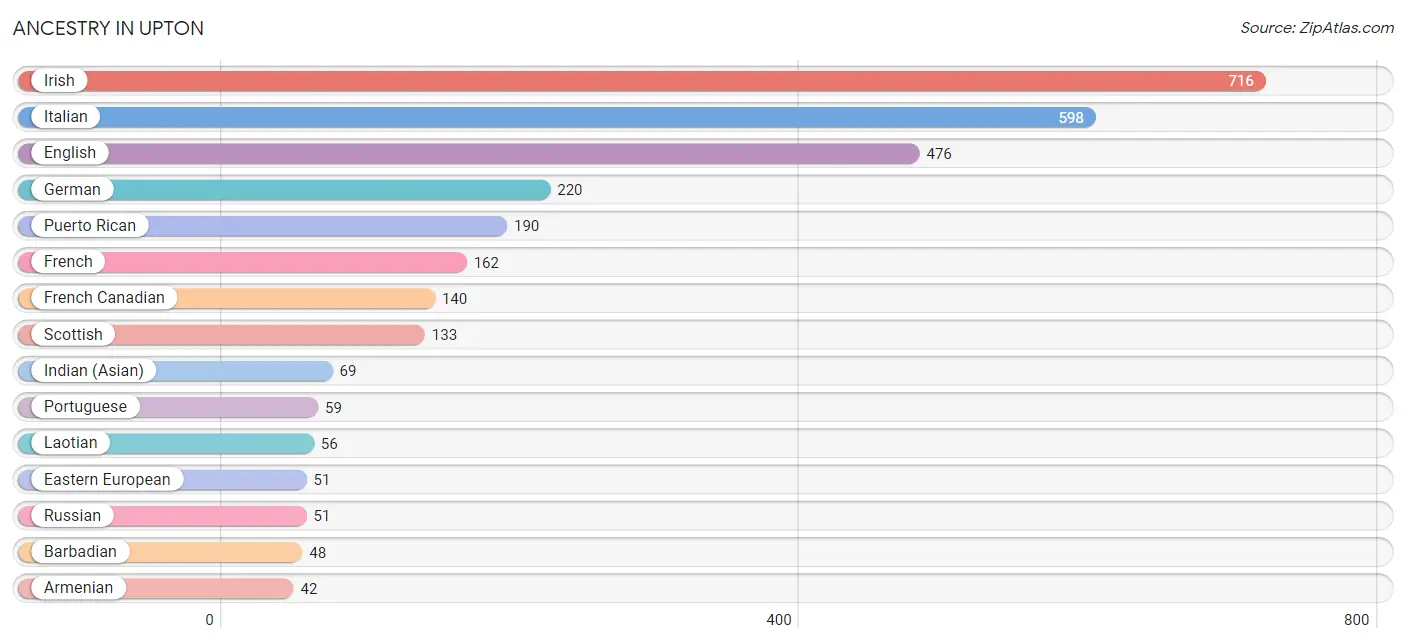
Ancestry in Upton
The most populous ancestries reported in Upton are Irish (716 | 27.6%), Italian (598 | 23.0%), English (476 | 18.3%), German (220 | 8.5%), and Puerto Rican (190 | 7.3%), together accounting for 84.8% of all Upton residents.
| Ancestry | # Population | % Population |
| American | 28 | 1.1% |
| Arab | 11 | 0.4% |
| Armenian | 42 | 1.6% |
| Barbadian | 48 | 1.8% |
| Canadian | 10 | 0.4% |
| Central American | 12 | 0.5% |
| Cuban | 18 | 0.7% |
| Dutch | 14 | 0.5% |
| Eastern European | 51 | 2.0% |
| English | 476 | 18.3% |
| French | 162 | 6.2% |
| French Canadian | 140 | 5.4% |
| German | 220 | 8.5% |
| Greek | 15 | 0.6% |
| Haitian | 3 | 0.1% |
| Indian (Asian) | 69 | 2.7% |
| Irish | 716 | 27.6% |
| Italian | 598 | 23.0% |
| Laotian | 56 | 2.2% |
| Lebanese | 11 | 0.4% |
| Lithuanian | 25 | 1.0% |
| Norwegian | 13 | 0.5% |
| Polish | 16 | 0.6% |
| Portuguese | 59 | 2.3% |
| Puerto Rican | 190 | 7.3% |
| Russian | 51 | 2.0% |
| Salvadoran | 12 | 0.5% |
| Scandinavian | 12 | 0.5% |
| Scottish | 133 | 5.1% |
| Slovak | 13 | 0.5% |
| Subsaharan African | 10 | 0.4% |
| Welsh | 21 | 0.8% | View All 32 Rows |
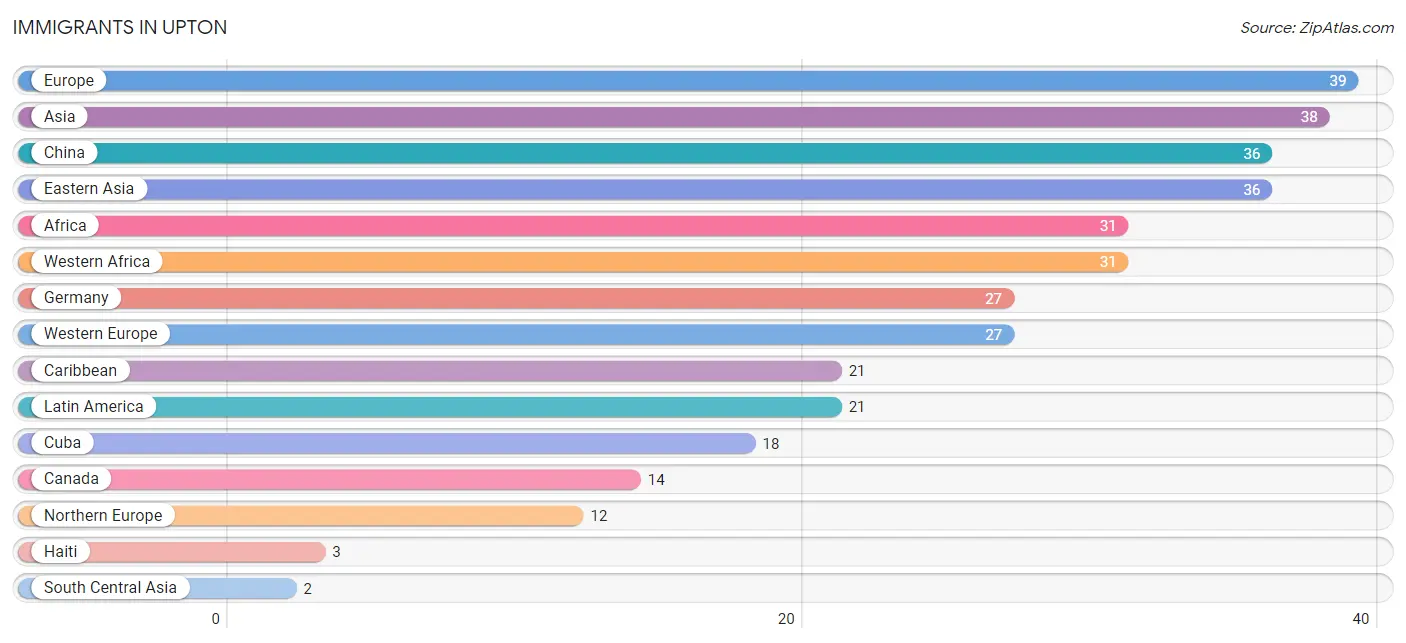
Immigrants in Upton
The most numerous immigrant groups reported in Upton came from Europe (39 | 1.5%), Asia (38 | 1.5%), China (36 | 1.4%), Eastern Asia (36 | 1.4%), and Africa (31 | 1.2%), together accounting for 6.9% of all Upton residents.
| Immigration Origin | # Population | % Population |
| Africa | 31 | 1.2% |
| Asia | 38 | 1.5% |
| Canada | 14 | 0.5% |
| Caribbean | 21 | 0.8% |
| China | 36 | 1.4% |
| Cuba | 18 | 0.7% |
| Eastern Asia | 36 | 1.4% |
| Europe | 39 | 1.5% |
| Germany | 27 | 1.0% |
| Haiti | 3 | 0.1% |
| Latin America | 21 | 0.8% |
| Northern Europe | 12 | 0.5% |
| South Central Asia | 2 | 0.1% |
| Uzbekistan | 2 | 0.1% |
| Western Africa | 31 | 1.2% |
| Western Europe | 27 | 1.0% | View All 16 Rows |
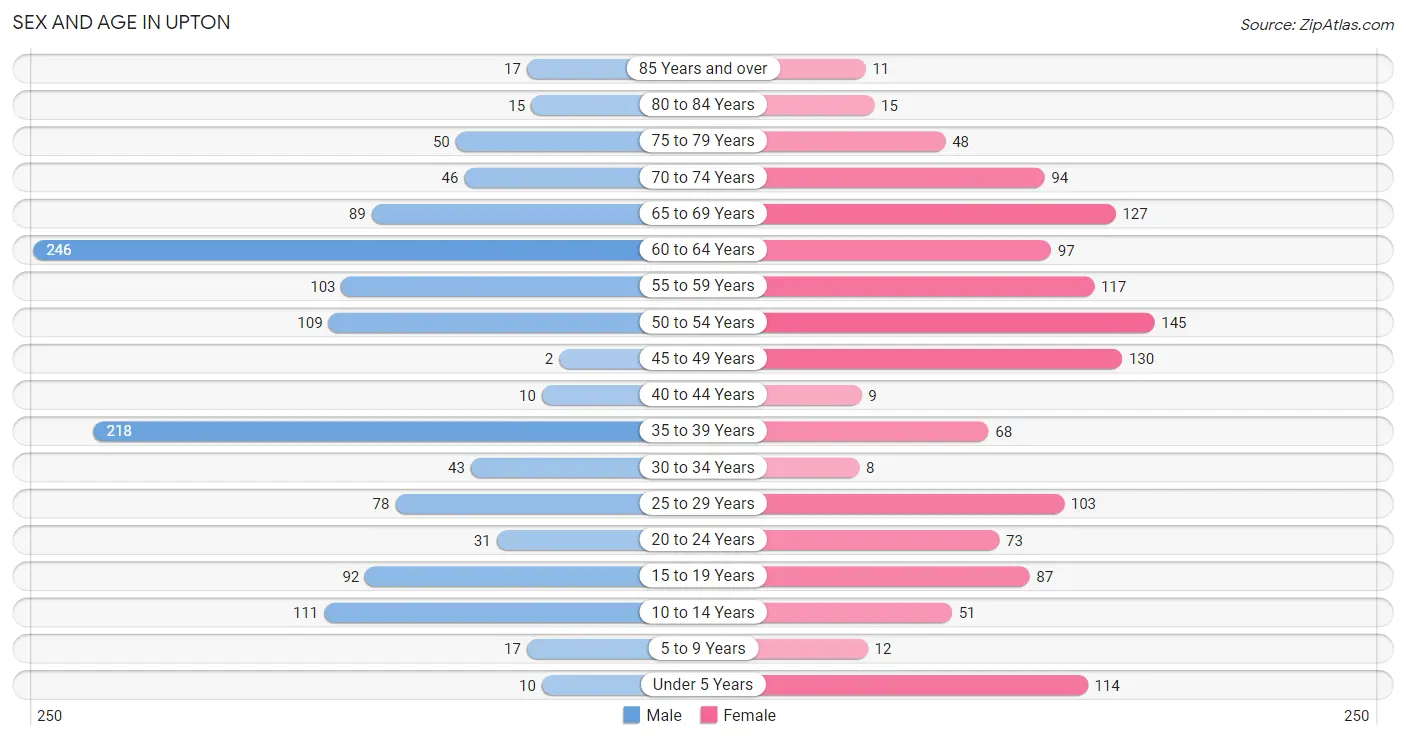
Sex and Age in Upton
Sex and Age in Upton
The most populous age groups in Upton are 60 to 64 Years (246 | 19.1%) for men and 50 to 54 Years (145 | 11.1%) for women.
| Age Bracket | Male | Female |
| Under 5 Years | 10 (0.8%) | 114 (8.7%) |
| 5 to 9 Years | 17 (1.3%) | 12 (0.9%) |
| 10 to 14 Years | 111 (8.6%) | 51 (3.9%) |
| 15 to 19 Years | 92 (7.1%) | 87 (6.7%) |
| 20 to 24 Years | 31 (2.4%) | 73 (5.6%) |
| 25 to 29 Years | 78 (6.1%) | 103 (7.9%) |
| 30 to 34 Years | 43 (3.3%) | 8 (0.6%) |
| 35 to 39 Years | 218 (16.9%) | 68 (5.2%) |
| 40 to 44 Years | 10 (0.8%) | 9 (0.7%) |
| 45 to 49 Years | 2 (0.2%) | 130 (9.9%) |
| 50 to 54 Years | 109 (8.5%) | 145 (11.1%) |
| 55 to 59 Years | 103 (8.0%) | 117 (8.9%) |
| 60 to 64 Years | 246 (19.1%) | 97 (7.4%) |
| 65 to 69 Years | 89 (6.9%) | 127 (9.7%) |
| 70 to 74 Years | 46 (3.6%) | 94 (7.2%) |
| 75 to 79 Years | 50 (3.9%) | 48 (3.7%) |
| 80 to 84 Years | 15 (1.2%) | 15 (1.1%) |
| 85 Years and over | 17 (1.3%) | 11 (0.8%) |
| Total | 1,287 (100.0%) | 1,309 (100.0%) |
Families and Households in Upton
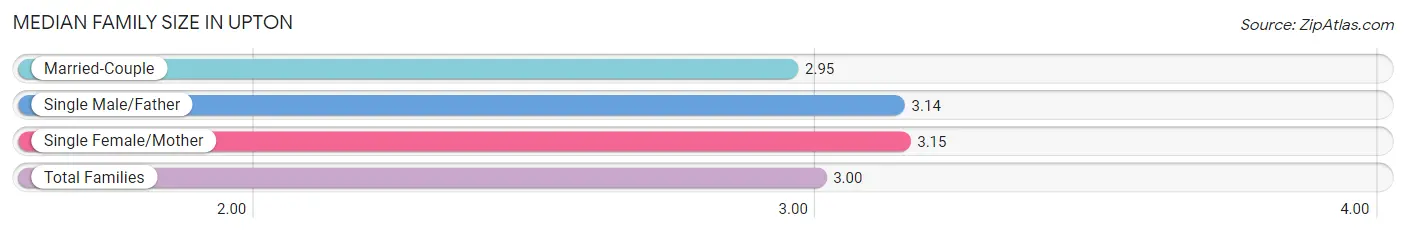
Median Family Size in Upton
The median family size in Upton is 3.00 persons per family, with single female/mother families (132 | 17.2%) accounting for the largest median family size of 3.15 persons per family. On the other hand, married-couple families (565 | 73.6%) represent the smallest median family size with 2.95 persons per family.
| Family Type | # Families | Family Size |
| Married-Couple | 565 (73.6%) | 2.95 |
| Single Male/Father | 71 (9.2%) | 3.14 |
| Single Female/Mother | 132 (17.2%) | 3.15 |
| Total Families | 768 (100.0%) | 3.00 |
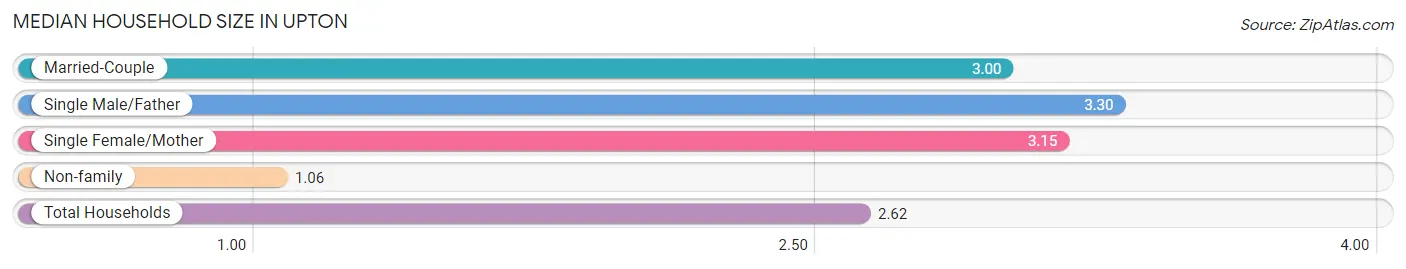
Median Household Size in Upton
The median household size in Upton is 2.62 persons per household, with single male/father households (71 | 7.2%) accounting for the largest median household size of 3.3 persons per household. non-family households (217 | 22.0%) represent the smallest median household size with 1.06 persons per household.
| Household Type | # Households | Household Size |
| Married-Couple | 565 (57.4%) | 3.00 |
| Single Male/Father | 71 (7.2%) | 3.30 |
| Single Female/Mother | 132 (13.4%) | 3.15 |
| Non-family | 217 (22.0%) | 1.06 |
| Total Households | 985 (100.0%) | 2.62 |
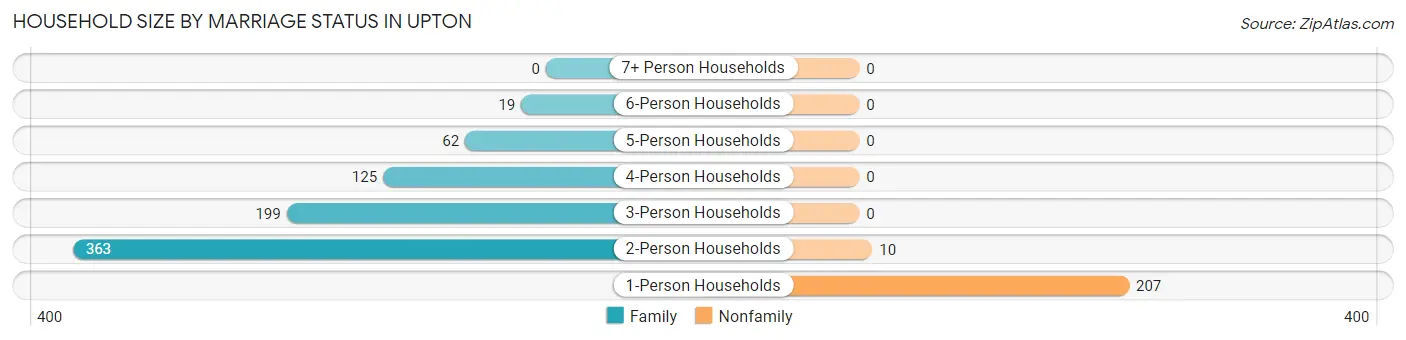
Household Size by Marriage Status in Upton
Out of a total of 985 households in Upton, 768 (78.0%) are family households, while 217 (22.0%) are nonfamily households. The most numerous type of family households are 2-person households, comprising 363, and the most common type of nonfamily households are 1-person households, comprising 207.
| Household Size | Family Households | Nonfamily Households |
| 1-Person Households | - | 207 (21.0%) |
| 2-Person Households | 363 (36.8%) | 10 (1.0%) |
| 3-Person Households | 199 (20.2%) | 0 (0.0%) |
| 4-Person Households | 125 (12.7%) | 0 (0.0%) |
| 5-Person Households | 62 (6.3%) | 0 (0.0%) |
| 6-Person Households | 19 (1.9%) | 0 (0.0%) |
| 7+ Person Households | 0 (0.0%) | 0 (0.0%) |
| Total | 768 (78.0%) | 217 (22.0%) |
Female Fertility in Upton
Fertility by Age in Upton
| Age Bracket | Women with Births | Births / 1,000 Women |
| 15 to 19 years | 0 (0.0%) | 0.0 |
| 20 to 34 years | 0 (0.0%) | 0.0 |
| 35 to 50 years | 0 (0.0%) | 0.0 |
| Total | 0 (0.0%) | 0.0 |
Fertility by Age by Marriage Status in Upton
| Age Bracket | Married | Unmarried |
| 15 to 19 years | 0 (0.0%) | 0 (0.0%) |
| 20 to 34 years | 0 (0.0%) | 0 (0.0%) |
| 35 to 50 years | 0 (0.0%) | 0 (0.0%) |
| Total | 0 (0.0%) | 0 (0.0%) |
Fertility by Education in Upton
| Educational Attainment | Women with Births | Births / 1,000 Women |
| Less than High School | 0 (0.0%) | 0.0 |
| High School Diploma | 0 (0.0%) | 0.0 |
| College or Associate's Degree | 0 (0.0%) | 0.0 |
| Bachelor's Degree | 0 (0.0%) | 0.0 |
| Graduate Degree | 0 (0.0%) | 0.0 |
| Total | 0 (0.0%) | 0.0 |
Fertility by Education by Marriage Status in Upton
| Educational Attainment | Married | Unmarried |
| Less than High School | 0 (0.0%) | 0 (0.0%) |
| High School Diploma | 0 (0.0%) | 0 (0.0%) |
| College or Associate's Degree | 0 (0.0%) | 0 (0.0%) |
| Bachelor's Degree | 0 (0.0%) | 0 (0.0%) |
| Graduate Degree | 0 (0.0%) | 0 (0.0%) |
| Total | 0 (0.0%) | 0 (0.0%) |
Employment Characteristics in Upton
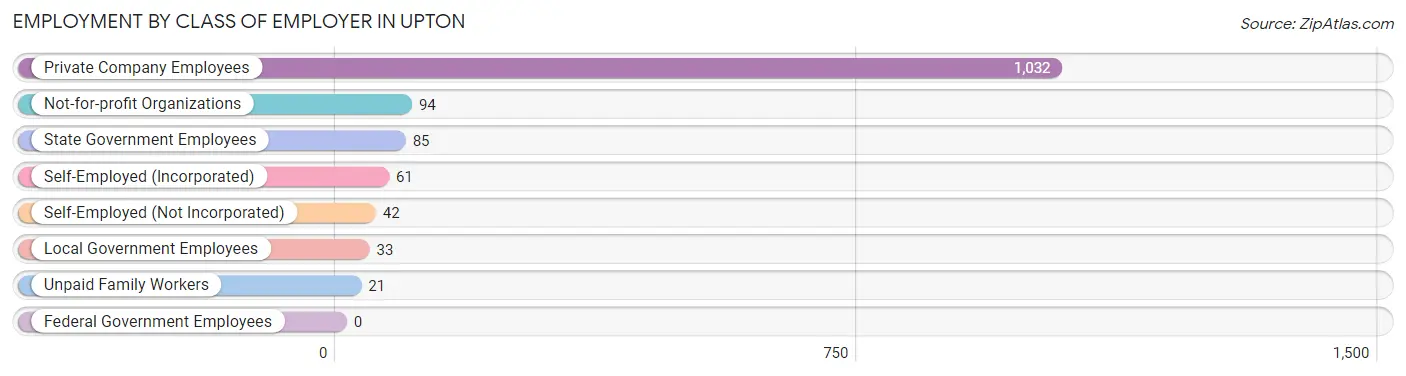
Employment by Class of Employer in Upton
Among the 1,368 employed individuals in Upton, private company employees (1,032 | 75.4%), not-for-profit organizations (94 | 6.9%), and state government employees (85 | 6.2%) make up the most common classes of employment.
| Employer Class | # Employees | % Employees |
| Private Company Employees | 1,032 | 75.4% |
| Self-Employed (Incorporated) | 61 | 4.5% |
| Self-Employed (Not Incorporated) | 42 | 3.1% |
| Not-for-profit Organizations | 94 | 6.9% |
| Local Government Employees | 33 | 2.4% |
| State Government Employees | 85 | 6.2% |
| Federal Government Employees | 0 | 0.0% |
| Unpaid Family Workers | 21 | 1.5% |
| Total | 1,368 | 100.0% |
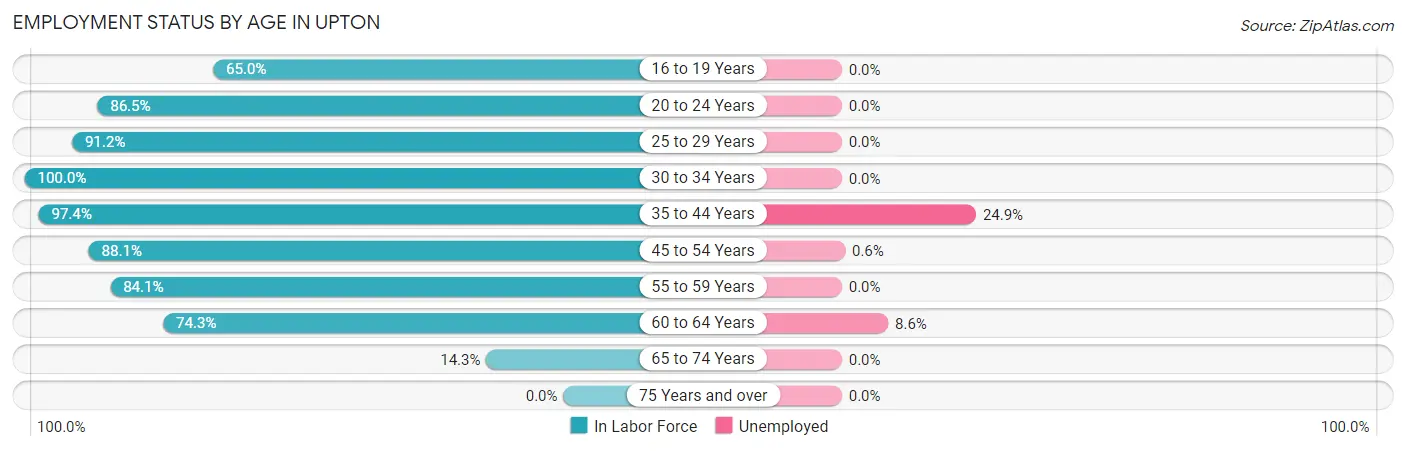
Employment Status by Age in Upton
According to the labor force statistics for Upton, out of the total population over 16 years of age (2,262), 68.0% or 1,538 individuals are in the labor force, with 6.4% or 98 of them unemployed. The age group with the highest labor force participation rate is 30 to 34 years, with 100.0% or 51 individuals in the labor force. Within the labor force, the 35 to 44 years age range has the highest percentage of unemployed individuals, with 24.9% or 74 of them being unemployed.
| Age Bracket | In Labor Force | Unemployed |
| 16 to 19 Years | 104 (65.0%) | 0 (0.0%) |
| 20 to 24 Years | 90 (86.5%) | 0 (0.0%) |
| 25 to 29 Years | 165 (91.2%) | 0 (0.0%) |
| 30 to 34 Years | 51 (100.0%) | 0 (0.0%) |
| 35 to 44 Years | 297 (97.4%) | 74 (24.9%) |
| 45 to 54 Years | 340 (88.1%) | 2 (0.6%) |
| 55 to 59 Years | 185 (84.1%) | 0 (0.0%) |
| 60 to 64 Years | 255 (74.3%) | 22 (8.6%) |
| 65 to 74 Years | 51 (14.3%) | 0 (0.0%) |
| 75 Years and over | 0 (0.0%) | 0 (0.0%) |
| Total | 1,538 (68.0%) | 98 (6.4%) |
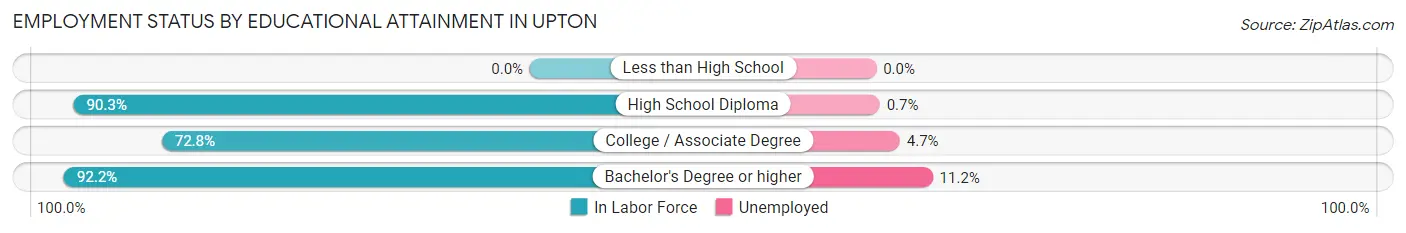
Employment Status by Educational Attainment in Upton
According to labor force statistics for Upton, 87.0% of individuals (1,293) out of the total population between 25 and 64 years of age (1,486) are in the labor force, with 7.6% or 98 of them being unemployed. The group with the highest labor force participation rate are those with the educational attainment of bachelor's degree or higher, with 92.2% or 749 individuals in the labor force. Within the labor force, individuals with bachelor's degree or higher education have the highest percentage of unemployment, with 11.2% or 84 of them being unemployed.
| Educational Attainment | In Labor Force | Unemployed |
| Less than High School | 0 (0.0%) | 0 (0.0%) |
| High School Diploma | 287 (90.3%) | 2 (0.7%) |
| College / Associate Degree | 257 (72.8%) | 17 (4.7%) |
| Bachelor's Degree or higher | 749 (92.2%) | 91 (11.2%) |
| Total | 1,293 (87.0%) | 113 (7.6%) |
Employment Occupations by Sex in Upton
Management, Business, Science and Arts Occupations
The most common Management, Business, Science and Arts occupations in Upton are Management (255 | 17.7%), Community & Social Service (197 | 13.7%), Education Instruction & Library (96 | 6.7%), Computers, Engineering & Science (89 | 6.2%), and Business & Financial (81 | 5.6%).
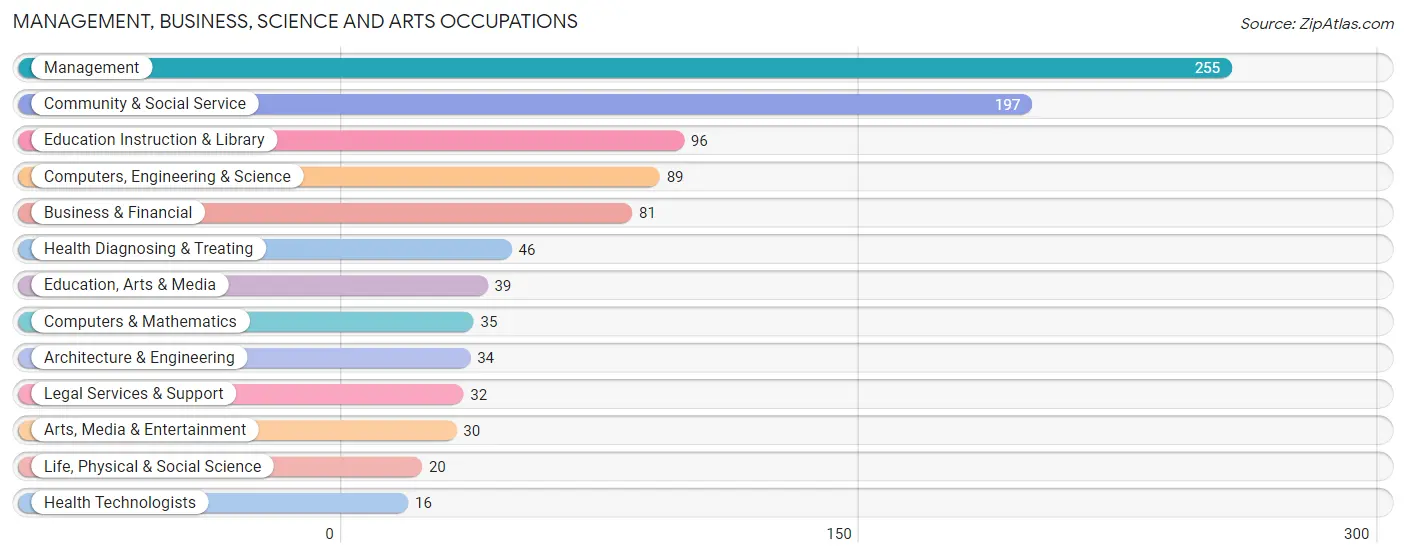
Management, Business, Science and Arts Occupations by Sex
Within the Management, Business, Science and Arts occupations in Upton, the most male-oriented occupations are Computers & Mathematics (100.0%), Architecture & Engineering (100.0%), and Legal Services & Support (100.0%), while the most female-oriented occupations are Life, Physical & Social Science (100.0%), Arts, Media & Entertainment (100.0%), and Education, Arts & Media (94.9%).
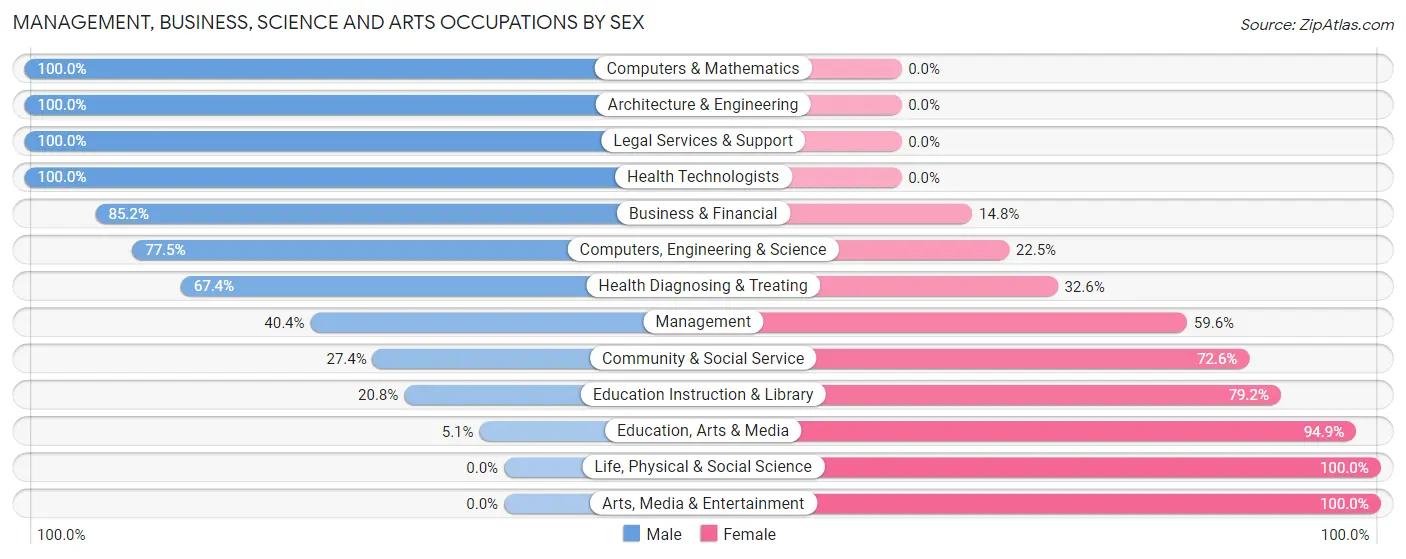
| Occupation | Male | Female |
| Management | 103 (40.4%) | 152 (59.6%) |
| Business & Financial | 69 (85.2%) | 12 (14.8%) |
| Computers, Engineering & Science | 69 (77.5%) | 20 (22.5%) |
| Computers & Mathematics | 35 (100.0%) | 0 (0.0%) |
| Architecture & Engineering | 34 (100.0%) | 0 (0.0%) |
| Life, Physical & Social Science | 0 (0.0%) | 20 (100.0%) |
| Community & Social Service | 54 (27.4%) | 143 (72.6%) |
| Education, Arts & Media | 2 (5.1%) | 37 (94.9%) |
| Legal Services & Support | 32 (100.0%) | 0 (0.0%) |
| Education Instruction & Library | 20 (20.8%) | 76 (79.2%) |
| Arts, Media & Entertainment | 0 (0.0%) | 30 (100.0%) |
| Health Diagnosing & Treating | 31 (67.4%) | 15 (32.6%) |
| Health Technologists | 16 (100.0%) | 0 (0.0%) |
| Total (Category) | 326 (48.8%) | 342 (51.2%) |
| Total (Overall) | 769 (53.4%) | 671 (46.6%) |
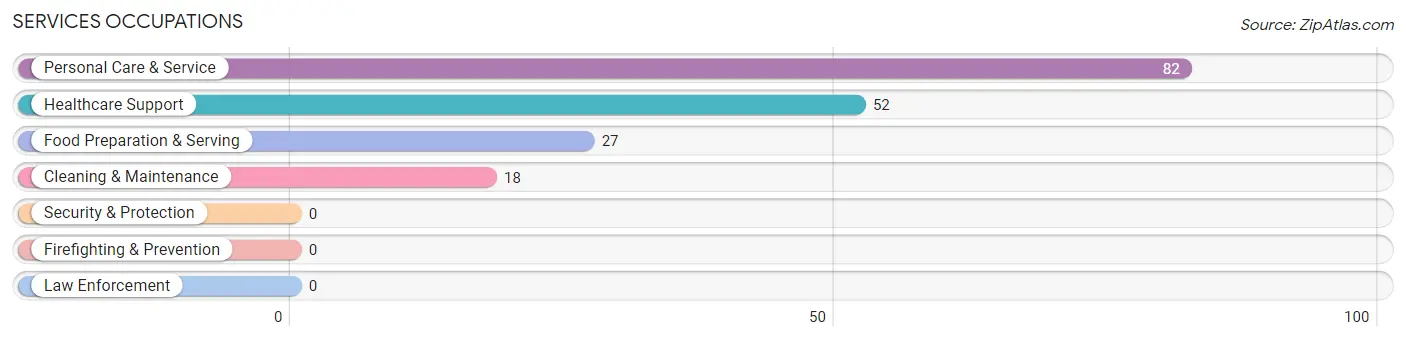
Services Occupations
The most common Services occupations in Upton are Personal Care & Service (82 | 5.7%), Healthcare Support (52 | 3.6%), Food Preparation & Serving (27 | 1.9%), and Cleaning & Maintenance (18 | 1.3%).
Services Occupations by Sex
Within the Services occupations in Upton, the most male-oriented occupations are Food Preparation & Serving (100.0%), and Personal Care & Service (18.3%), while the most female-oriented occupations are Healthcare Support (100.0%), Cleaning & Maintenance (100.0%), and Personal Care & Service (81.7%).
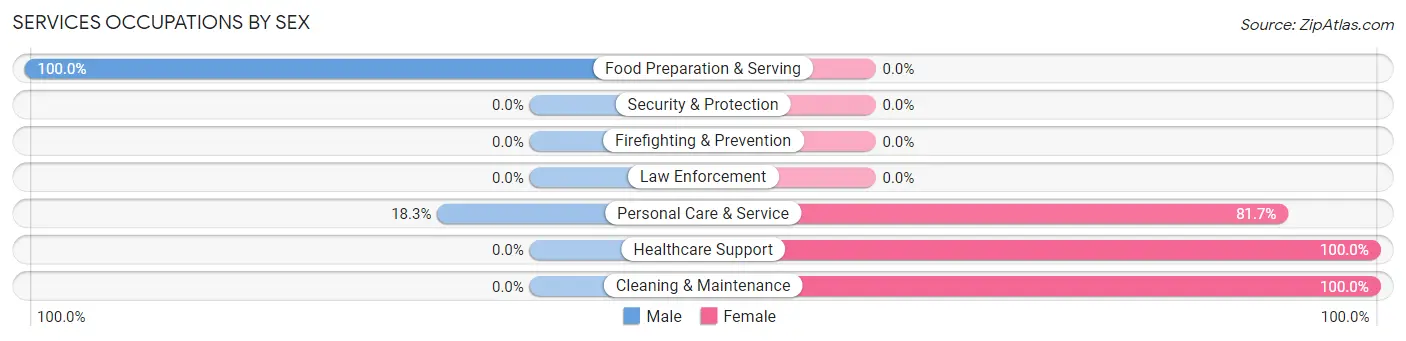
| Occupation | Male | Female |
| Healthcare Support | 0 (0.0%) | 52 (100.0%) |
| Security & Protection | 0 (0.0%) | 0 (0.0%) |
| Firefighting & Prevention | 0 (0.0%) | 0 (0.0%) |
| Law Enforcement | 0 (0.0%) | 0 (0.0%) |
| Food Preparation & Serving | 27 (100.0%) | 0 (0.0%) |
| Cleaning & Maintenance | 0 (0.0%) | 18 (100.0%) |
| Personal Care & Service | 15 (18.3%) | 67 (81.7%) |
| Total (Category) | 42 (23.5%) | 137 (76.5%) |
| Total (Overall) | 769 (53.4%) | 671 (46.6%) |
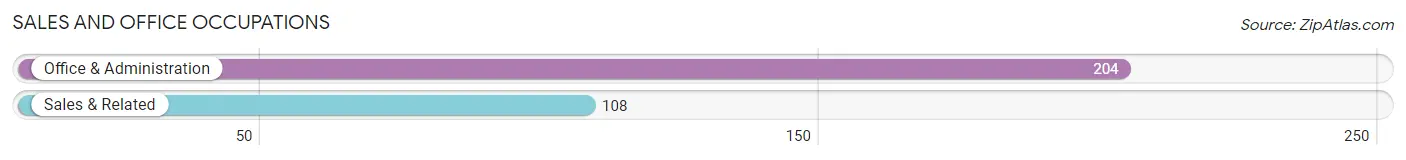
Sales and Office Occupations
The most common Sales and Office occupations in Upton are Office & Administration (204 | 14.2%), and Sales & Related (108 | 7.5%).
Sales and Office Occupations by Sex
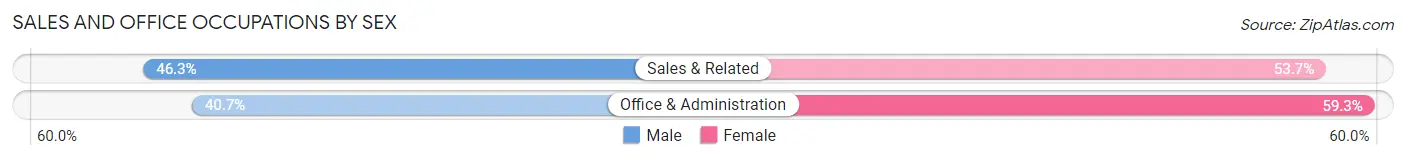
| Occupation | Male | Female |
| Sales & Related | 50 (46.3%) | 58 (53.7%) |
| Office & Administration | 83 (40.7%) | 121 (59.3%) |
| Total (Category) | 133 (42.6%) | 179 (57.4%) |
| Total (Overall) | 769 (53.4%) | 671 (46.6%) |
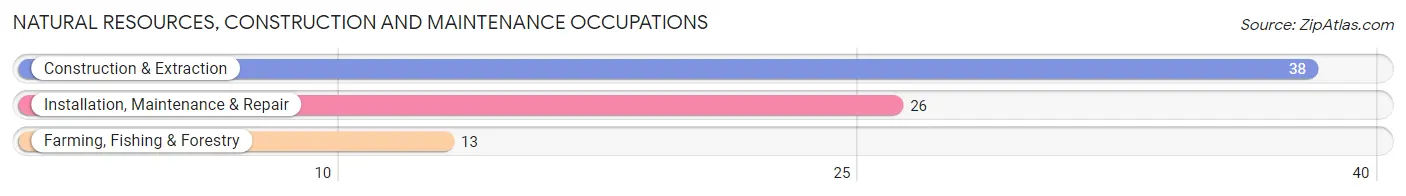
Natural Resources, Construction and Maintenance Occupations
The most common Natural Resources, Construction and Maintenance occupations in Upton are Construction & Extraction (38 | 2.6%), Installation, Maintenance & Repair (26 | 1.8%), and Farming, Fishing & Forestry (13 | 0.9%).
Natural Resources, Construction and Maintenance Occupations by Sex
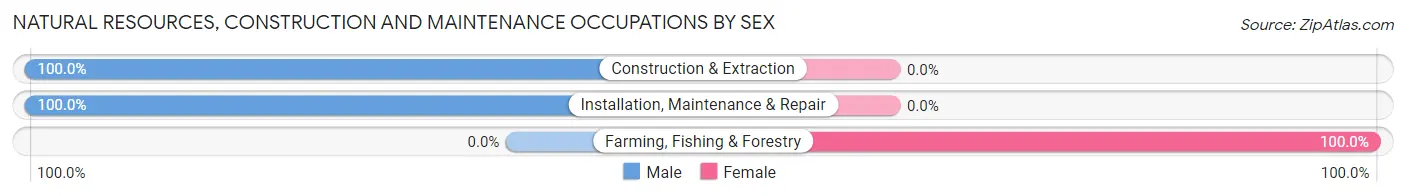
| Occupation | Male | Female |
| Farming, Fishing & Forestry | 0 (0.0%) | 13 (100.0%) |
| Construction & Extraction | 38 (100.0%) | 0 (0.0%) |
| Installation, Maintenance & Repair | 26 (100.0%) | 0 (0.0%) |
| Total (Category) | 64 (83.1%) | 13 (16.9%) |
| Total (Overall) | 769 (53.4%) | 671 (46.6%) |
Production, Transportation and Moving Occupations
The most common Production, Transportation and Moving occupations in Upton are Transportation (129 | 9.0%), Production (56 | 3.9%), and Material Moving (19 | 1.3%).
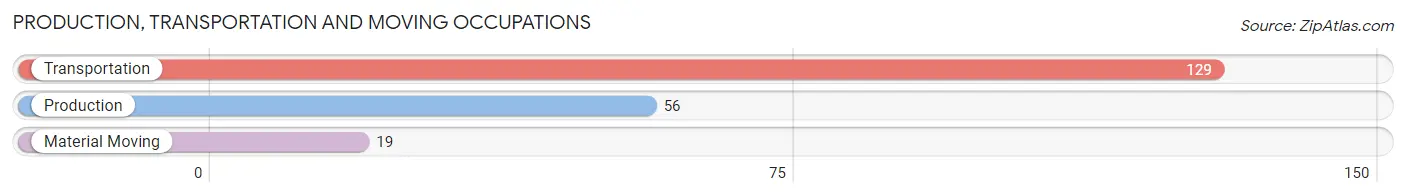
Production, Transportation and Moving Occupations by Sex
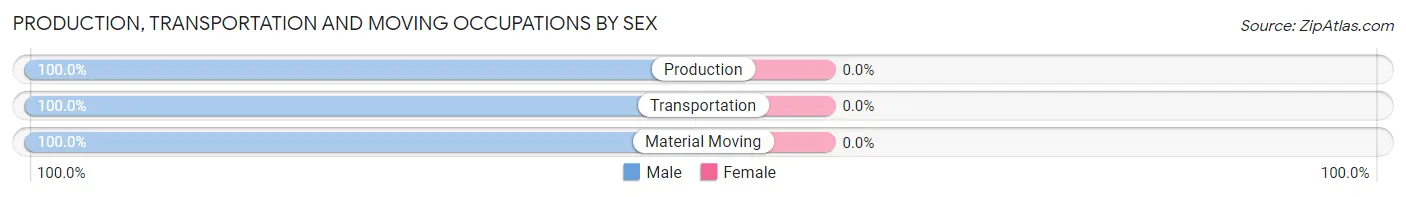
| Occupation | Male | Female |
| Production | 56 (100.0%) | 0 (0.0%) |
| Transportation | 129 (100.0%) | 0 (0.0%) |
| Material Moving | 19 (100.0%) | 0 (0.0%) |
| Total (Category) | 204 (100.0%) | 0 (0.0%) |
| Total (Overall) | 769 (53.4%) | 671 (46.6%) |
Employment Industries by Sex in Upton
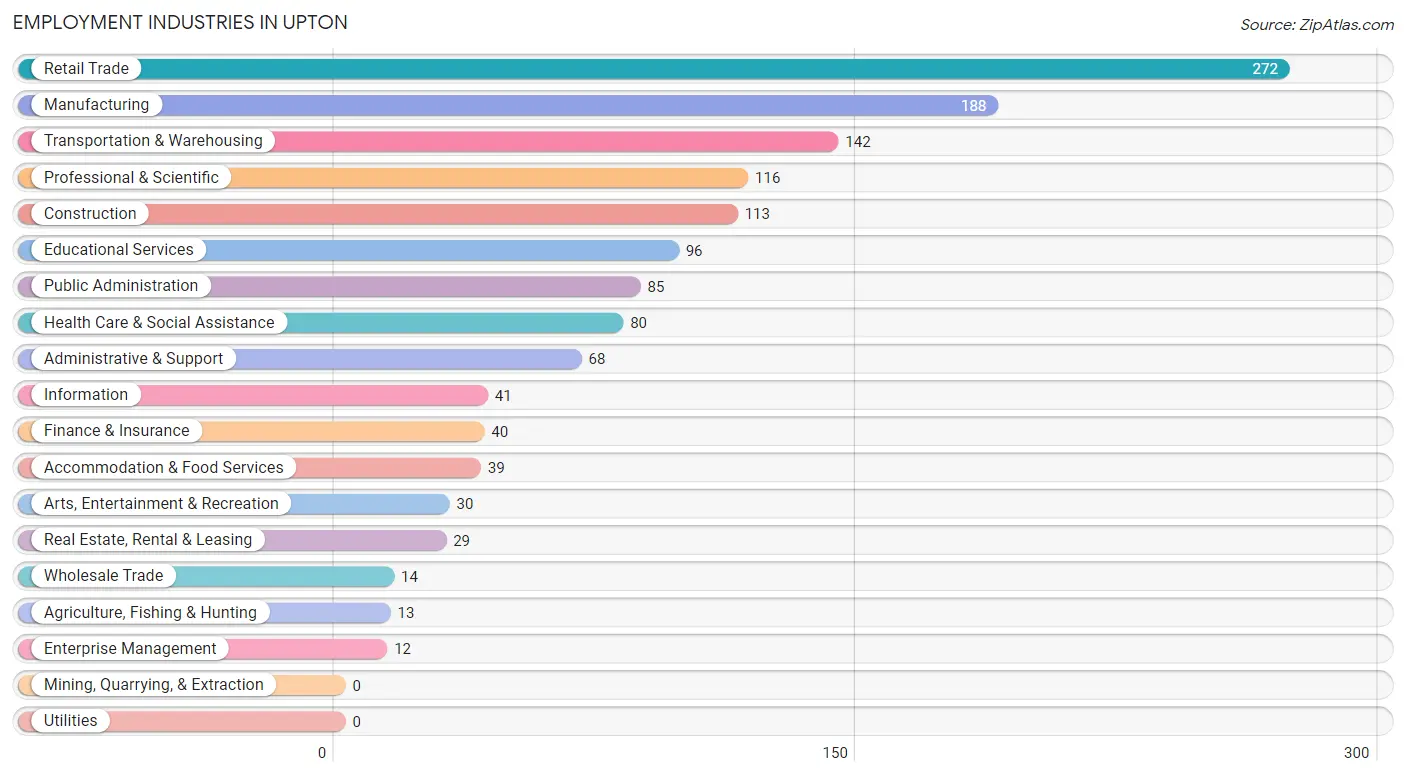
Employment Industries in Upton
The major employment industries in Upton include Retail Trade (272 | 18.9%), Manufacturing (188 | 13.1%), Transportation & Warehousing (142 | 9.9%), Professional & Scientific (116 | 8.1%), and Construction (113 | 7.9%).
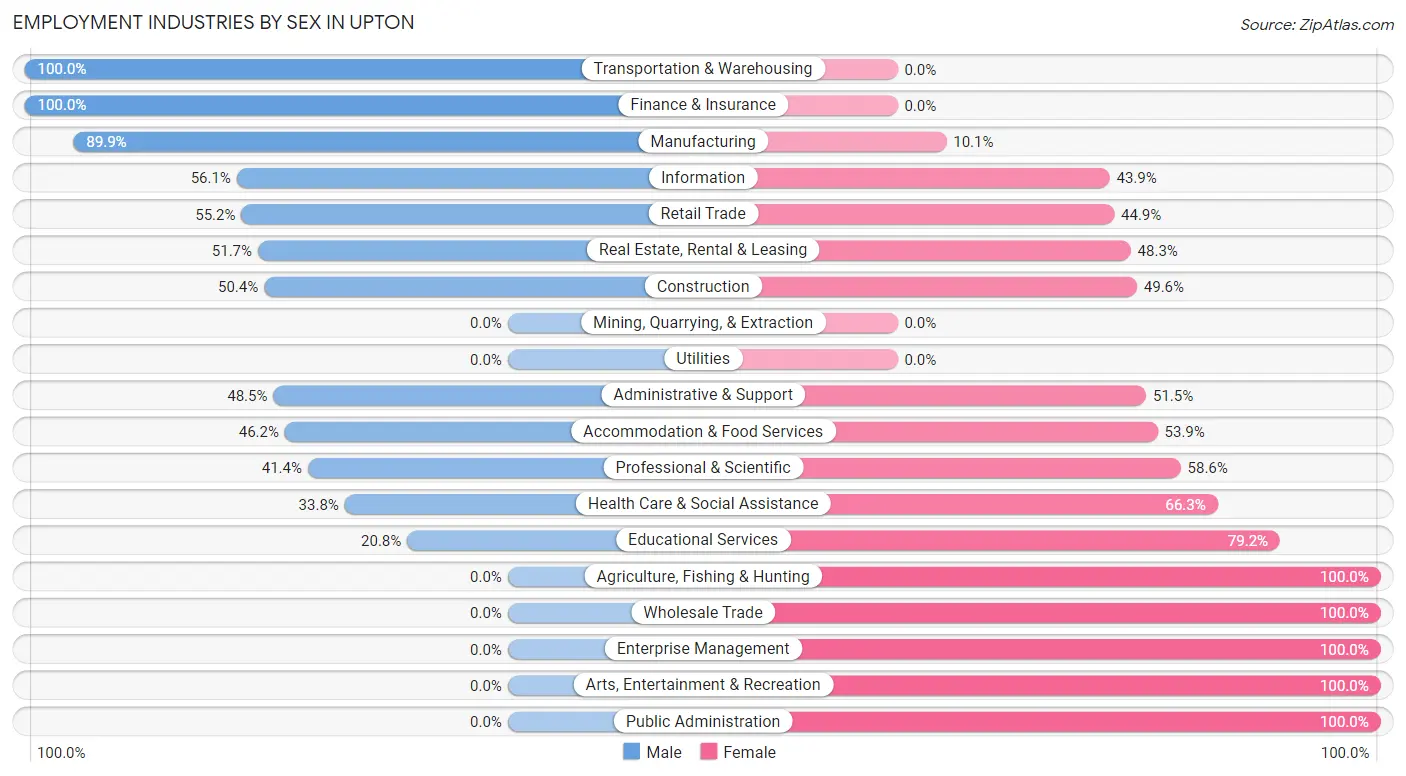
Employment Industries by Sex in Upton
The Upton industries that see more men than women are Transportation & Warehousing (100.0%), Finance & Insurance (100.0%), and Manufacturing (89.9%), whereas the industries that tend to have a higher number of women are Agriculture, Fishing & Hunting (100.0%), Wholesale Trade (100.0%), and Enterprise Management (100.0%).
| Industry | Male | Female |
| Agriculture, Fishing & Hunting | 0 (0.0%) | 13 (100.0%) |
| Mining, Quarrying, & Extraction | 0 (0.0%) | 0 (0.0%) |
| Construction | 57 (50.4%) | 56 (49.6%) |
| Manufacturing | 169 (89.9%) | 19 (10.1%) |
| Wholesale Trade | 0 (0.0%) | 14 (100.0%) |
| Retail Trade | 150 (55.1%) | 122 (44.9%) |
| Transportation & Warehousing | 142 (100.0%) | 0 (0.0%) |
| Utilities | 0 (0.0%) | 0 (0.0%) |
| Information | 23 (56.1%) | 18 (43.9%) |
| Finance & Insurance | 40 (100.0%) | 0 (0.0%) |
| Real Estate, Rental & Leasing | 15 (51.7%) | 14 (48.3%) |
| Professional & Scientific | 48 (41.4%) | 68 (58.6%) |
| Enterprise Management | 0 (0.0%) | 12 (100.0%) |
| Administrative & Support | 33 (48.5%) | 35 (51.5%) |
| Educational Services | 20 (20.8%) | 76 (79.2%) |
| Health Care & Social Assistance | 27 (33.8%) | 53 (66.2%) |
| Arts, Entertainment & Recreation | 0 (0.0%) | 30 (100.0%) |
| Accommodation & Food Services | 18 (46.2%) | 21 (53.8%) |
| Public Administration | 0 (0.0%) | 85 (100.0%) |
| Total | 769 (53.4%) | 671 (46.6%) |
Education in Upton
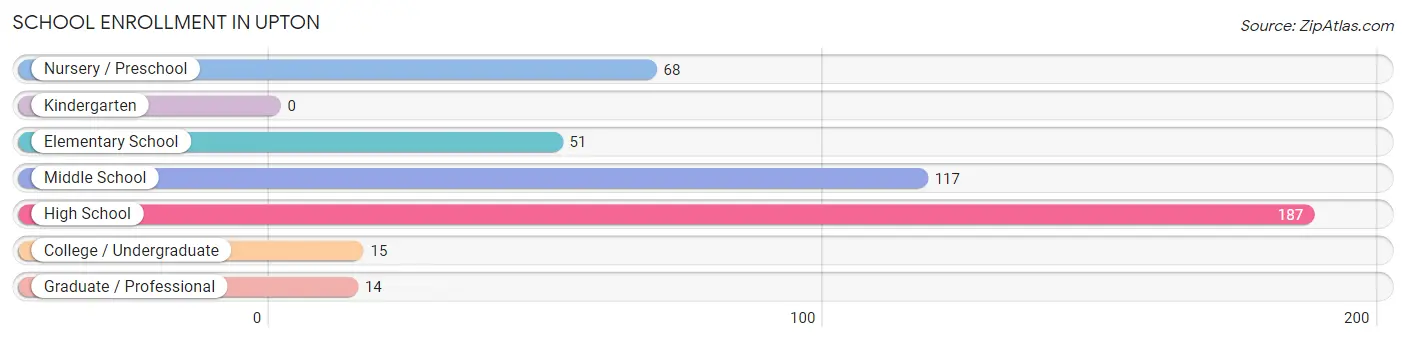
School Enrollment in Upton
The most common levels of schooling among the 452 students in Upton are high school (187 | 41.4%), middle school (117 | 25.9%), and nursery / preschool (68 | 15.0%).
| School Level | # Students | % Students |
| Nursery / Preschool | 68 | 15.0% |
| Kindergarten | 0 | 0.0% |
| Elementary School | 51 | 11.3% |
| Middle School | 117 | 25.9% |
| High School | 187 | 41.4% |
| College / Undergraduate | 15 | 3.3% |
| Graduate / Professional | 14 | 3.1% |
| Total | 452 | 100.0% |
School Enrollment by Age by Funding Source in Upton
Out of a total of 452 students who are enrolled in schools in Upton, 80 (17.7%) attend a private institution, while the remaining 372 (82.3%) are enrolled in public schools. The age group of 3 to 4 year olds has the highest likelihood of being enrolled in private schools, with 68 (100.0% in the age bracket) enrolled. Conversely, the age group of 10 to 14 year olds has the lowest likelihood of being enrolled in a private school, with 162 (100.0% in the age bracket) attending a public institution.
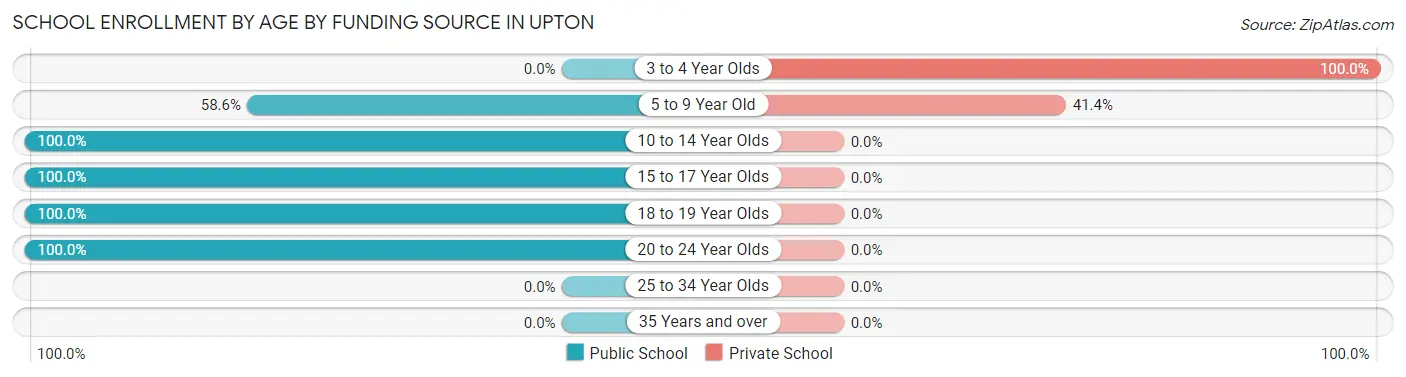
| Age Bracket | Public School | Private School |
| 3 to 4 Year Olds | 0 (0.0%) | 68 (100.0%) |
| 5 to 9 Year Old | 17 (58.6%) | 12 (41.4%) |
| 10 to 14 Year Olds | 162 (100.0%) | 0 (0.0%) |
| 15 to 17 Year Olds | 92 (100.0%) | 0 (0.0%) |
| 18 to 19 Year Olds | 87 (100.0%) | 0 (0.0%) |
| 20 to 24 Year Olds | 14 (100.0%) | 0 (0.0%) |
| 25 to 34 Year Olds | 0 (0.0%) | 0 (0.0%) |
| 35 Years and over | 0 (0.0%) | 0 (0.0%) |
| Total | 372 (82.3%) | 80 (17.7%) |
Educational Attainment by Field of Study in Upton
Physical & health sciences (173 | 15.1%), business (148 | 12.9%), psychology (141 | 12.3%), computers & mathematics (93 | 8.1%), and science & technology (92 | 8.0%) are the most common fields of study among 1,147 individuals in Upton who have obtained a bachelor's degree or higher.
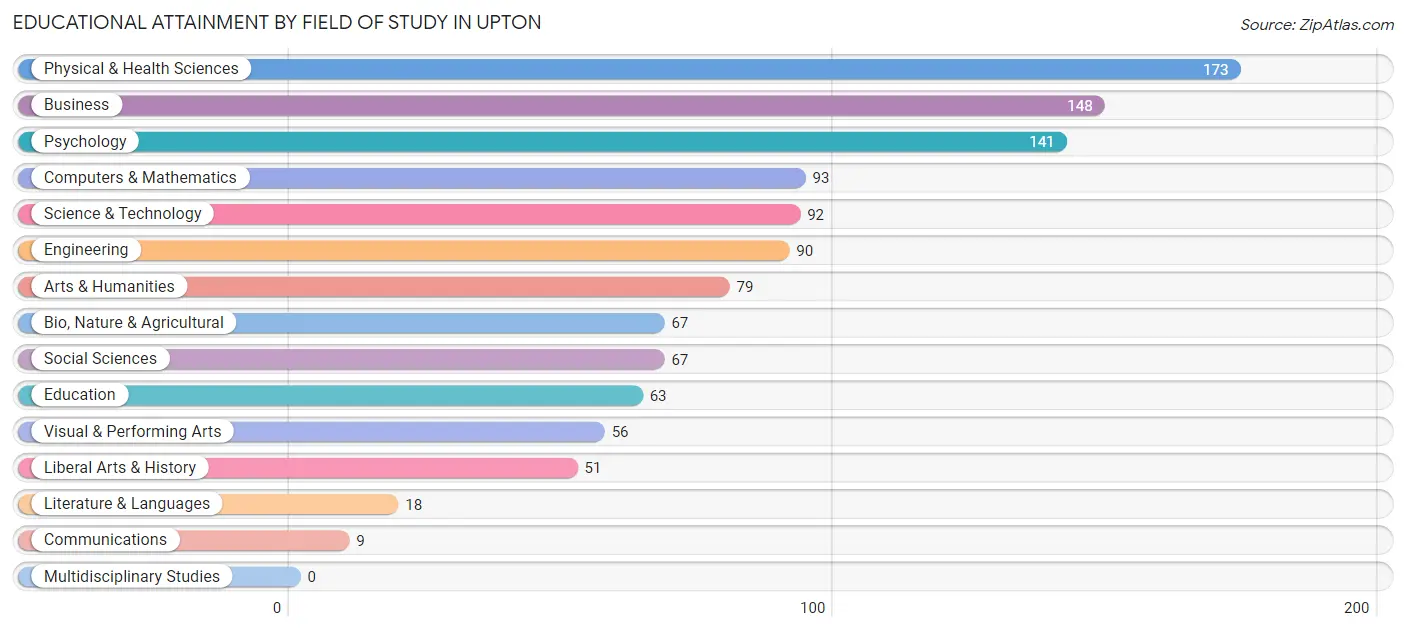
| Field of Study | # Graduates | % Graduates |
| Computers & Mathematics | 93 | 8.1% |
| Bio, Nature & Agricultural | 67 | 5.8% |
| Physical & Health Sciences | 173 | 15.1% |
| Psychology | 141 | 12.3% |
| Social Sciences | 67 | 5.8% |
| Engineering | 90 | 7.9% |
| Multidisciplinary Studies | 0 | 0.0% |
| Science & Technology | 92 | 8.0% |
| Business | 148 | 12.9% |
| Education | 63 | 5.5% |
| Literature & Languages | 18 | 1.6% |
| Liberal Arts & History | 51 | 4.4% |
| Visual & Performing Arts | 56 | 4.9% |
| Communications | 9 | 0.8% |
| Arts & Humanities | 79 | 6.9% |
| Total | 1,147 | 100.0% |
Transportation & Commute in Upton
Vehicle Availability by Sex in Upton
The most prevalent vehicle ownership categories in Upton are males with 3 vehicles (303, accounting for 42.7%) and females with 3 vehicles (323, making up 46.2%).
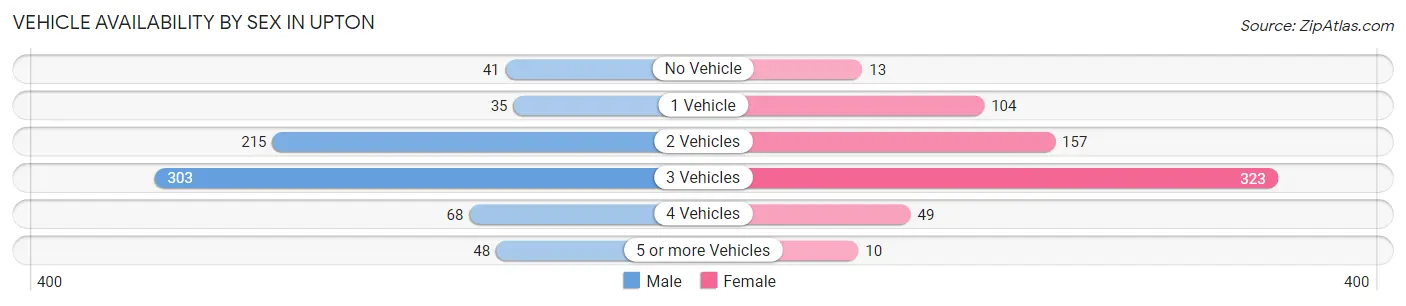
| Vehicles Available | Male | Female |
| No Vehicle | 41 (5.8%) | 13 (2.0%) |
| 1 Vehicle | 35 (4.9%) | 104 (15.9%) |
| 2 Vehicles | 215 (30.3%) | 157 (23.9%) |
| 3 Vehicles | 303 (42.7%) | 323 (49.2%) |
| 4 Vehicles | 68 (9.6%) | 49 (7.5%) |
| 5 or more Vehicles | 48 (6.8%) | 10 (1.5%) |
| Total | 710 (100.0%) | 656 (100.0%) |
Commute Time in Upton
The most frequently occuring commute durations in Upton are 45 to 59 minutes (230 commuters, 20.3%), 15 to 19 minutes (162 commuters, 14.3%), and 30 to 34 minutes (156 commuters, 13.8%).
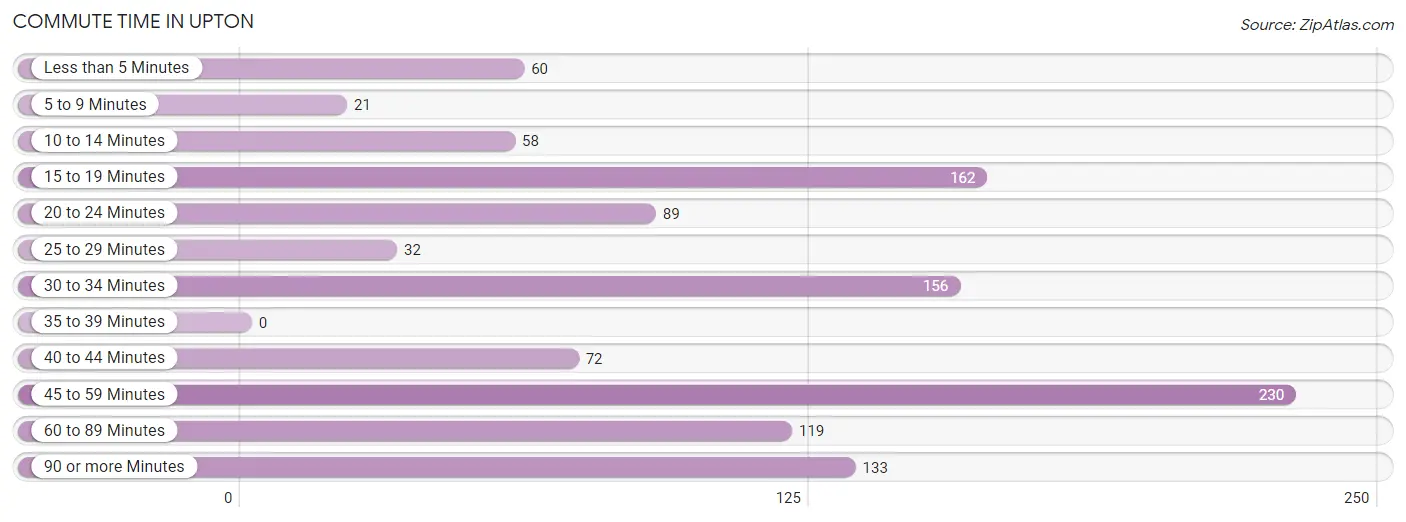
| Commute Time | # Commuters | % Commuters |
| Less than 5 Minutes | 60 | 5.3% |
| 5 to 9 Minutes | 21 | 1.9% |
| 10 to 14 Minutes | 58 | 5.1% |
| 15 to 19 Minutes | 162 | 14.3% |
| 20 to 24 Minutes | 89 | 7.9% |
| 25 to 29 Minutes | 32 | 2.8% |
| 30 to 34 Minutes | 156 | 13.8% |
| 35 to 39 Minutes | 0 | 0.0% |
| 40 to 44 Minutes | 72 | 6.4% |
| 45 to 59 Minutes | 230 | 20.3% |
| 60 to 89 Minutes | 119 | 10.5% |
| 90 or more Minutes | 133 | 11.7% |
Commute Time by Sex in Upton
The most common commute times in Upton are 45 to 59 minutes (153 commuters, 26.0%) for males and 30 to 34 minutes (128 commuters, 23.6%) for females.
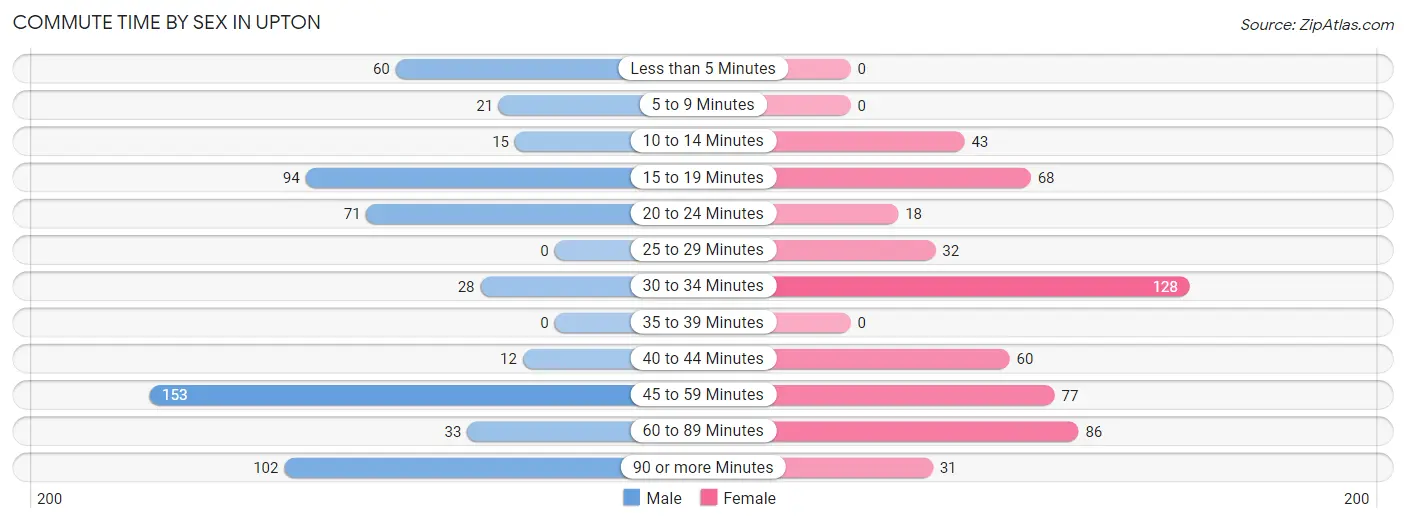
| Commute Time | Male | Female |
| Less than 5 Minutes | 60 (10.2%) | 0 (0.0%) |
| 5 to 9 Minutes | 21 (3.6%) | 0 (0.0%) |
| 10 to 14 Minutes | 15 (2.5%) | 43 (7.9%) |
| 15 to 19 Minutes | 94 (16.0%) | 68 (12.5%) |
| 20 to 24 Minutes | 71 (12.0%) | 18 (3.3%) |
| 25 to 29 Minutes | 0 (0.0%) | 32 (5.9%) |
| 30 to 34 Minutes | 28 (4.8%) | 128 (23.6%) |
| 35 to 39 Minutes | 0 (0.0%) | 0 (0.0%) |
| 40 to 44 Minutes | 12 (2.0%) | 60 (11.1%) |
| 45 to 59 Minutes | 153 (26.0%) | 77 (14.2%) |
| 60 to 89 Minutes | 33 (5.6%) | 86 (15.8%) |
| 90 or more Minutes | 102 (17.3%) | 31 (5.7%) |
Time of Departure to Work by Sex in Upton
The most frequent times of departure to work in Upton are 7:00 AM to 7:29 AM (98, 16.6%) for males and 7:00 AM to 7:29 AM (137, 25.2%) for females.
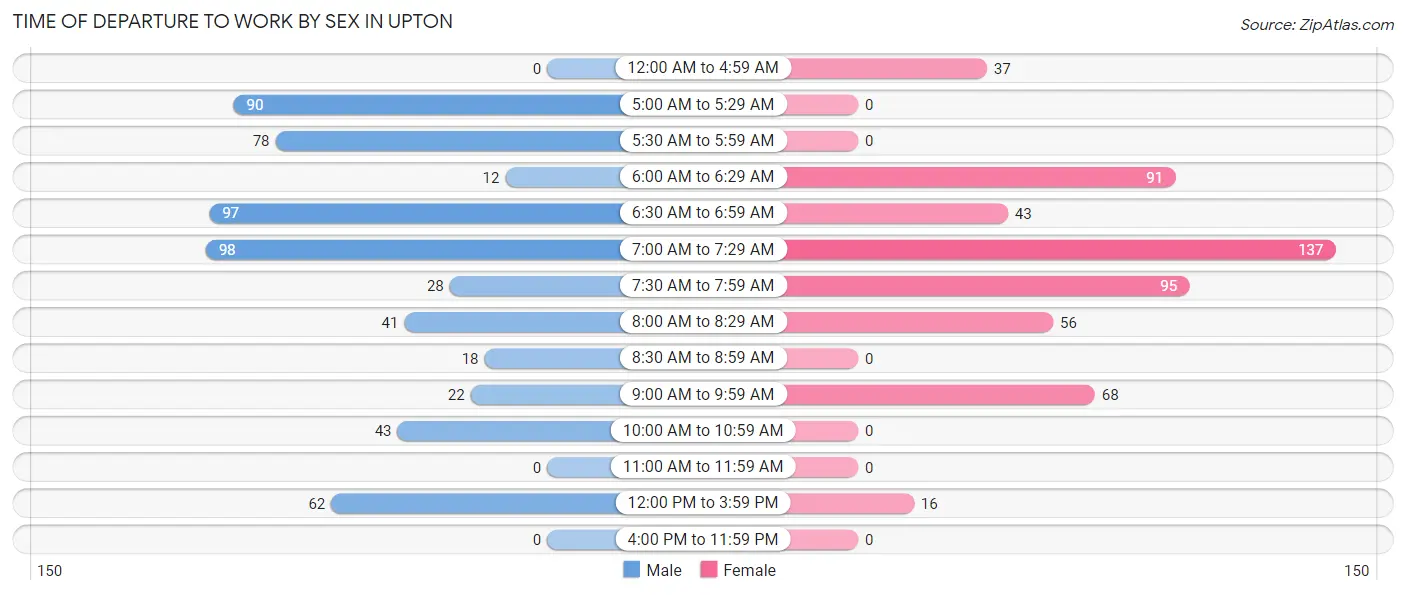
| Time of Departure | Male | Female |
| 12:00 AM to 4:59 AM | 0 (0.0%) | 37 (6.8%) |
| 5:00 AM to 5:29 AM | 90 (15.3%) | 0 (0.0%) |
| 5:30 AM to 5:59 AM | 78 (13.2%) | 0 (0.0%) |
| 6:00 AM to 6:29 AM | 12 (2.0%) | 91 (16.8%) |
| 6:30 AM to 6:59 AM | 97 (16.5%) | 43 (7.9%) |
| 7:00 AM to 7:29 AM | 98 (16.6%) | 137 (25.2%) |
| 7:30 AM to 7:59 AM | 28 (4.8%) | 95 (17.5%) |
| 8:00 AM to 8:29 AM | 41 (7.0%) | 56 (10.3%) |
| 8:30 AM to 8:59 AM | 18 (3.1%) | 0 (0.0%) |
| 9:00 AM to 9:59 AM | 22 (3.7%) | 68 (12.5%) |
| 10:00 AM to 10:59 AM | 43 (7.3%) | 0 (0.0%) |
| 11:00 AM to 11:59 AM | 0 (0.0%) | 0 (0.0%) |
| 12:00 PM to 3:59 PM | 62 (10.5%) | 16 (2.9%) |
| 4:00 PM to 11:59 PM | 0 (0.0%) | 0 (0.0%) |
| Total | 589 (100.0%) | 543 (100.0%) |
Housing Occupancy in Upton
Occupancy by Ownership in Upton
Of the total 985 dwellings in Upton, owner-occupied units account for 725 (73.6%), while renter-occupied units make up 260 (26.4%).
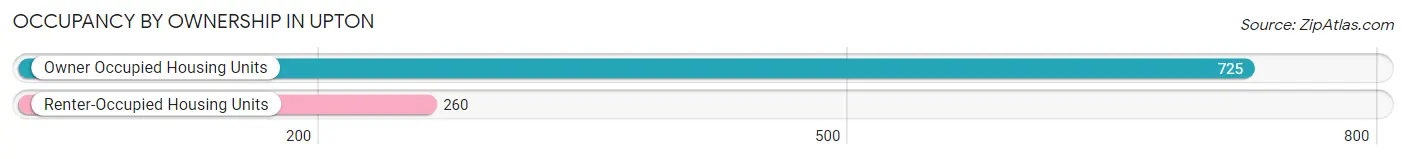
| Occupancy | # Housing Units | % Housing Units |
| Owner Occupied Housing Units | 725 | 73.6% |
| Renter-Occupied Housing Units | 260 | 26.4% |
| Total Occupied Housing Units | 985 | 100.0% |
Occupancy by Household Size in Upton
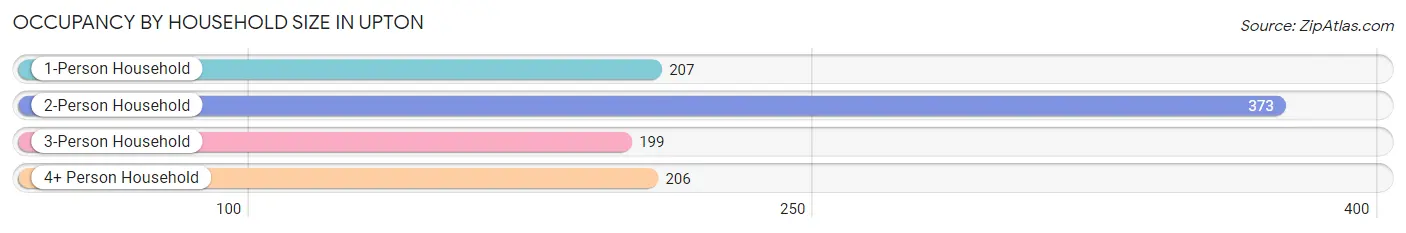
| Household Size | # Housing Units | % Housing Units |
| 1-Person Household | 207 | 21.0% |
| 2-Person Household | 373 | 37.9% |
| 3-Person Household | 199 | 20.2% |
| 4+ Person Household | 206 | 20.9% |
| Total Housing Units | 985 | 100.0% |
Occupancy by Ownership by Household Size in Upton
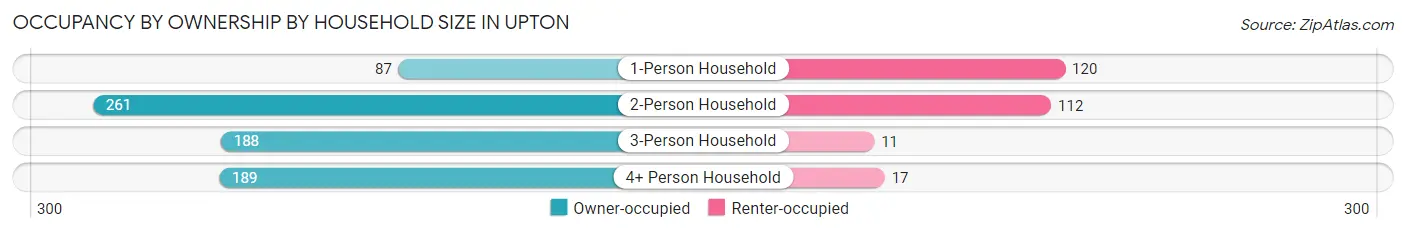
| Household Size | Owner-occupied | Renter-occupied |
| 1-Person Household | 87 (42.0%) | 120 (58.0%) |
| 2-Person Household | 261 (70.0%) | 112 (30.0%) |
| 3-Person Household | 188 (94.5%) | 11 (5.5%) |
| 4+ Person Household | 189 (91.7%) | 17 (8.3%) |
| Total Housing Units | 725 (73.6%) | 260 (26.4%) |
Occupancy by Educational Attainment in Upton
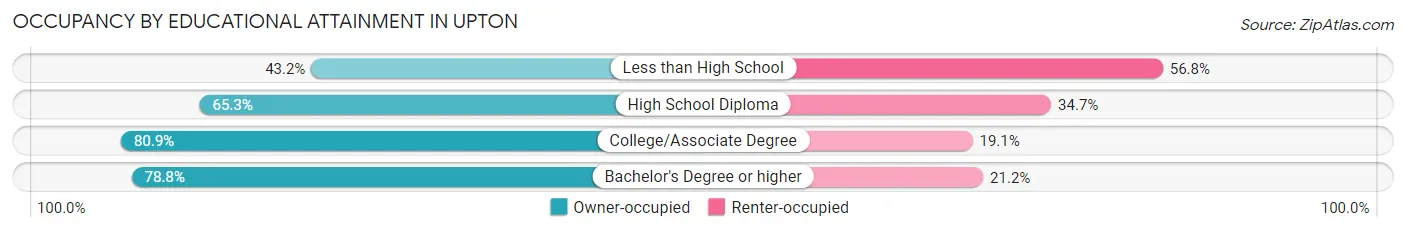
| Household Size | Owner-occupied | Renter-occupied |
| Less than High School | 19 (43.2%) | 25 (56.8%) |
| High School Diploma | 192 (65.3%) | 102 (34.7%) |
| College/Associate Degree | 161 (80.9%) | 38 (19.1%) |
| Bachelor's Degree or higher | 353 (78.8%) | 95 (21.2%) |
Occupancy by Age of Householder in Upton
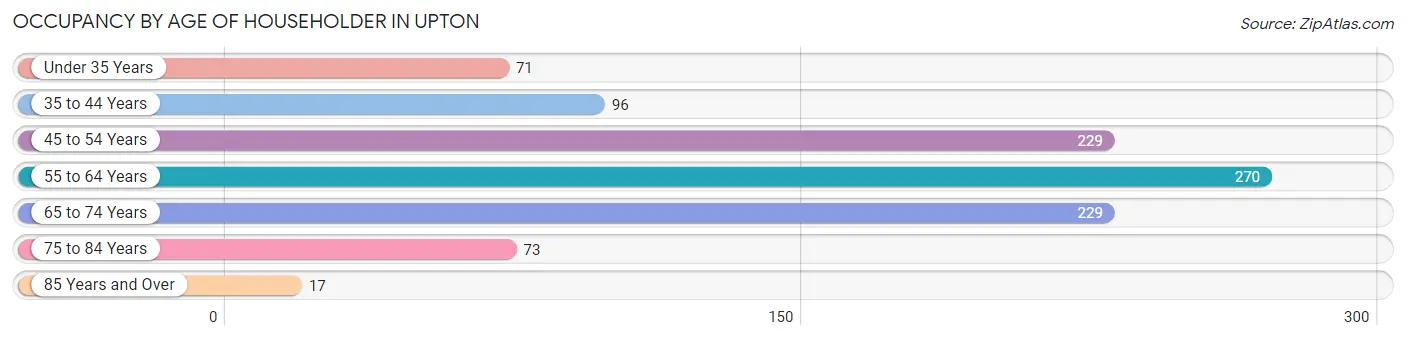
| Age Bracket | # Households | % Households |
| Under 35 Years | 71 | 7.2% |
| 35 to 44 Years | 96 | 9.8% |
| 45 to 54 Years | 229 | 23.3% |
| 55 to 64 Years | 270 | 27.4% |
| 65 to 74 Years | 229 | 23.3% |
| 75 to 84 Years | 73 | 7.4% |
| 85 Years and Over | 17 | 1.7% |
| Total | 985 | 100.0% |
Housing Finances in Upton
Median Income by Occupancy in Upton
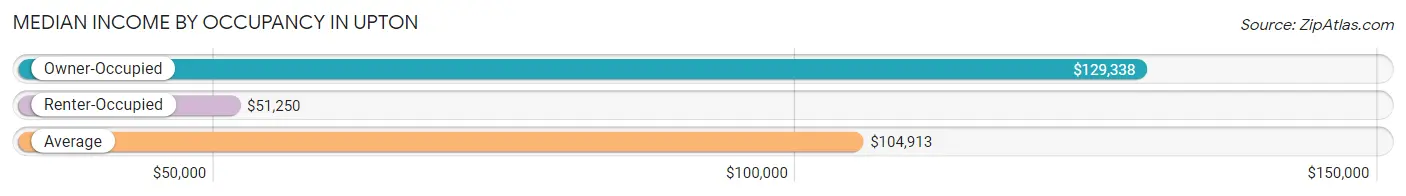
| Occupancy Type | # Households | Median Income |
| Owner-Occupied | 725 (73.6%) | $129,338 |
| Renter-Occupied | 260 (26.4%) | $51,250 |
| Average | 985 (100.0%) | $104,913 |
Occupancy by Householder Income Bracket in Upton
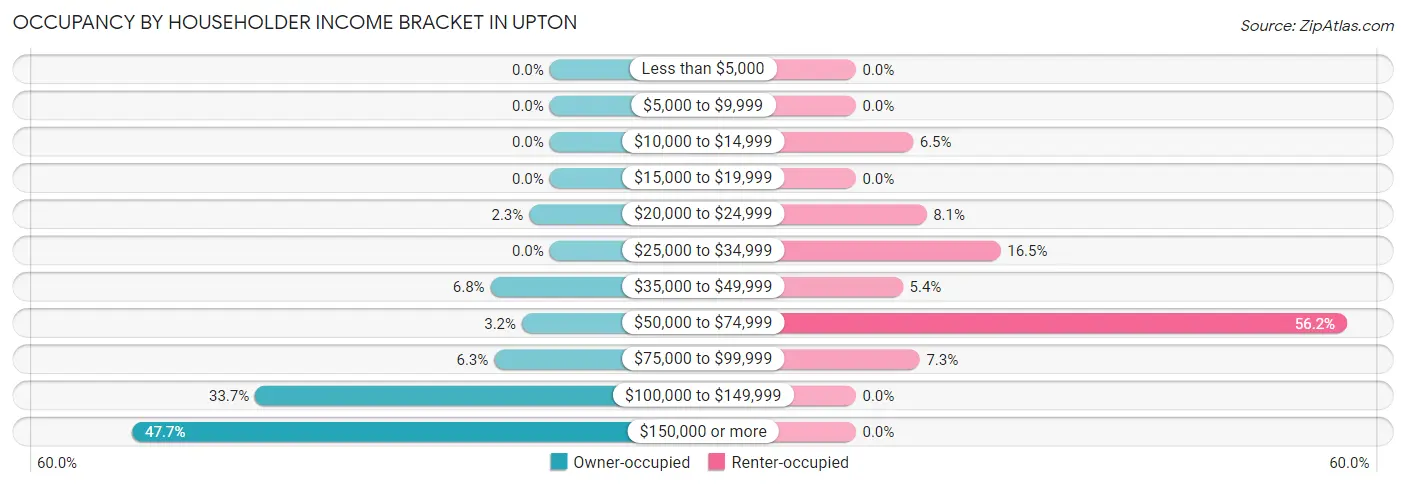
| Income Bracket | Owner-occupied | Renter-occupied |
| Less than $5,000 | 0 (0.0%) | 0 (0.0%) |
| $5,000 to $9,999 | 0 (0.0%) | 0 (0.0%) |
| $10,000 to $14,999 | 0 (0.0%) | 17 (6.5%) |
| $15,000 to $19,999 | 0 (0.0%) | 0 (0.0%) |
| $20,000 to $24,999 | 17 (2.3%) | 21 (8.1%) |
| $25,000 to $34,999 | 0 (0.0%) | 43 (16.5%) |
| $35,000 to $49,999 | 49 (6.8%) | 14 (5.4%) |
| $50,000 to $74,999 | 23 (3.2%) | 146 (56.1%) |
| $75,000 to $99,999 | 46 (6.3%) | 19 (7.3%) |
| $100,000 to $149,999 | 244 (33.7%) | 0 (0.0%) |
| $150,000 or more | 346 (47.7%) | 0 (0.0%) |
| Total | 725 (100.0%) | 260 (100.0%) |
Monthly Housing Cost Tiers in Upton
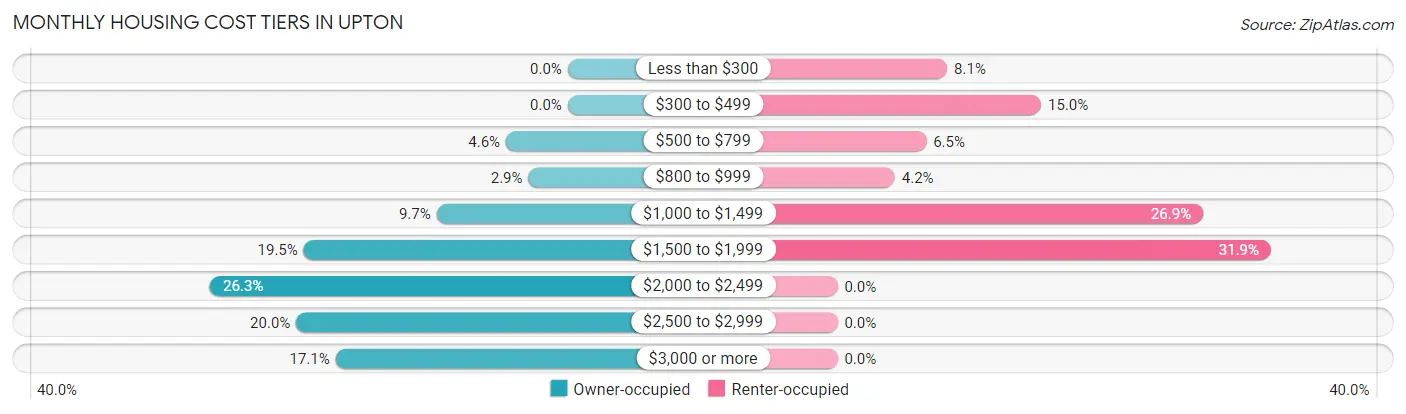
| Monthly Cost | Owner-occupied | Renter-occupied |
| Less than $300 | 0 (0.0%) | 21 (8.1%) |
| $300 to $499 | 0 (0.0%) | 39 (15.0%) |
| $500 to $799 | 33 (4.5%) | 17 (6.5%) |
| $800 to $999 | 21 (2.9%) | 11 (4.2%) |
| $1,000 to $1,499 | 70 (9.7%) | 70 (26.9%) |
| $1,500 to $1,999 | 141 (19.5%) | 83 (31.9%) |
| $2,000 to $2,499 | 191 (26.3%) | 0 (0.0%) |
| $2,500 to $2,999 | 145 (20.0%) | 0 (0.0%) |
| $3,000 or more | 124 (17.1%) | 0 (0.0%) |
| Total | 725 (100.0%) | 260 (100.0%) |
Physical Housing Characteristics in Upton
Housing Structures in Upton
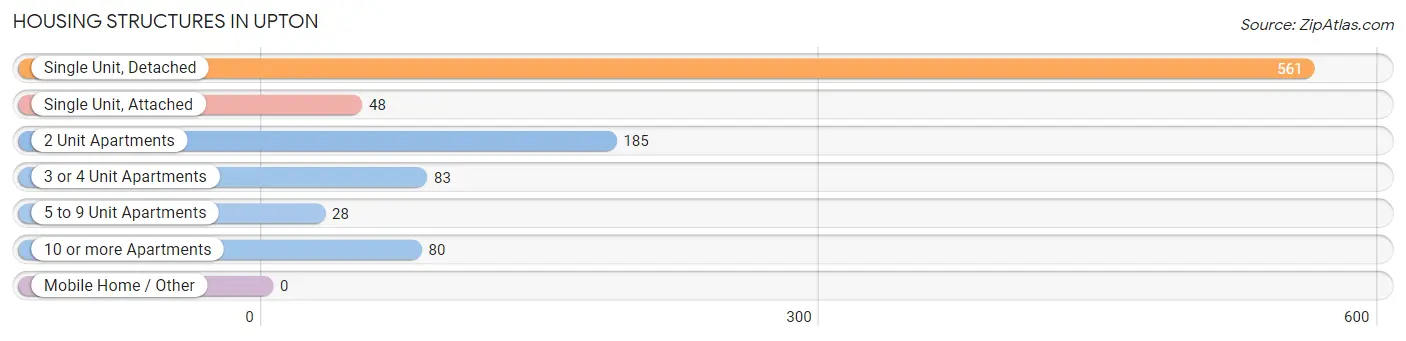
| Structure Type | # Housing Units | % Housing Units |
| Single Unit, Detached | 561 | 57.0% |
| Single Unit, Attached | 48 | 4.9% |
| 2 Unit Apartments | 185 | 18.8% |
| 3 or 4 Unit Apartments | 83 | 8.4% |
| 5 to 9 Unit Apartments | 28 | 2.8% |
| 10 or more Apartments | 80 | 8.1% |
| Mobile Home / Other | 0 | 0.0% |
| Total | 985 | 100.0% |
Housing Structures by Occupancy in Upton
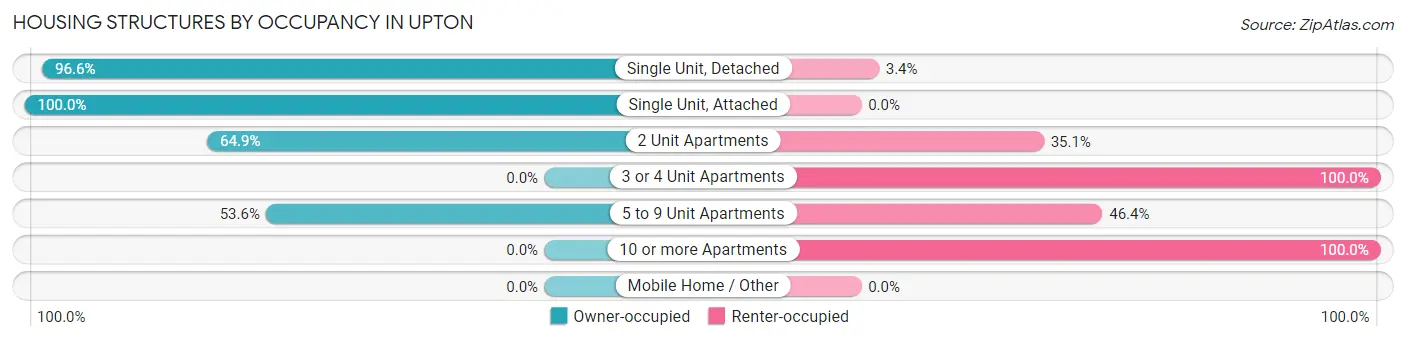
| Structure Type | Owner-occupied | Renter-occupied |
| Single Unit, Detached | 542 (96.6%) | 19 (3.4%) |
| Single Unit, Attached | 48 (100.0%) | 0 (0.0%) |
| 2 Unit Apartments | 120 (64.9%) | 65 (35.1%) |
| 3 or 4 Unit Apartments | 0 (0.0%) | 83 (100.0%) |
| 5 to 9 Unit Apartments | 15 (53.6%) | 13 (46.4%) |
| 10 or more Apartments | 0 (0.0%) | 80 (100.0%) |
| Mobile Home / Other | 0 (0.0%) | 0 (0.0%) |
| Total | 725 (73.6%) | 260 (26.4%) |
Housing Structures by Number of Rooms in Upton
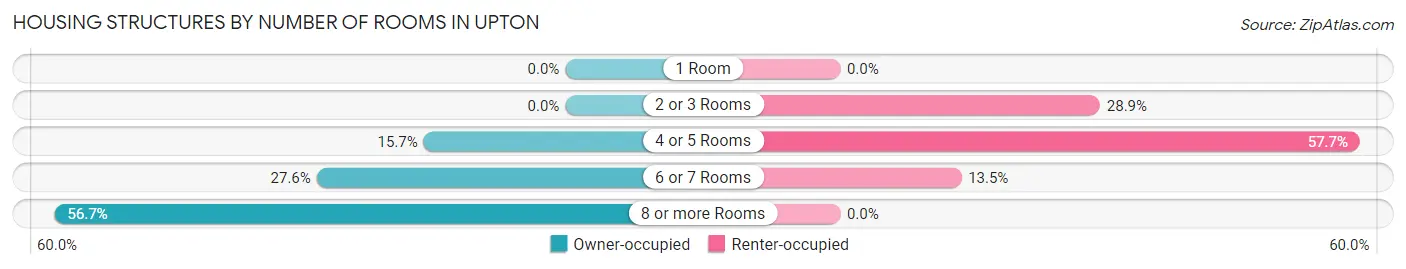
| Number of Rooms | Owner-occupied | Renter-occupied |
| 1 Room | 0 (0.0%) | 0 (0.0%) |
| 2 or 3 Rooms | 0 (0.0%) | 75 (28.8%) |
| 4 or 5 Rooms | 114 (15.7%) | 150 (57.7%) |
| 6 or 7 Rooms | 200 (27.6%) | 35 (13.5%) |
| 8 or more Rooms | 411 (56.7%) | 0 (0.0%) |
| Total | 725 (100.0%) | 260 (100.0%) |
Housing Structure by Heating Type in Upton
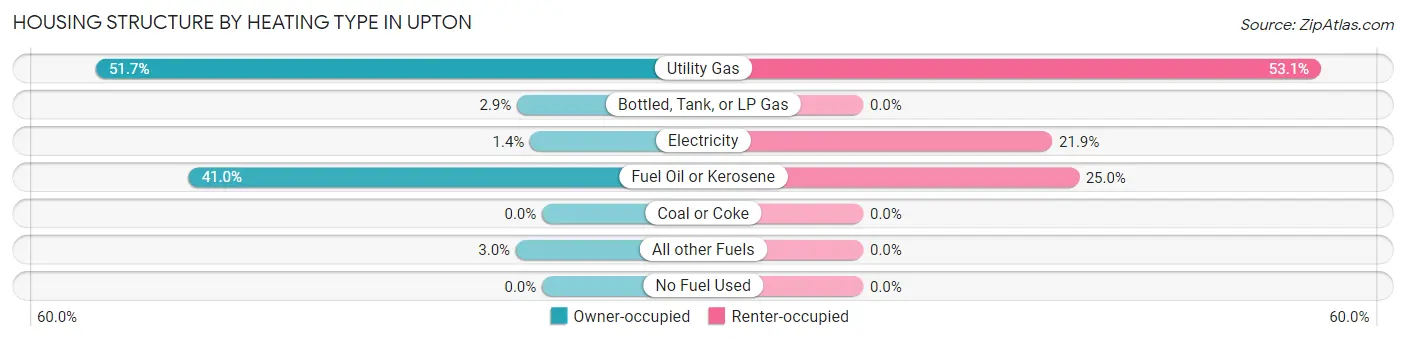
| Heating Type | Owner-occupied | Renter-occupied |
| Utility Gas | 375 (51.7%) | 138 (53.1%) |
| Bottled, Tank, or LP Gas | 21 (2.9%) | 0 (0.0%) |
| Electricity | 10 (1.4%) | 57 (21.9%) |
| Fuel Oil or Kerosene | 297 (41.0%) | 65 (25.0%) |
| Coal or Coke | 0 (0.0%) | 0 (0.0%) |
| All other Fuels | 22 (3.0%) | 0 (0.0%) |
| No Fuel Used | 0 (0.0%) | 0 (0.0%) |
| Total | 725 (100.0%) | 260 (100.0%) |
Household Vehicle Usage in Upton
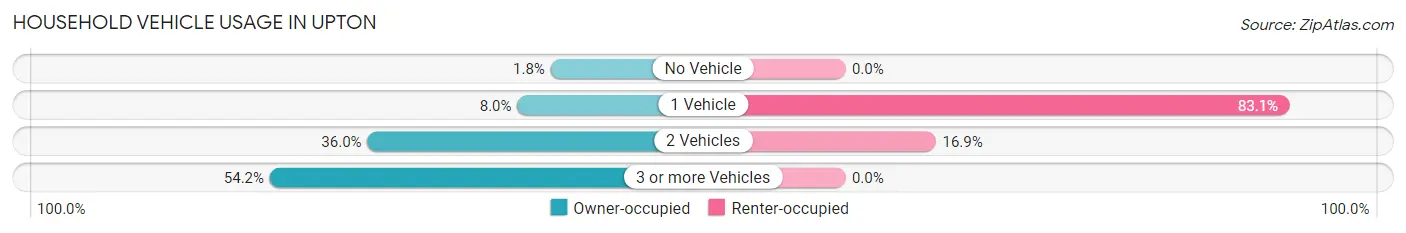
| Vehicles per Household | Owner-occupied | Renter-occupied |
| No Vehicle | 13 (1.8%) | 0 (0.0%) |
| 1 Vehicle | 58 (8.0%) | 216 (83.1%) |
| 2 Vehicles | 261 (36.0%) | 44 (16.9%) |
| 3 or more Vehicles | 393 (54.2%) | 0 (0.0%) |
| Total | 725 (100.0%) | 260 (100.0%) |
Real Estate & Mortgages in Upton
Real Estate and Mortgage Overview in Upton
| Characteristic | Without Mortgage | With Mortgage |
| Housing Units | 157 | 568 |
| Median Property Value | $452,800 | $442,000 |
| Median Household Income | - | - |
| Monthly Housing Costs | $1,309 | $124 |
| Real Estate Taxes | $6,530 | $0 |
Property Value by Mortgage Status in Upton
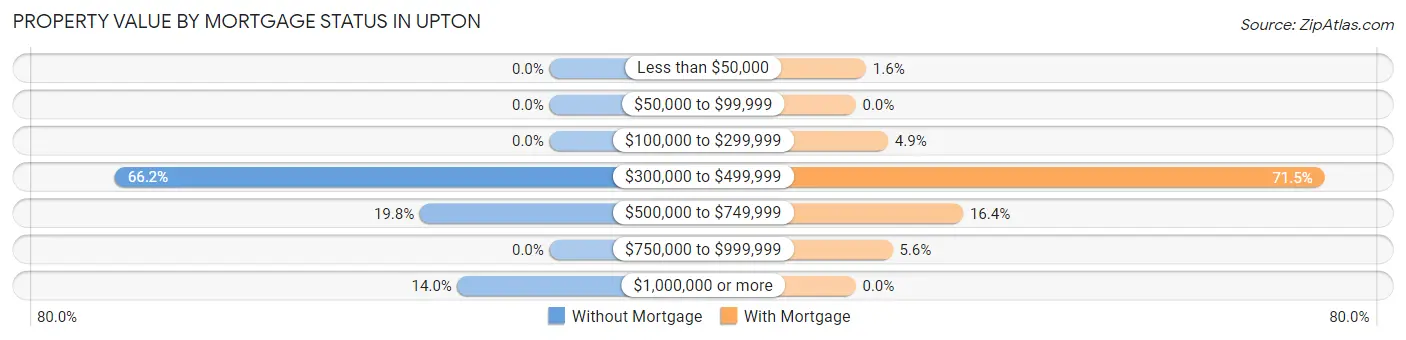
| Property Value | Without Mortgage | With Mortgage |
| Less than $50,000 | 0 (0.0%) | 9 (1.6%) |
| $50,000 to $99,999 | 0 (0.0%) | 0 (0.0%) |
| $100,000 to $299,999 | 0 (0.0%) | 28 (4.9%) |
| $300,000 to $499,999 | 104 (66.2%) | 406 (71.5%) |
| $500,000 to $749,999 | 31 (19.8%) | 93 (16.4%) |
| $750,000 to $999,999 | 0 (0.0%) | 32 (5.6%) |
| $1,000,000 or more | 22 (14.0%) | 0 (0.0%) |
| Total | 157 (100.0%) | 568 (100.0%) |
Household Income by Mortgage Status in Upton
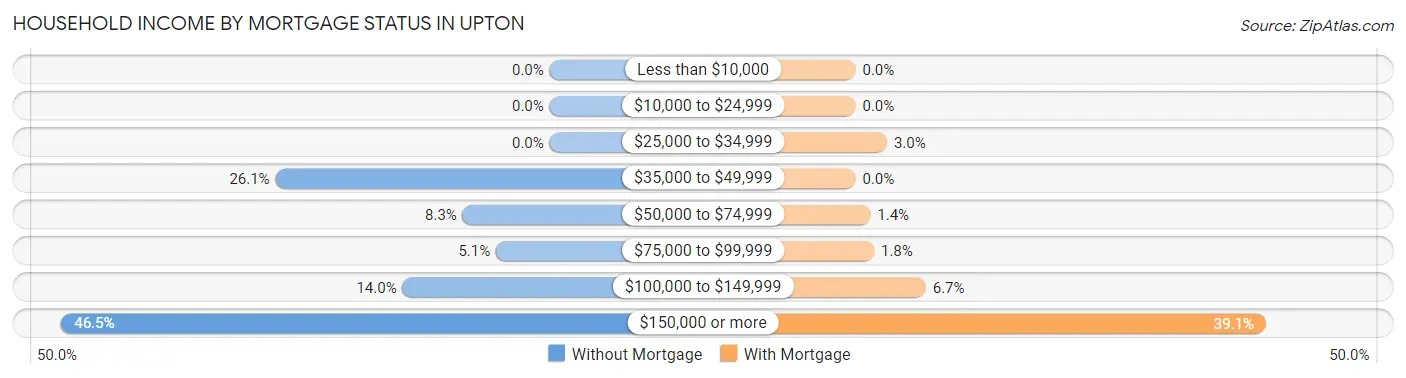
| Household Income | Without Mortgage | With Mortgage |
| Less than $10,000 | 0 (0.0%) | 0 (0.0%) |
| $10,000 to $24,999 | 0 (0.0%) | 0 (0.0%) |
| $25,000 to $34,999 | 0 (0.0%) | 17 (3.0%) |
| $35,000 to $49,999 | 41 (26.1%) | 0 (0.0%) |
| $50,000 to $74,999 | 13 (8.3%) | 8 (1.4%) |
| $75,000 to $99,999 | 8 (5.1%) | 10 (1.8%) |
| $100,000 to $149,999 | 22 (14.0%) | 38 (6.7%) |
| $150,000 or more | 73 (46.5%) | 222 (39.1%) |
| Total | 157 (100.0%) | 568 (100.0%) |
Property Value to Household Income Ratio in Upton
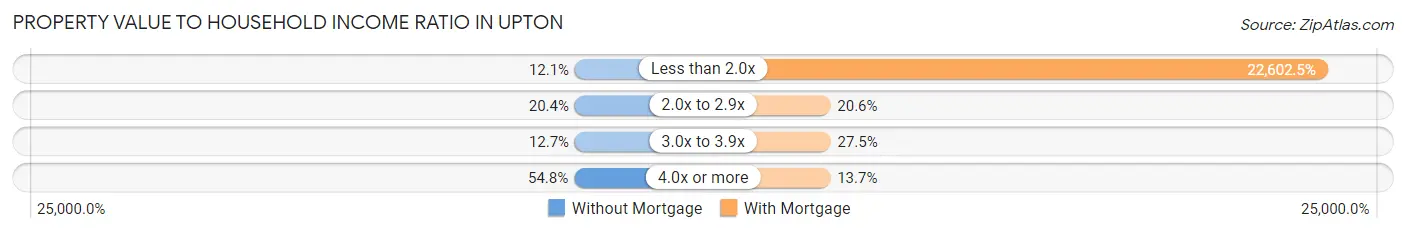
| Value-to-Income Ratio | Without Mortgage | With Mortgage |
| Less than 2.0x | 19 (12.1%) | 128,382 (22,602.5%) |
| 2.0x to 2.9x | 32 (20.4%) | 117 (20.6%) |
| 3.0x to 3.9x | 20 (12.7%) | 156 (27.5%) |
| 4.0x or more | 86 (54.8%) | 78 (13.7%) |
| Total | 157 (100.0%) | 568 (100.0%) |
Real Estate Taxes by Mortgage Status in Upton
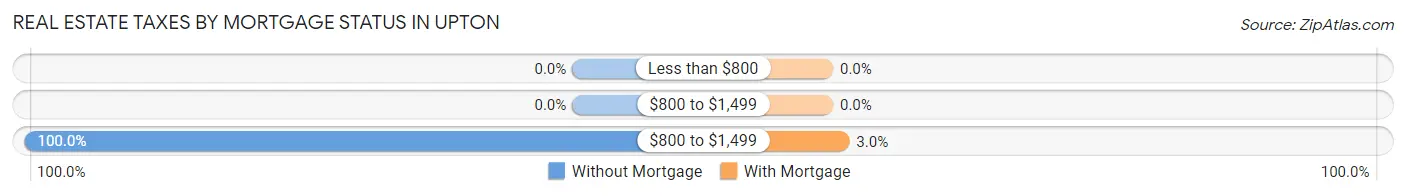
| Property Taxes | Without Mortgage | With Mortgage |
| Less than $800 | 0 (0.0%) | 0 (0.0%) |
| $800 to $1,499 | 0 (0.0%) | 0 (0.0%) |
| $800 to $1,499 | 157 (100.0%) | 17 (3.0%) |
| Total | 157 (100.0%) | 568 (100.0%) |
Health & Disability in Upton
Health Insurance Coverage by Age in Upton
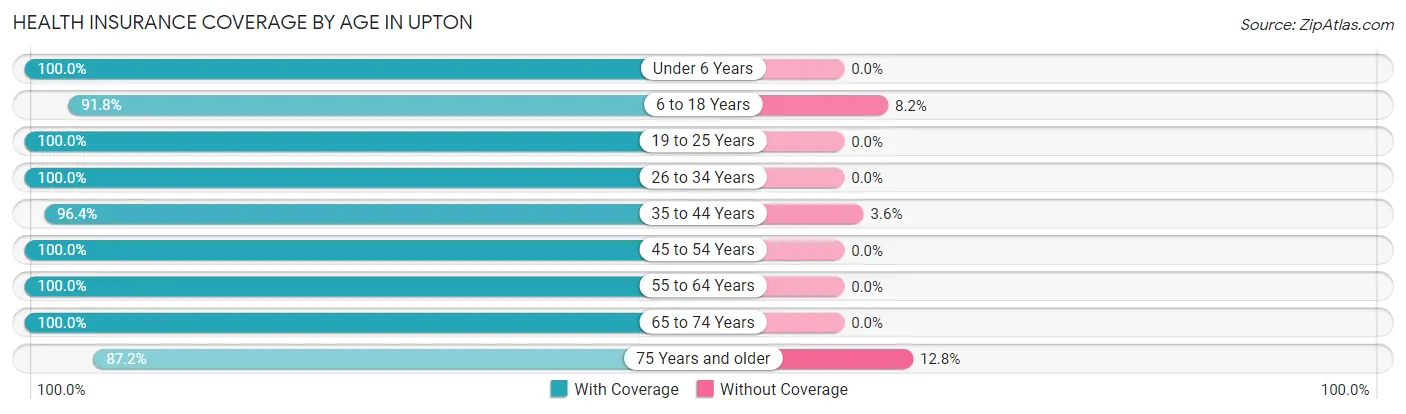
| Age Bracket | With Coverage | Without Coverage |
| Under 6 Years | 124 (100.0%) | 0 (0.0%) |
| 6 to 18 Years | 326 (91.8%) | 29 (8.2%) |
| 19 to 25 Years | 178 (100.0%) | 0 (0.0%) |
| 26 to 34 Years | 173 (100.0%) | 0 (0.0%) |
| 35 to 44 Years | 294 (96.4%) | 11 (3.6%) |
| 45 to 54 Years | 386 (100.0%) | 0 (0.0%) |
| 55 to 64 Years | 563 (100.0%) | 0 (0.0%) |
| 65 to 74 Years | 356 (100.0%) | 0 (0.0%) |
| 75 Years and older | 136 (87.2%) | 20 (12.8%) |
| Total | 2,536 (97.7%) | 60 (2.3%) |
Health Insurance Coverage by Citizenship Status in Upton
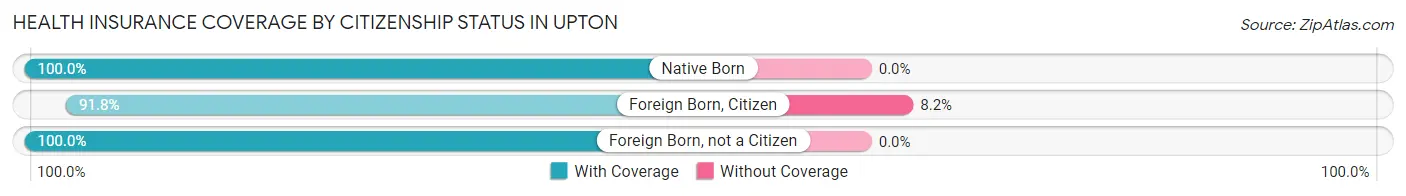
| Citizenship Status | With Coverage | Without Coverage |
| Native Born | 124 (100.0%) | 0 (0.0%) |
| Foreign Born, Citizen | 326 (91.8%) | 29 (8.2%) |
| Foreign Born, not a Citizen | 178 (100.0%) | 0 (0.0%) |
Health Insurance Coverage by Household Income in Upton
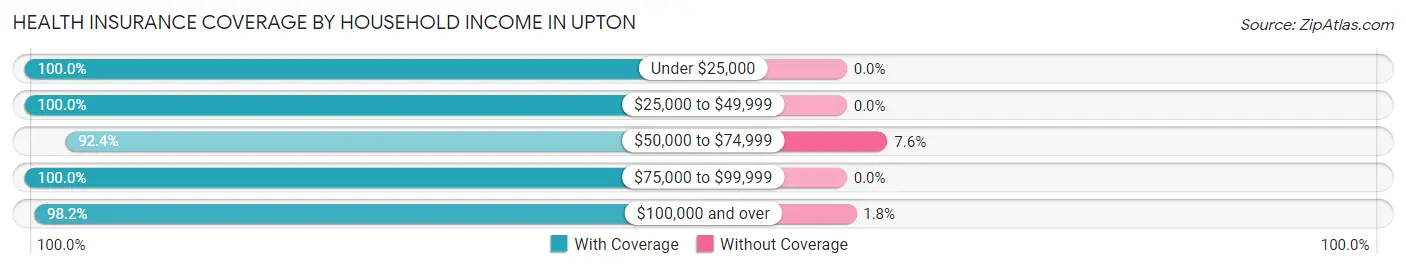
| Household Income | With Coverage | Without Coverage |
| Under $25,000 | 90 (100.0%) | 0 (0.0%) |
| $25,000 to $49,999 | 175 (100.0%) | 0 (0.0%) |
| $50,000 to $74,999 | 340 (92.4%) | 28 (7.6%) |
| $75,000 to $99,999 | 143 (100.0%) | 0 (0.0%) |
| $100,000 and over | 1,768 (98.2%) | 32 (1.8%) |
Public vs Private Health Insurance Coverage by Age in Upton
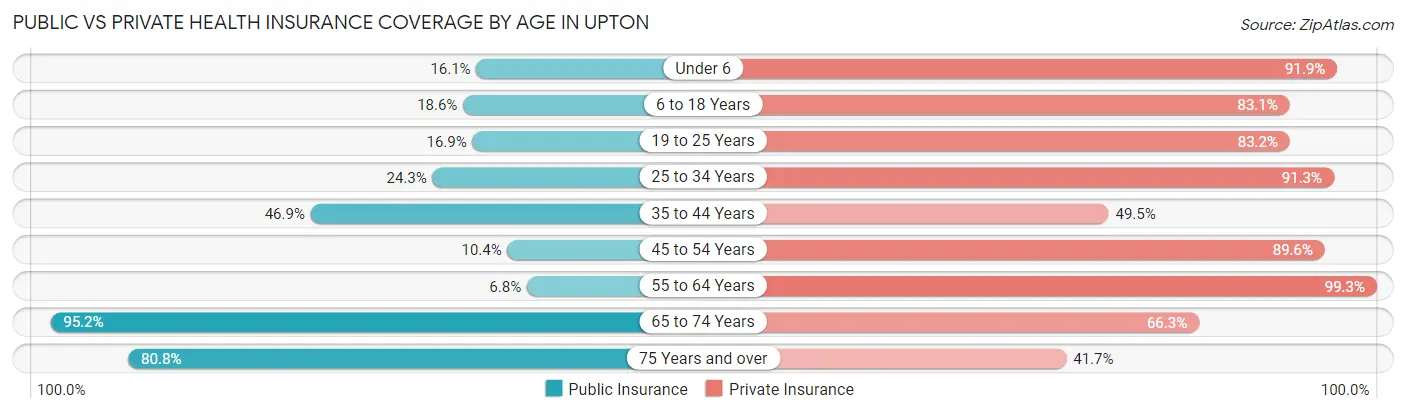
| Age Bracket | Public Insurance | Private Insurance |
| Under 6 | 20 (16.1%) | 114 (91.9%) |
| 6 to 18 Years | 66 (18.6%) | 295 (83.1%) |
| 19 to 25 Years | 30 (16.9%) | 148 (83.2%) |
| 25 to 34 Years | 42 (24.3%) | 158 (91.3%) |
| 35 to 44 Years | 143 (46.9%) | 151 (49.5%) |
| 45 to 54 Years | 40 (10.4%) | 346 (89.6%) |
| 55 to 64 Years | 38 (6.8%) | 559 (99.3%) |
| 65 to 74 Years | 339 (95.2%) | 236 (66.3%) |
| 75 Years and over | 126 (80.8%) | 65 (41.7%) |
| Total | 844 (32.5%) | 2,072 (79.8%) |
Disability Status by Sex by Age in Upton
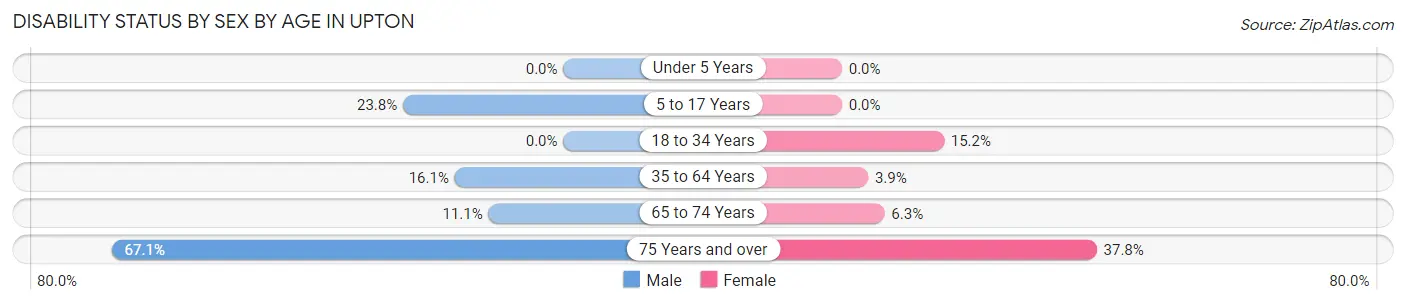
| Age Bracket | Male | Female |
| Under 5 Years | 0 (0.0%) | 0 (0.0%) |
| 5 to 17 Years | 35 (23.8%) | 0 (0.0%) |
| 18 to 34 Years | 0 (0.0%) | 30 (15.1%) |
| 35 to 64 Years | 111 (16.1%) | 22 (3.9%) |
| 65 to 74 Years | 15 (11.1%) | 14 (6.3%) |
| 75 Years and over | 55 (67.1%) | 28 (37.8%) |
Disability Class by Sex by Age in Upton
Disability Class: Hearing Difficulty
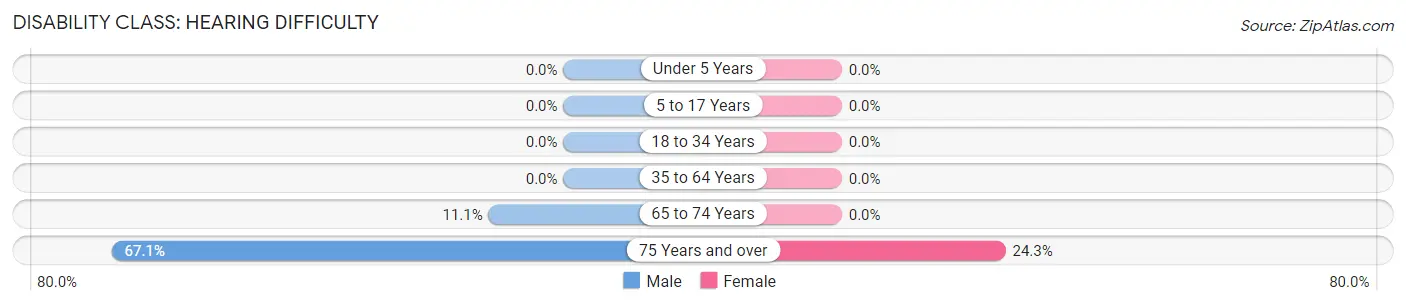
| Age Bracket | Male | Female |
| Under 5 Years | 0 (0.0%) | 0 (0.0%) |
| 5 to 17 Years | 0 (0.0%) | 0 (0.0%) |
| 18 to 34 Years | 0 (0.0%) | 0 (0.0%) |
| 35 to 64 Years | 0 (0.0%) | 0 (0.0%) |
| 65 to 74 Years | 15 (11.1%) | 0 (0.0%) |
| 75 Years and over | 55 (67.1%) | 18 (24.3%) |
Disability Class: Vision Difficulty
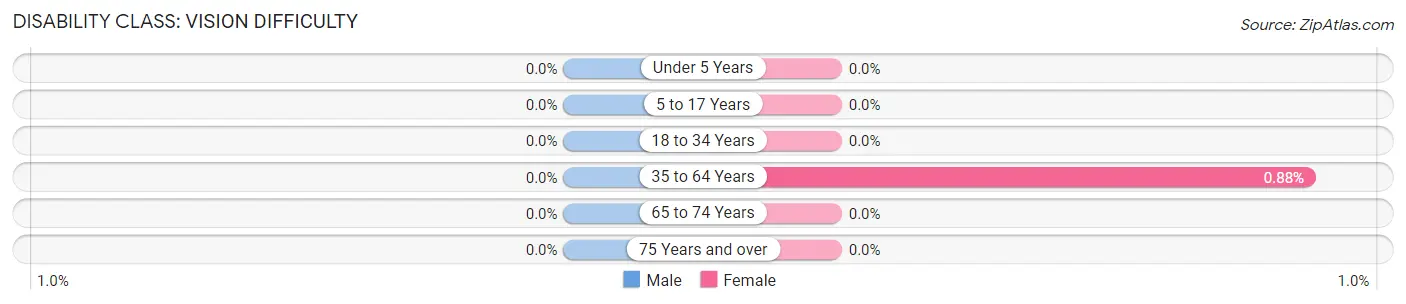
| Age Bracket | Male | Female |
| Under 5 Years | 0 (0.0%) | 0 (0.0%) |
| 5 to 17 Years | 0 (0.0%) | 0 (0.0%) |
| 18 to 34 Years | 0 (0.0%) | 0 (0.0%) |
| 35 to 64 Years | 0 (0.0%) | 5 (0.9%) |
| 65 to 74 Years | 0 (0.0%) | 0 (0.0%) |
| 75 Years and over | 0 (0.0%) | 0 (0.0%) |
Disability Class: Cognitive Difficulty
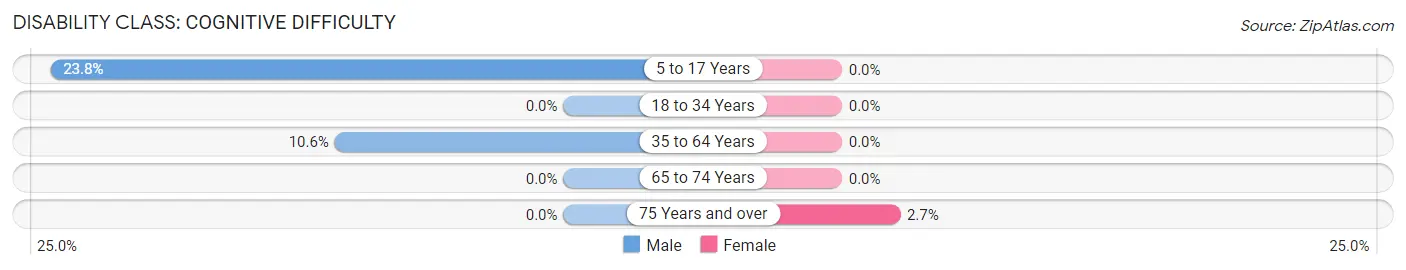
| Age Bracket | Male | Female |
| 5 to 17 Years | 35 (23.8%) | 0 (0.0%) |
| 18 to 34 Years | 0 (0.0%) | 0 (0.0%) |
| 35 to 64 Years | 73 (10.6%) | 0 (0.0%) |
| 65 to 74 Years | 0 (0.0%) | 0 (0.0%) |
| 75 Years and over | 0 (0.0%) | 2 (2.7%) |
Disability Class: Ambulatory Difficulty
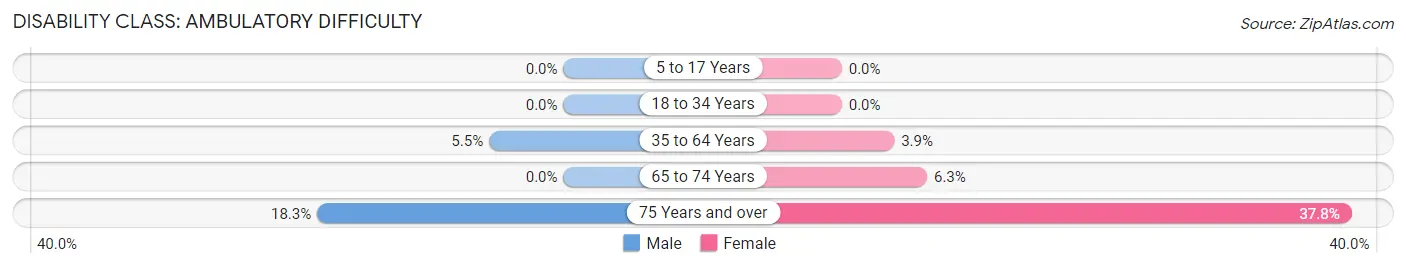
| Age Bracket | Male | Female |
| 5 to 17 Years | 0 (0.0%) | 0 (0.0%) |
| 18 to 34 Years | 0 (0.0%) | 0 (0.0%) |
| 35 to 64 Years | 38 (5.5%) | 22 (3.9%) |
| 65 to 74 Years | 0 (0.0%) | 14 (6.3%) |
| 75 Years and over | 15 (18.3%) | 28 (37.8%) |
Disability Class: Self-Care Difficulty
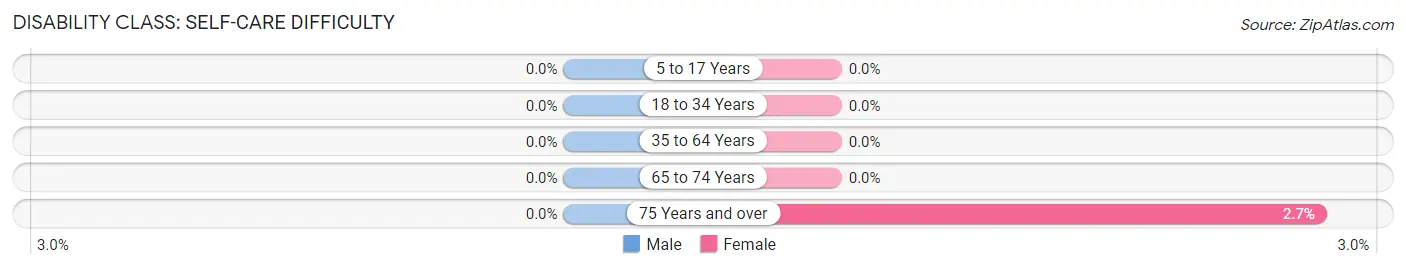
| Age Bracket | Male | Female |
| 5 to 17 Years | 0 (0.0%) | 0 (0.0%) |
| 18 to 34 Years | 0 (0.0%) | 0 (0.0%) |
| 35 to 64 Years | 0 (0.0%) | 0 (0.0%) |
| 65 to 74 Years | 0 (0.0%) | 0 (0.0%) |
| 75 Years and over | 0 (0.0%) | 2 (2.7%) |
Technology Access in Upton
Computing Device Access in Upton
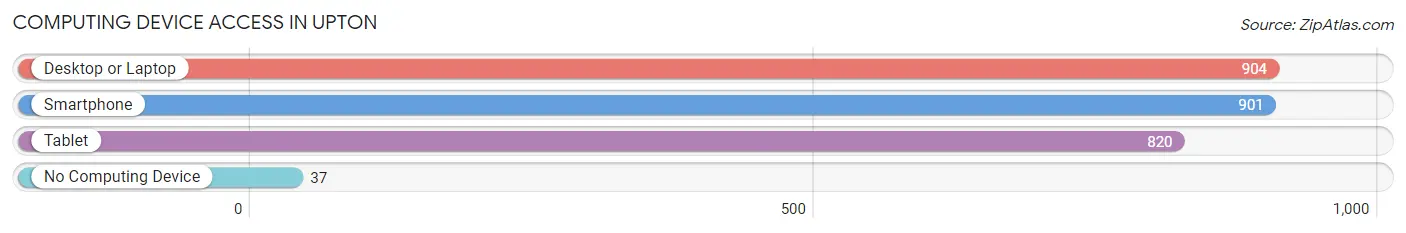
| Device Type | # Households | % Households |
| Desktop or Laptop | 904 | 91.8% |
| Smartphone | 901 | 91.5% |
| Tablet | 820 | 83.3% |
| No Computing Device | 37 | 3.8% |
| Total | 985 | 100.0% |
Internet Access in Upton
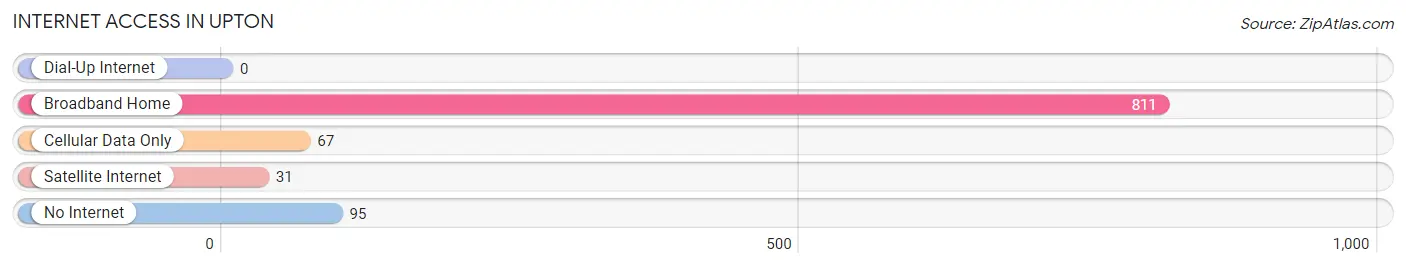
| Internet Type | # Households | % Households |
| Dial-Up Internet | 0 | 0.0% |
| Broadband Home | 811 | 82.3% |
| Cellular Data Only | 67 | 6.8% |
| Satellite Internet | 31 | 3.2% |
| No Internet | 95 | 9.6% |
| Total | 985 | 100.0% |
Upton Summary
Upton, Massachusetts is a small town located in Worcester County, approximately 40 miles west of Boston. It is bordered by the towns of Hopkinton, Grafton, Northbridge, and Milford. The town has a population of approximately 6,500 people and covers an area of 16.7 square miles.
History
Upton was first settled in 1735 and was officially incorporated in 1735. The town was named after Upton, England, which was the hometown of the first settlers. The town was primarily an agricultural community, with the main crops being corn, potatoes, and hay. In the 19th century, the town began to industrialize, with the establishment of several mills and factories. The most notable of these was the Upton Machine Company, which was founded in 1845 and produced a variety of products, including textiles, paper, and machinery.
Geography
Upton is located in the Blackstone Valley region of Massachusetts. The town is situated on the Blackstone River, which is a tributary of the Charles River. The town is mostly rural, with rolling hills and wooded areas. The highest point in the town is the summit of Upton Hill, which is located at an elevation of 545 feet.
Economy
Upton’s economy is primarily based on agriculture and manufacturing. The town is home to several farms, which produce a variety of crops, including corn, potatoes, hay, and apples. The town is also home to several manufacturing companies, including the Upton Machine Company, which produces a variety of products, including textiles, paper, and machinery.
Demographics
As of the 2010 census, the population of Upton was 6,531. The racial makeup of the town was 94.3% White, 1.3% African American, 0.3% Native American, 1.2% Asian, 0.1% Pacific Islander, 1.2% from other races, and 1.6% from two or more races. Hispanic or Latino of any race were 2.7% of the population.
The median household income in Upton was $76,944, and the median family income was $90,917. The per capita income for the town was $33,945. About 4.2% of families and 5.3% of the population were below the poverty line, including 6.2% of those under age 18 and 4.2% of those age 65 or over.
Upton is a small town with a rich history and a diverse population. The town is home to several farms and manufacturing companies, which provide employment opportunities for its residents. The town is also home to several parks and recreational areas, which provide a variety of activities for its residents.
Common Questions
What is Per Capita Income in Upton?
Per Capita income in Upton is $52,391.
What is the Median Family Income in Upton?
Median Family Income in Upton is $118,224.
What is the Median Household income in Upton?
Median Household Income in Upton is $104,913.
What is Income or Wage Gap in Upton?
Income or Wage Gap in Upton is 1.8%.
Women in Upton earn 98.2 cents for every dollar earned by a man.
What is Inequality or Gini Index in Upton?
Inequality or Gini Index in Upton is 0.39.
What is the Total Population of Upton?
Total Population of Upton is 2,596.
What is the Total Male Population of Upton?
Total Male Population of Upton is 1,287.
What is the Total Female Population of Upton?
Total Female Population of Upton is 1,309.
What is the Ratio of Males per 100 Females in Upton?
There are 98.32 Males per 100 Females in Upton.
What is the Ratio of Females per 100 Males in Upton?
There are 101.71 Females per 100 Males in Upton.
What is the Median Population Age in Upton?
Median Population Age in Upton is 50.3 Years.
What is the Average Family Size in Upton
Average Family Size in Upton is 3.0 People.
What is the Average Household Size in Upton
Average Household Size in Upton is 2.6 People.
How Large is the Labor Force in Upton?
There are 1,538 People in the Labor Forcein in Upton.
What is the Percentage of People in the Labor Force in Upton?
68.0% of People are in the Labor Force in Upton.
What is the Unemployment Rate in Upton?
Unemployment Rate in Upton is 6.4%.