Onset, MA Map & Demographics
Onset Map
Onset Overview
$51,462
PER CAPITA INCOME
$163,864
AVG FAMILY INCOME
$72,017
AVG HOUSEHOLD INCOME
0.45
INEQUALITY / GINI INDEX
1,326
TOTAL POPULATION
647
MALE POPULATION
679
FEMALE POPULATION
95.29
MALES / 100 FEMALES
104.95
FEMALES / 100 MALES
53.7
MEDIAN AGE
2.5
AVG FAMILY SIZE
1.9
AVG HOUSEHOLD SIZE
746
LABOR FORCE [ PEOPLE ]
63.8%
PERCENT IN LABOR FORCE
28.6%
UNEMPLOYMENT RATE
Onset Zip Codes
Onset Area Codes
Income in Onset
Income Overview in Onset
Per Capita Income in Onset is $51,462, while median incomes of families and households are $163,864 and $72,017 respectively.
| Characteristic | Number | Measure |
| Per Capita Income | 1,326 | $51,462 |
| Median Family Income | 328 | $163,864 |
| Mean Family Income | 328 | $145,778 |
| Median Household Income | 679 | $72,017 |
| Mean Household Income | 679 | $99,725 |
| Income Deficit | 328 | $0 |
| Wage / Income Gap (%) | 1,326 | 0.00% |
| Wage / Income Gap ($) | 1,326 | 100.00¢ per $1 |
| Gini / Inequality Index | 1,326 | 0.45 |
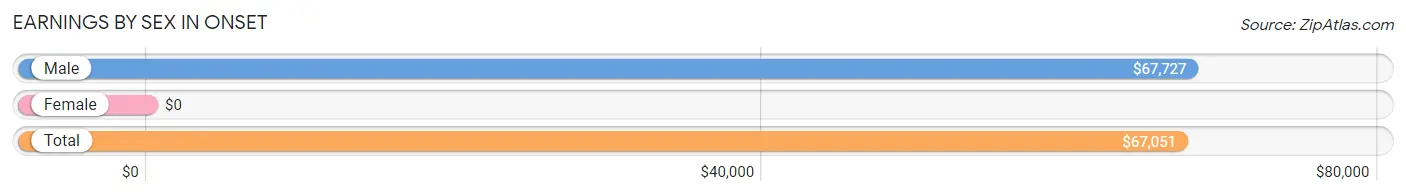
Earnings by Sex in Onset
| Sex | Number | Average Earnings |
| Male | 330 (44.5%) | $67,727 |
| Female | 412 (55.5%) | $0 |
| Total | 742 (100.0%) | $67,051 |
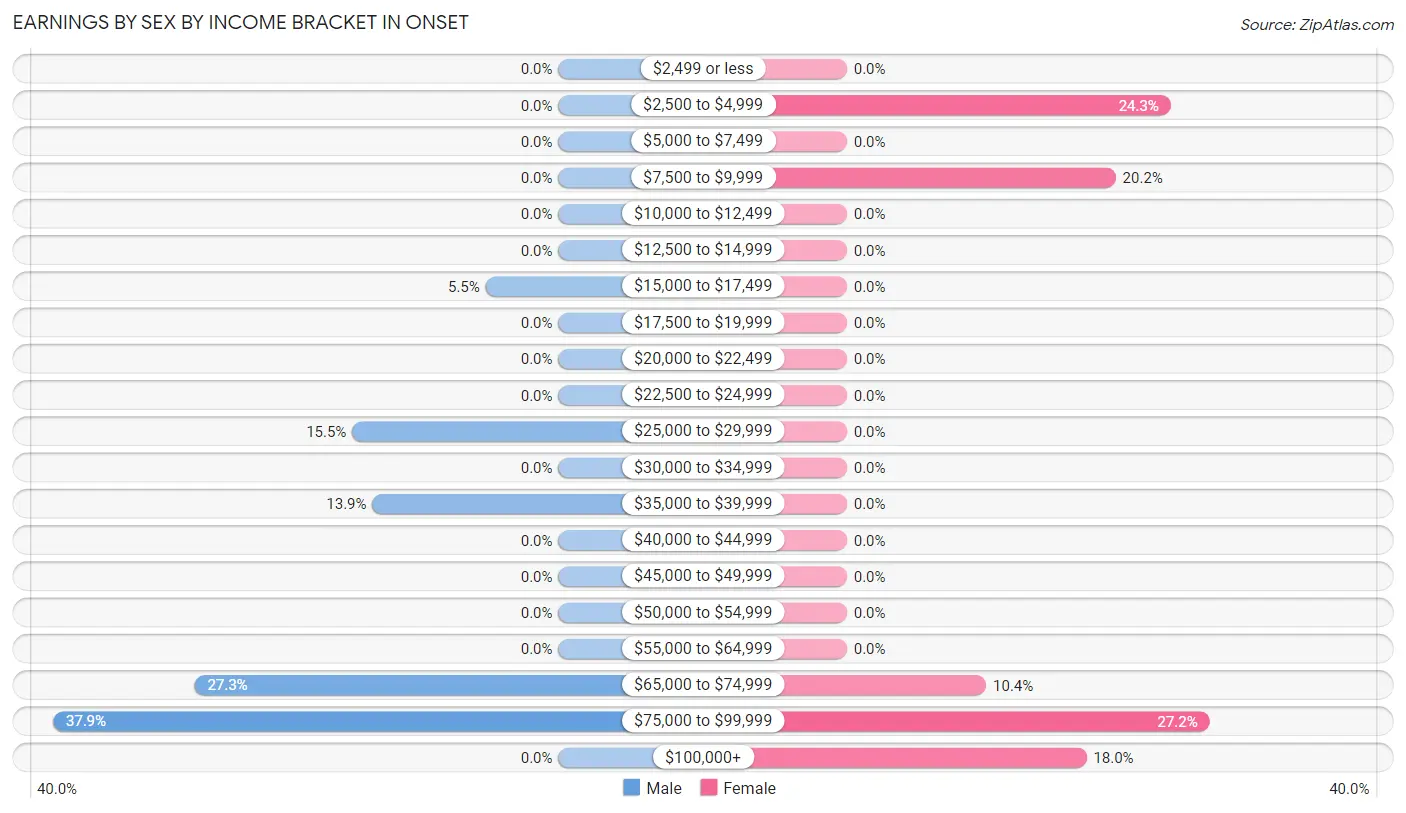
Earnings by Sex by Income Bracket in Onset
The most common earnings brackets in Onset are $75,000 to $99,999 for men (125 | 37.9%) and $75,000 to $99,999 for women (112 | 27.2%).
| Income | Male | Female |
| $2,499 or less | 0 (0.0%) | 0 (0.0%) |
| $2,500 to $4,999 | 0 (0.0%) | 100 (24.3%) |
| $5,000 to $7,499 | 0 (0.0%) | 0 (0.0%) |
| $7,500 to $9,999 | 0 (0.0%) | 83 (20.2%) |
| $10,000 to $12,499 | 0 (0.0%) | 0 (0.0%) |
| $12,500 to $14,999 | 0 (0.0%) | 0 (0.0%) |
| $15,000 to $17,499 | 18 (5.4%) | 0 (0.0%) |
| $17,500 to $19,999 | 0 (0.0%) | 0 (0.0%) |
| $20,000 to $22,499 | 0 (0.0%) | 0 (0.0%) |
| $22,500 to $24,999 | 0 (0.0%) | 0 (0.0%) |
| $25,000 to $29,999 | 51 (15.4%) | 0 (0.0%) |
| $30,000 to $34,999 | 0 (0.0%) | 0 (0.0%) |
| $35,000 to $39,999 | 46 (13.9%) | 0 (0.0%) |
| $40,000 to $44,999 | 0 (0.0%) | 0 (0.0%) |
| $45,000 to $49,999 | 0 (0.0%) | 0 (0.0%) |
| $50,000 to $54,999 | 0 (0.0%) | 0 (0.0%) |
| $55,000 to $64,999 | 0 (0.0%) | 0 (0.0%) |
| $65,000 to $74,999 | 90 (27.3%) | 43 (10.4%) |
| $75,000 to $99,999 | 125 (37.9%) | 112 (27.2%) |
| $100,000+ | 0 (0.0%) | 74 (18.0%) |
| Total | 330 (100.0%) | 412 (100.0%) |
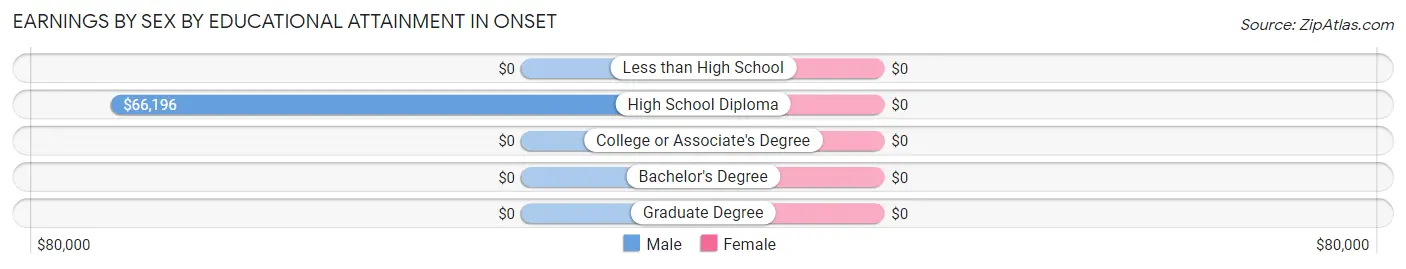
Earnings by Sex by Educational Attainment in Onset
| Educational Attainment | Male Income | Female Income |
| Less than High School | - | - |
| High School Diploma | $66,196 | $0 |
| College or Associate's Degree | - | - |
| Bachelor's Degree | - | - |
| Graduate Degree | - | - |
| Total | $67,727 | $90,790 |
Family Income in Onset
Family Income Brackets in Onset
According to the Onset family income data, there are 144 families falling into the $200,000+ income range, which is the most common income bracket and makes up 43.9% of all families.
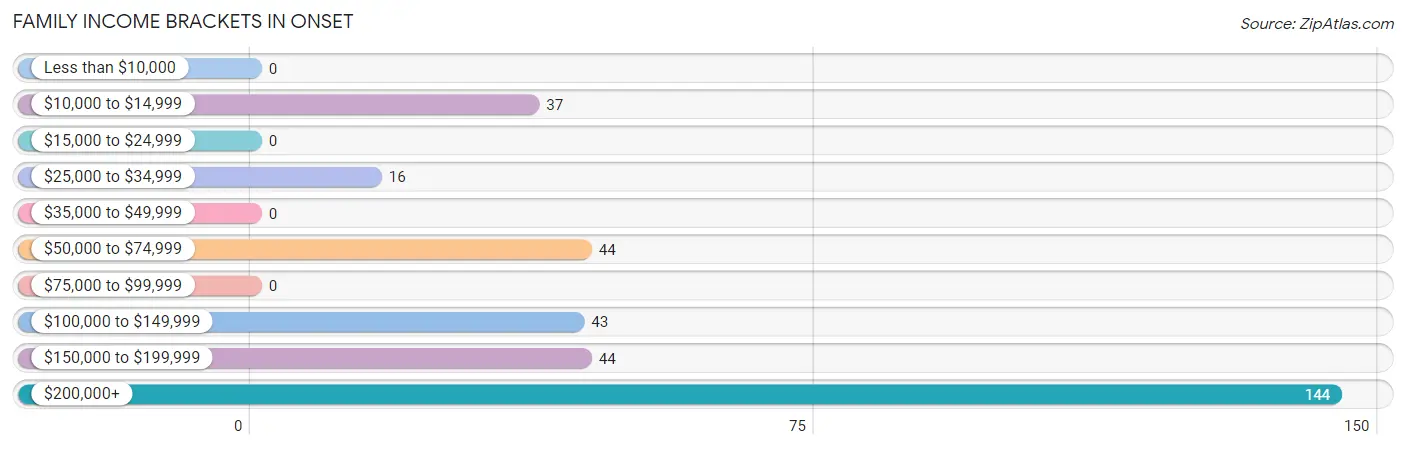
| Income Bracket | # Families | % Families |
| Less than $10,000 | 0 | 0.0% |
| $10,000 to $14,999 | 37 | 11.3% |
| $15,000 to $24,999 | 0 | 0.0% |
| $25,000 to $34,999 | 16 | 4.9% |
| $35,000 to $49,999 | 0 | 0.0% |
| $50,000 to $74,999 | 44 | 13.4% |
| $75,000 to $99,999 | 0 | 0.0% |
| $100,000 to $149,999 | 43 | 13.1% |
| $150,000 to $199,999 | 44 | 13.4% |
| $200,000+ | 144 | 43.9% |
Family Income by Famaliy Size in Onset
2-person families (194 | 59.2%) account for the highest median family income in Onset with $163,466 per family, while 2-person families (194 | 59.2%) have the highest median income of $81,733 per family member.
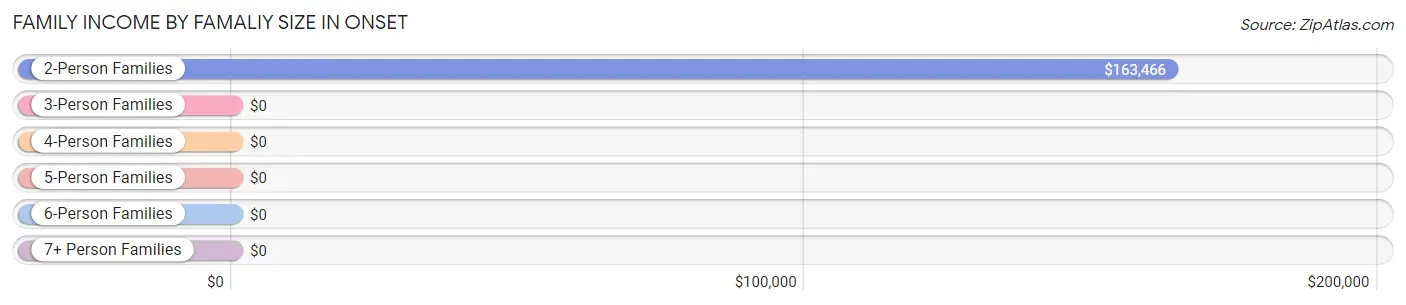
| Income Bracket | # Families | Median Income |
| 2-Person Families | 194 (59.2%) | $163,466 |
| 3-Person Families | 121 (36.9%) | $0 |
| 4-Person Families | 13 (4.0%) | $0 |
| 5-Person Families | 0 (0.0%) | $0 |
| 6-Person Families | 0 (0.0%) | $0 |
| 7+ Person Families | 0 (0.0%) | $0 |
| Total | 328 (100.0%) | $163,864 |
Family Income by Number of Earners in Onset
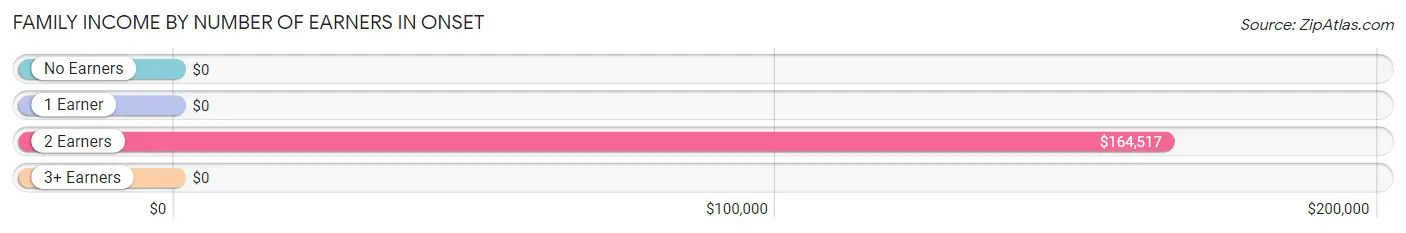
| Number of Earners | # Families | Median Income |
| No Earners | 0 (0.0%) | $0 |
| 1 Earner | 171 (52.1%) | $0 |
| 2 Earners | 157 (47.9%) | $164,517 |
| 3+ Earners | 0 (0.0%) | $0 |
| Total | 328 (100.0%) | $163,864 |
Household Income in Onset
Household Income Brackets in Onset
With 187 households falling in the category, the $200,000+ income range is the most frequent in Onset, accounting for 27.5% of all households.
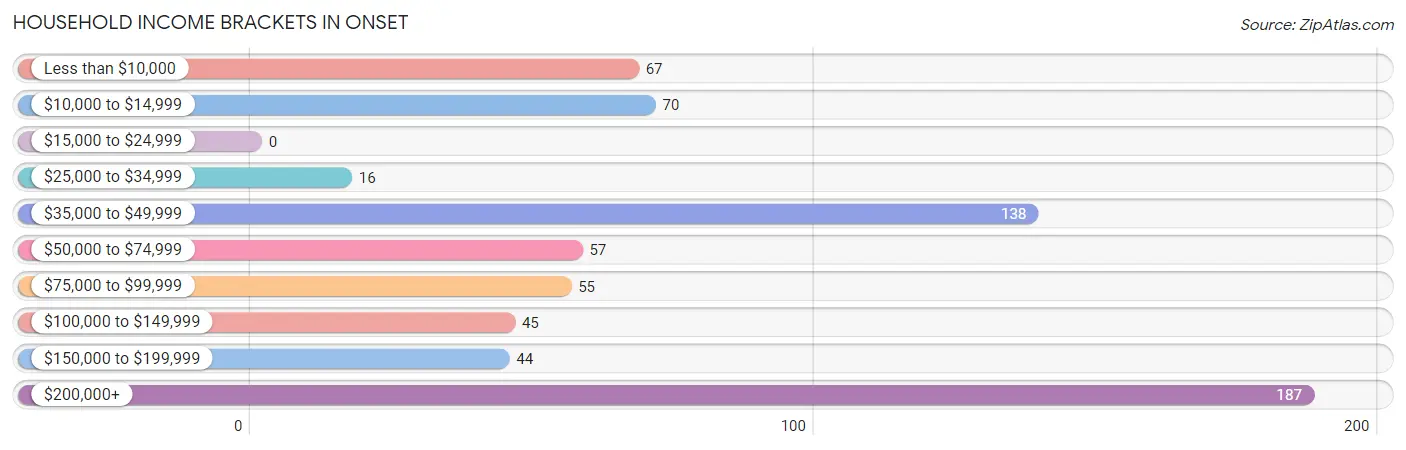
| Income Bracket | # Households | % Households |
| Less than $10,000 | 67 | 9.9% |
| $10,000 to $14,999 | 70 | 10.3% |
| $15,000 to $24,999 | 0 | 0.0% |
| $25,000 to $34,999 | 16 | 2.4% |
| $35,000 to $49,999 | 138 | 20.3% |
| $50,000 to $74,999 | 57 | 8.4% |
| $75,000 to $99,999 | 55 | 8.1% |
| $100,000 to $149,999 | 45 | 6.6% |
| $150,000 to $199,999 | 44 | 6.5% |
| $200,000+ | 187 | 27.5% |
Household Income by Householder Age in Onset
The median household income in Onset is $72,017, with the highest median household income of $70,170 found in the 65+ years age bracket for the primary householder. A total of 312 households (46.0%) fall into this category.
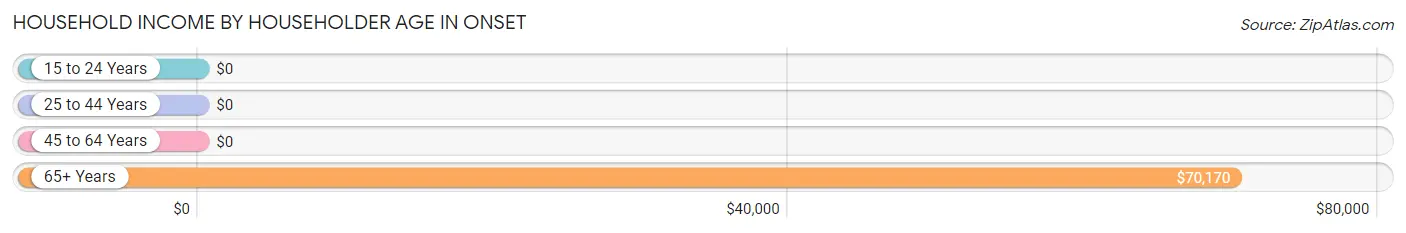
| Income Bracket | # Households | Median Income |
| 15 to 24 Years | 0 (0.0%) | $0 |
| 25 to 44 Years | 125 (18.4%) | $0 |
| 45 to 64 Years | 242 (35.6%) | $0 |
| 65+ Years | 312 (46.0%) | $70,170 |
| Total | 679 (100.0%) | $72,017 |
Poverty in Onset
Income Below Poverty by Sex and Age in Onset
With 18.4% poverty level for males and 23.4% for females among the residents of Onset, 75 year old and over males and 18 to 24 year old females are the most vulnerable to poverty, with 37 males (38.5%) and 83 females (100.0%) in their respective age groups living below the poverty level.
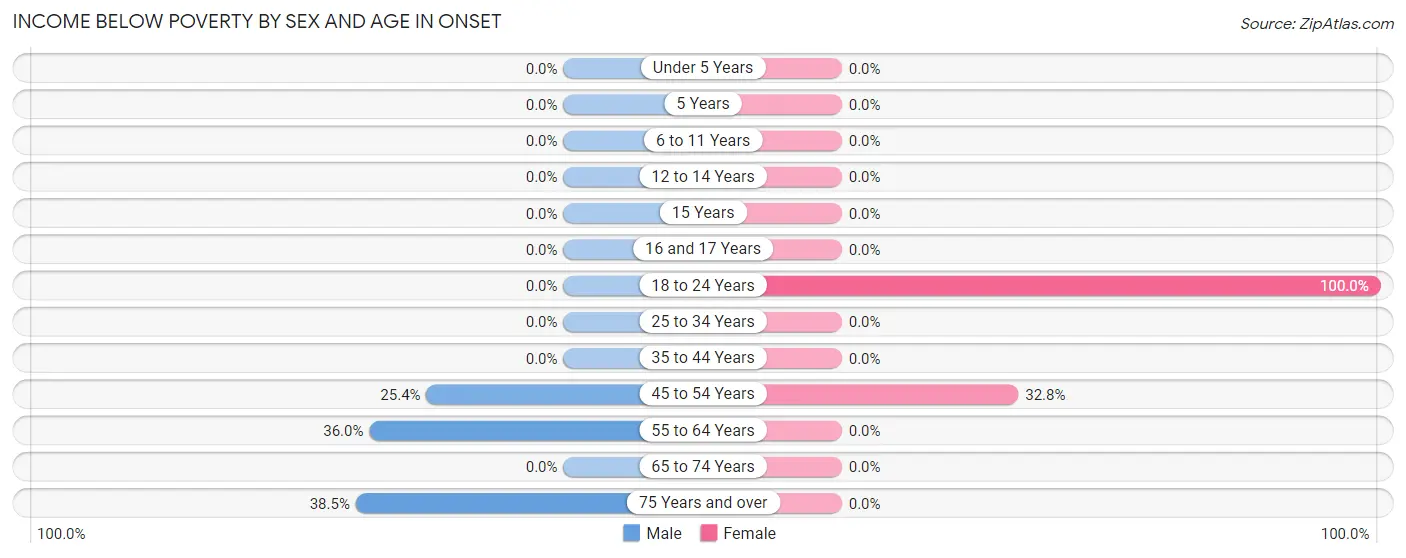
| Age Bracket | Male | Female |
| Under 5 Years | 0 (0.0%) | 0 (0.0%) |
| 5 Years | 0 (0.0%) | 0 (0.0%) |
| 6 to 11 Years | 0 (0.0%) | 0 (0.0%) |
| 12 to 14 Years | 0 (0.0%) | 0 (0.0%) |
| 15 Years | 0 (0.0%) | 0 (0.0%) |
| 16 and 17 Years | 0 (0.0%) | 0 (0.0%) |
| 18 to 24 Years | 0 (0.0%) | 83 (100.0%) |
| 25 to 34 Years | 0 (0.0%) | 0 (0.0%) |
| 35 to 44 Years | 0 (0.0%) | 0 (0.0%) |
| 45 to 54 Years | 15 (25.4%) | 76 (32.8%) |
| 55 to 64 Years | 67 (36.0%) | 0 (0.0%) |
| 65 to 74 Years | 0 (0.0%) | 0 (0.0%) |
| 75 Years and over | 37 (38.5%) | 0 (0.0%) |
| Total | 119 (18.4%) | 159 (23.4%) |
Income Above Poverty by Sex and Age in Onset
According to the poverty statistics in Onset, males aged under 5 years and females aged under 5 years are the age groups that are most secure financially, with 100.0% of males and 100.0% of females in these age groups living above the poverty line.
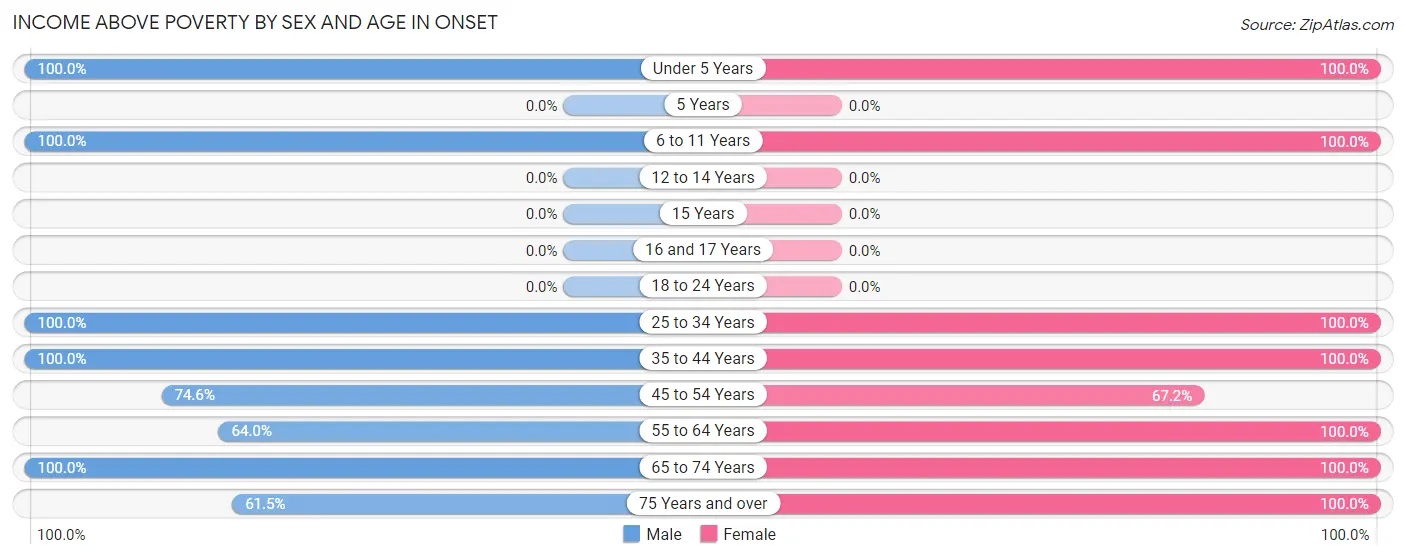
| Age Bracket | Male | Female |
| Under 5 Years | 15 (100.0%) | 15 (100.0%) |
| 5 Years | 0 (0.0%) | 0 (0.0%) |
| 6 to 11 Years | 65 (100.0%) | 61 (100.0%) |
| 12 to 14 Years | 0 (0.0%) | 0 (0.0%) |
| 15 Years | 0 (0.0%) | 0 (0.0%) |
| 16 and 17 Years | 0 (0.0%) | 0 (0.0%) |
| 18 to 24 Years | 0 (0.0%) | 0 (0.0%) |
| 25 to 34 Years | 51 (100.0%) | 13 (100.0%) |
| 35 to 44 Years | 46 (100.0%) | 78 (100.0%) |
| 45 to 54 Years | 44 (74.6%) | 156 (67.2%) |
| 55 to 64 Years | 119 (64.0%) | 43 (100.0%) |
| 65 to 74 Years | 129 (100.0%) | 57 (100.0%) |
| 75 Years and over | 59 (61.5%) | 97 (100.0%) |
| Total | 528 (81.6%) | 520 (76.6%) |
Income Below Poverty Among Married-Couple Families in Onset
The poverty statistics for married-couple families in Onset show that 22.2% or 37 of the total 167 families live below the poverty line. Families with no children have the highest poverty rate of 22.2%, comprising of 37 families. On the other hand, families with no children have the lowest poverty rate of 22.2%, which includes 37 families.
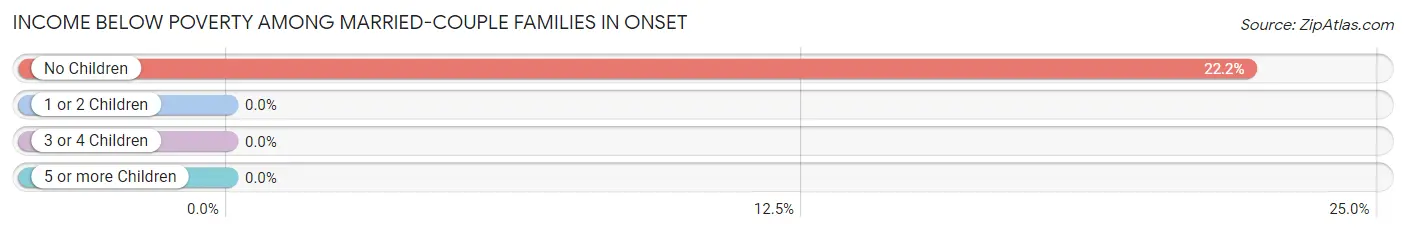
| Children | Above Poverty | Below Poverty |
| No Children | 130 (77.8%) | 37 (22.2%) |
| 1 or 2 Children | 0 (0.0%) | 0 (0.0%) |
| 3 or 4 Children | 0 (0.0%) | 0 (0.0%) |
| 5 or more Children | 0 (0.0%) | 0 (0.0%) |
| Total | 130 (77.8%) | 37 (22.2%) |
Income Below Poverty Among Single-Parent Households in Onset
| Children | Single Father | Single Mother |
| No Children | 0 (0.0%) | 0 (0.0%) |
| 1 or 2 Children | 0 (0.0%) | 0 (0.0%) |
| 3 or 4 Children | 0 (0.0%) | 0 (0.0%) |
| 5 or more Children | 0 (0.0%) | 0 (0.0%) |
| Total | 0 (0.0%) | 0 (0.0%) |
Income Below Poverty Among Married-Couple vs Single-Parent Households in Onset
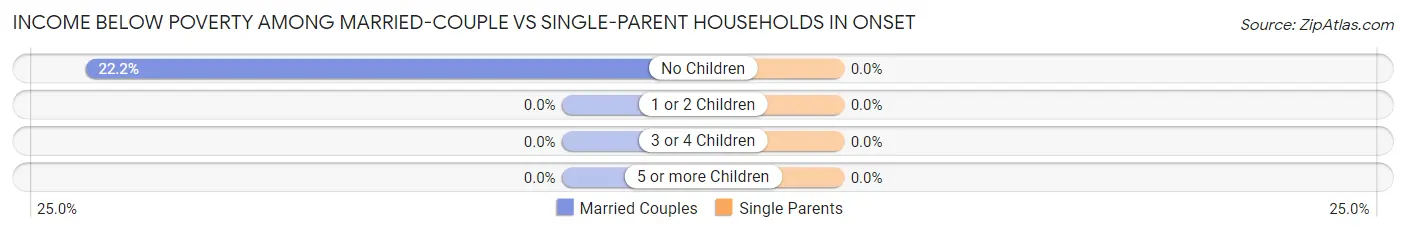
| Children | Married-Couple Families | Single-Parent Households |
| No Children | 37 (22.2%) | 0 (0.0%) |
| 1 or 2 Children | 0 (0.0%) | 0 (0.0%) |
| 3 or 4 Children | 0 (0.0%) | 0 (0.0%) |
| 5 or more Children | 0 (0.0%) | 0 (0.0%) |
| Total | 37 (22.2%) | 0 (0.0%) |
Race in Onset
The most populous races in Onset are White / Caucasian (854 | 64.4%), Some other Race (206 | 15.5%), and Two or more Races (187 | 14.1%).
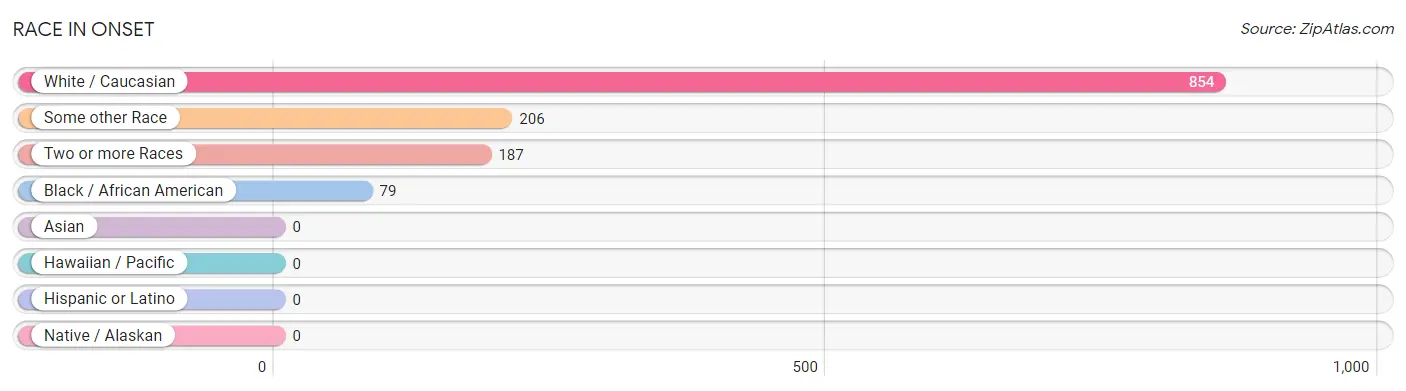
| Race | # Population | % Population |
| Asian | 0 | 0.0% |
| Black / African American | 79 | 6.0% |
| Hawaiian / Pacific | 0 | 0.0% |
| Hispanic or Latino | 0 | 0.0% |
| Native / Alaskan | 0 | 0.0% |
| White / Caucasian | 854 | 64.4% |
| Two or more Races | 187 | 14.1% |
| Some other Race | 206 | 15.5% |
| Total | 1,326 | 100.0% |
Ancestry in Onset
The most populous ancestries reported in Onset are Irish (457 | 34.5%), Cape Verdean (398 | 30.0%), Subsaharan African (398 | 30.0%), Italian (256 | 19.3%), and English (156 | 11.8%), together accounting for 125.6% of all Onset residents.
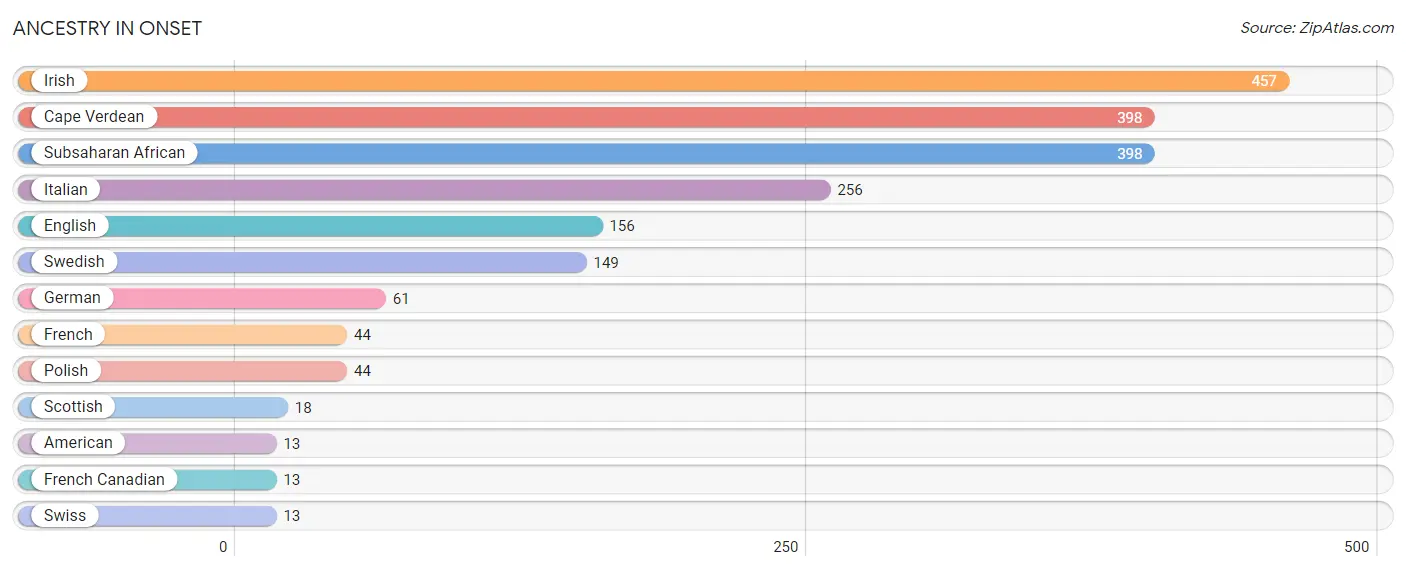
| Ancestry | # Population | % Population |
| American | 13 | 1.0% |
| Cape Verdean | 398 | 30.0% |
| English | 156 | 11.8% |
| French | 44 | 3.3% |
| French Canadian | 13 | 1.0% |
| German | 61 | 4.6% |
| Irish | 457 | 34.5% |
| Italian | 256 | 19.3% |
| Polish | 44 | 3.3% |
| Scottish | 18 | 1.4% |
| Subsaharan African | 398 | 30.0% |
| Swedish | 149 | 11.2% |
| Swiss | 13 | 1.0% | View All 13 Rows |
Immigrants in Onset
The most numerous immigrant groups reported in Onset came from Brazil (15 | 1.1%), Latin America (15 | 1.1%), South America (15 | 1.1%), Europe (13 | 1.0%), and Switzerland (13 | 1.0%), together accounting for 5.4% of all Onset residents.
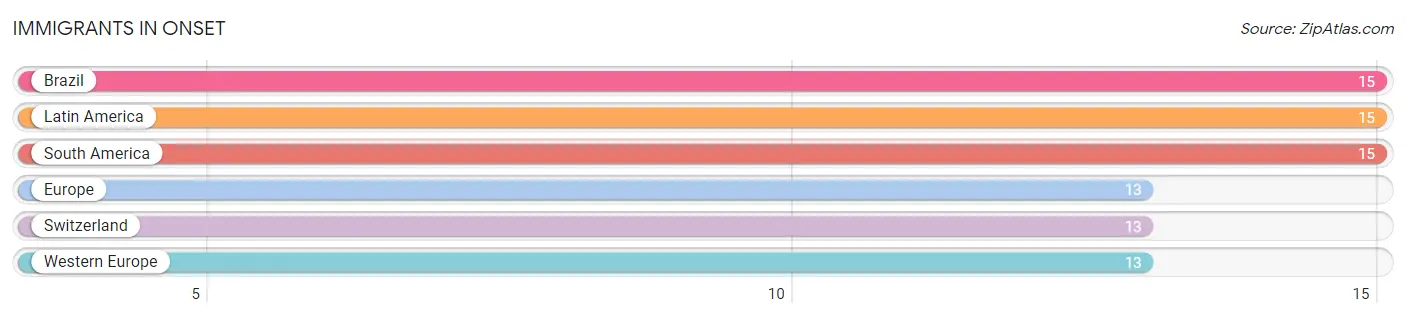
| Immigration Origin | # Population | % Population |
| Brazil | 15 | 1.1% |
| Europe | 13 | 1.0% |
| Latin America | 15 | 1.1% |
| South America | 15 | 1.1% |
| Switzerland | 13 | 1.0% |
| Western Europe | 13 | 1.0% | View All 6 Rows |
Sex and Age in Onset
Sex and Age in Onset
The most populous age groups in Onset are 65 to 69 Years (129 | 19.9%) for men and 50 to 54 Years (145 | 21.3%) for women.
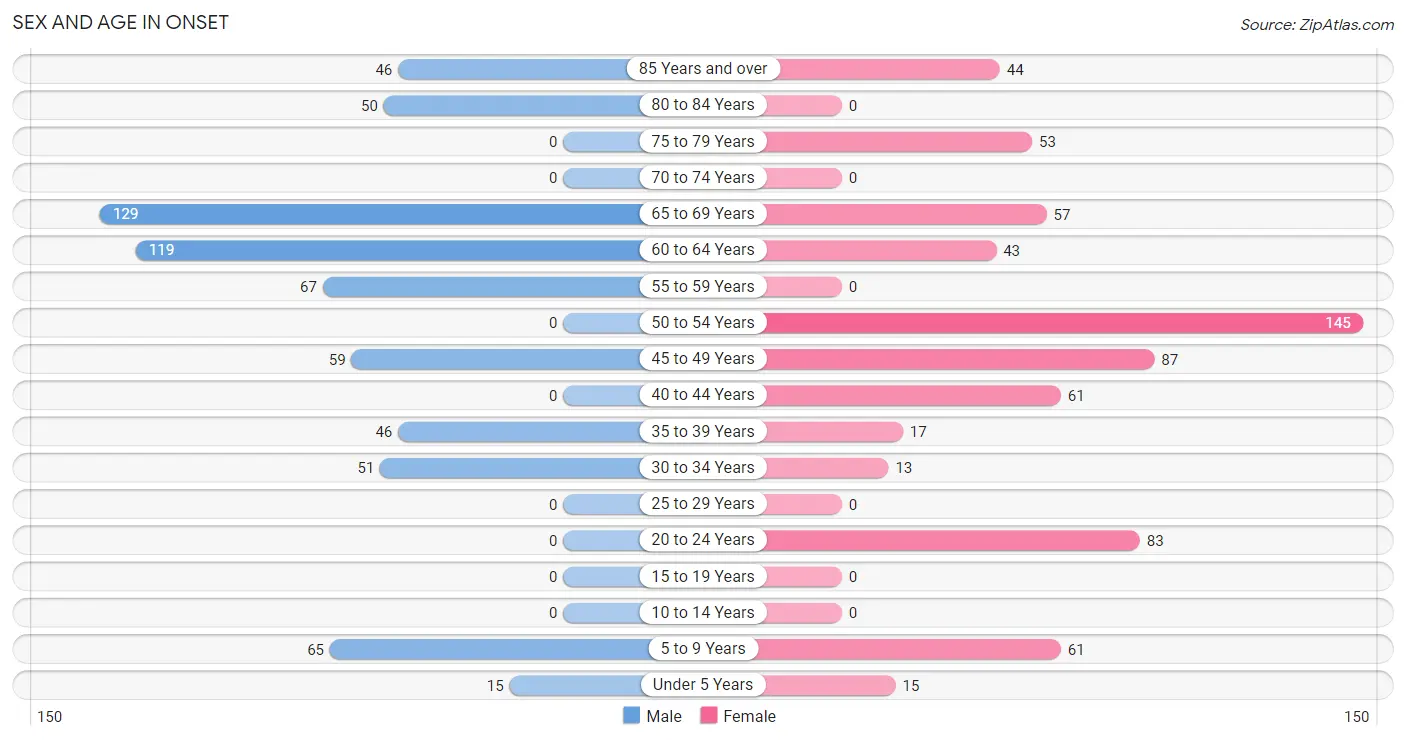
| Age Bracket | Male | Female |
| Under 5 Years | 15 (2.3%) | 15 (2.2%) |
| 5 to 9 Years | 65 (10.1%) | 61 (9.0%) |
| 10 to 14 Years | 0 (0.0%) | 0 (0.0%) |
| 15 to 19 Years | 0 (0.0%) | 0 (0.0%) |
| 20 to 24 Years | 0 (0.0%) | 83 (12.2%) |
| 25 to 29 Years | 0 (0.0%) | 0 (0.0%) |
| 30 to 34 Years | 51 (7.9%) | 13 (1.9%) |
| 35 to 39 Years | 46 (7.1%) | 17 (2.5%) |
| 40 to 44 Years | 0 (0.0%) | 61 (9.0%) |
| 45 to 49 Years | 59 (9.1%) | 87 (12.8%) |
| 50 to 54 Years | 0 (0.0%) | 145 (21.3%) |
| 55 to 59 Years | 67 (10.4%) | 0 (0.0%) |
| 60 to 64 Years | 119 (18.4%) | 43 (6.3%) |
| 65 to 69 Years | 129 (19.9%) | 57 (8.4%) |
| 70 to 74 Years | 0 (0.0%) | 0 (0.0%) |
| 75 to 79 Years | 0 (0.0%) | 53 (7.8%) |
| 80 to 84 Years | 50 (7.7%) | 0 (0.0%) |
| 85 Years and over | 46 (7.1%) | 44 (6.5%) |
| Total | 647 (100.0%) | 679 (100.0%) |
Families and Households in Onset
Median Family Size in Onset
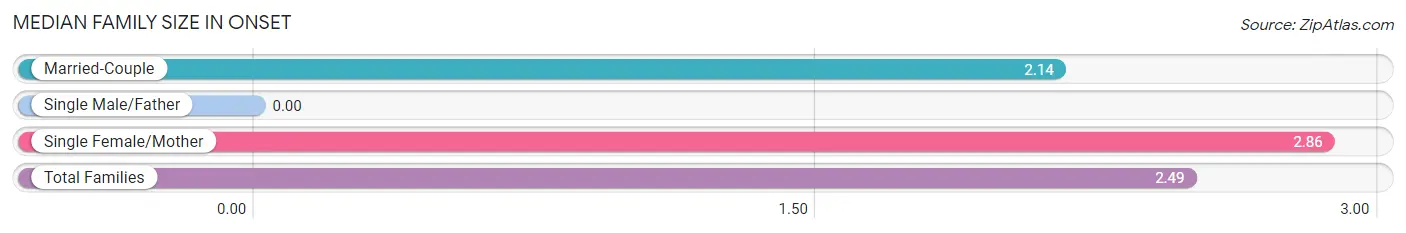
| Family Type | # Families | Family Size |
| Married-Couple | 167 (50.9%) | 2.14 |
| Single Male/Father | 0 (0.0%) | - |
| Single Female/Mother | 161 (49.1%) | 2.86 |
| Total Families | 328 (100.0%) | 2.49 |
Median Household Size in Onset
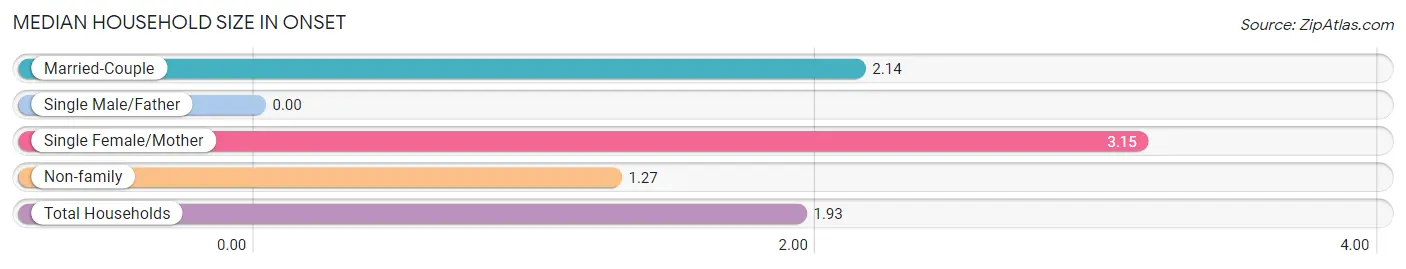
| Household Type | # Households | Household Size |
| Married-Couple | 167 (24.6%) | 2.14 |
| Single Male/Father | 0 (0.0%) | - |
| Single Female/Mother | 161 (23.7%) | 3.15 |
| Non-family | 351 (51.7%) | 1.27 |
| Total Households | 679 (100.0%) | 1.93 |
Household Size by Marriage Status in Onset
Out of a total of 679 households in Onset, 328 (48.3%) are family households, while 351 (51.7%) are nonfamily households. The most numerous type of family households are 3-person households, comprising 164, and the most common type of nonfamily households are 1-person households, comprising 287.
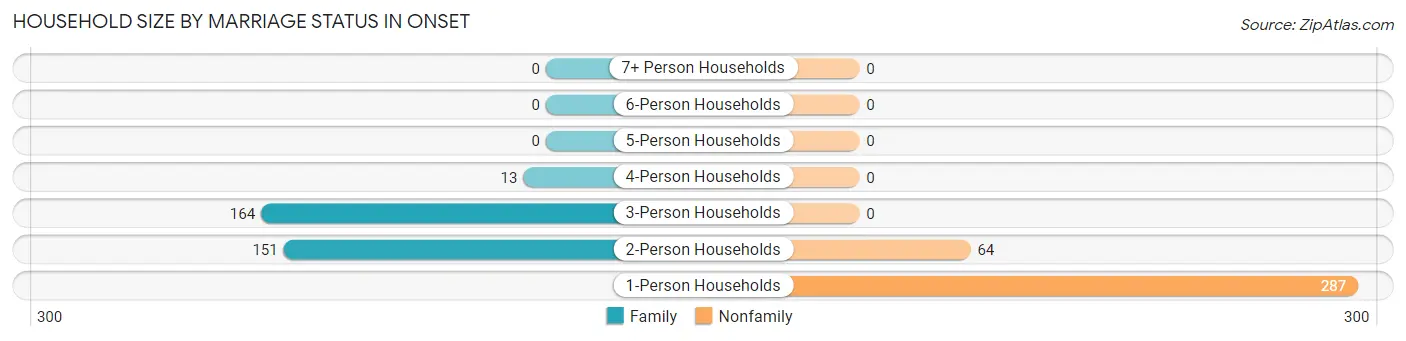
| Household Size | Family Households | Nonfamily Households |
| 1-Person Households | - | 287 (42.3%) |
| 2-Person Households | 151 (22.2%) | 64 (9.4%) |
| 3-Person Households | 164 (24.1%) | 0 (0.0%) |
| 4-Person Households | 13 (1.9%) | 0 (0.0%) |
| 5-Person Households | 0 (0.0%) | 0 (0.0%) |
| 6-Person Households | 0 (0.0%) | 0 (0.0%) |
| 7+ Person Households | 0 (0.0%) | 0 (0.0%) |
| Total | 328 (48.3%) | 351 (51.7%) |
Female Fertility in Onset
Fertility by Age in Onset
| Age Bracket | Women with Births | Births / 1,000 Women |
| 15 to 19 years | 0 (0.0%) | 0.0 |
| 20 to 34 years | 0 (0.0%) | 0.0 |
| 35 to 50 years | 0 (0.0%) | 0.0 |
| Total | 0 (0.0%) | 0.0 |
Fertility by Age by Marriage Status in Onset
| Age Bracket | Married | Unmarried |
| 15 to 19 years | 0 (0.0%) | 0 (0.0%) |
| 20 to 34 years | 0 (0.0%) | 0 (0.0%) |
| 35 to 50 years | 0 (0.0%) | 0 (0.0%) |
| Total | 0 (0.0%) | 0 (0.0%) |
Fertility by Education in Onset
| Educational Attainment | Women with Births | Births / 1,000 Women |
| Less than High School | 0 (0.0%) | 0.0 |
| High School Diploma | 0 (0.0%) | 0.0 |
| College or Associate's Degree | 0 (0.0%) | 0.0 |
| Bachelor's Degree | 0 (0.0%) | 0.0 |
| Graduate Degree | 0 (0.0%) | 0.0 |
| Total | 0 (0.0%) | 0.0 |
Fertility by Education by Marriage Status in Onset
| Educational Attainment | Married | Unmarried |
| Less than High School | 0 (0.0%) | 0 (0.0%) |
| High School Diploma | 0 (0.0%) | 0 (0.0%) |
| College or Associate's Degree | 0 (0.0%) | 0 (0.0%) |
| Bachelor's Degree | 0 (0.0%) | 0 (0.0%) |
| Graduate Degree | 0 (0.0%) | 0 (0.0%) |
| Total | 0 (0.0%) | 0 (0.0%) |
Employment Characteristics in Onset
Employment by Class of Employer in Onset
Among the 515 employed individuals in Onset, private company employees (301 | 58.5%), not-for-profit organizations (131 | 25.4%), and self-employed (not incorporated) (70 | 13.6%) make up the most common classes of employment.
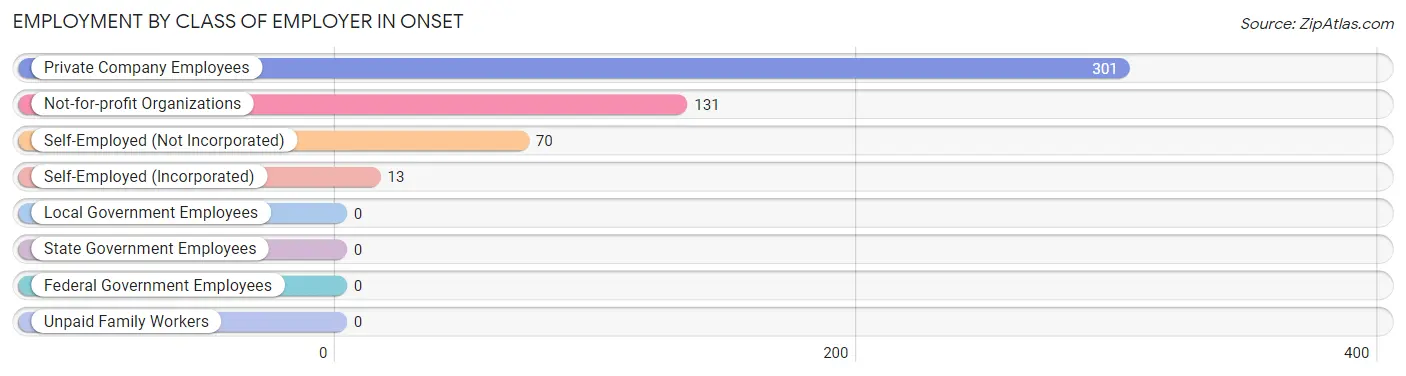
| Employer Class | # Employees | % Employees |
| Private Company Employees | 301 | 58.5% |
| Self-Employed (Incorporated) | 13 | 2.5% |
| Self-Employed (Not Incorporated) | 70 | 13.6% |
| Not-for-profit Organizations | 131 | 25.4% |
| Local Government Employees | 0 | 0.0% |
| State Government Employees | 0 | 0.0% |
| Federal Government Employees | 0 | 0.0% |
| Unpaid Family Workers | 0 | 0.0% |
| Total | 515 | 100.0% |
Employment Status by Age in Onset
According to the labor force statistics for Onset, out of the total population over 16 years of age (1,170), 63.8% or 746 individuals are in the labor force, with 28.6% or 213 of them unemployed. The age group with the highest labor force participation rate is 20 to 24 years, with 100.0% or 83 individuals in the labor force. Within the labor force, the 30 to 34 years age range has the highest percentage of unemployed individuals, with 79.7% or 51 of them being unemployed.
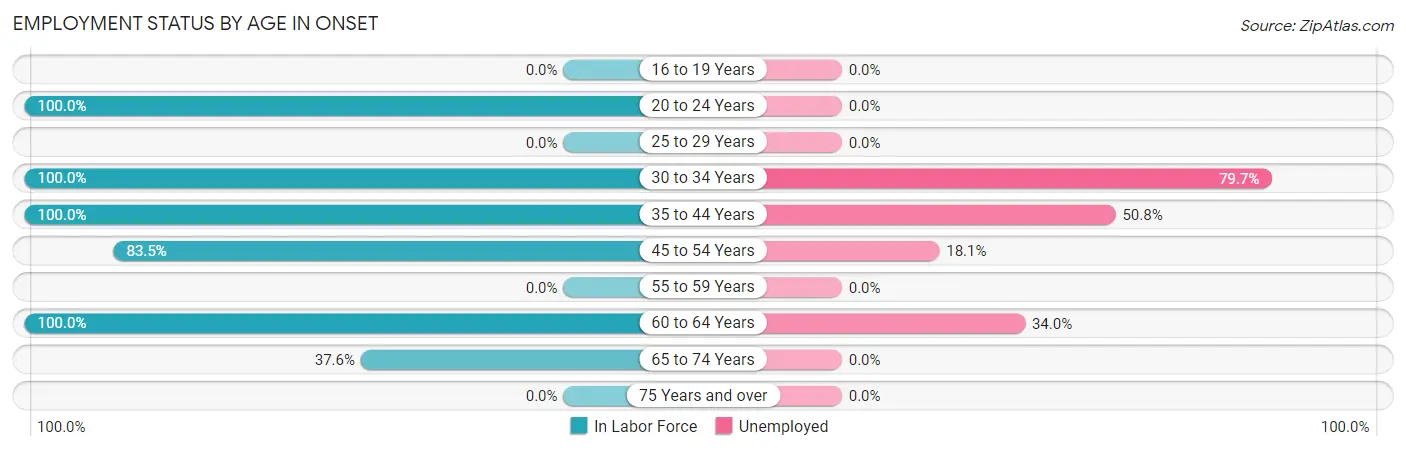
| Age Bracket | In Labor Force | Unemployed |
| 16 to 19 Years | 0 (0.0%) | 0 (0.0%) |
| 20 to 24 Years | 83 (100.0%) | 0 (0.0%) |
| 25 to 29 Years | 0 (0.0%) | 0 (0.0%) |
| 30 to 34 Years | 64 (100.0%) | 51 (79.7%) |
| 35 to 44 Years | 124 (100.0%) | 63 (50.8%) |
| 45 to 54 Years | 243 (83.5%) | 44 (18.1%) |
| 55 to 59 Years | 0 (0.0%) | 0 (0.0%) |
| 60 to 64 Years | 162 (100.0%) | 55 (34.0%) |
| 65 to 74 Years | 70 (37.6%) | 0 (0.0%) |
| 75 Years and over | 0 (0.0%) | 0 (0.0%) |
| Total | 746 (63.8%) | 213 (28.6%) |
Employment Status by Educational Attainment in Onset
According to labor force statistics for Onset, 83.8% of individuals (593) out of the total population between 25 and 64 years of age (708) are in the labor force, with 35.9% or 213 of them being unemployed. The group with the highest labor force participation rate are those with the educational attainment of college / associate degree, with 100.0% or 228 individuals in the labor force. Within the labor force, individuals with college / associate degree education have the highest percentage of unemployment, with 53.9% or 123 of them being unemployed.
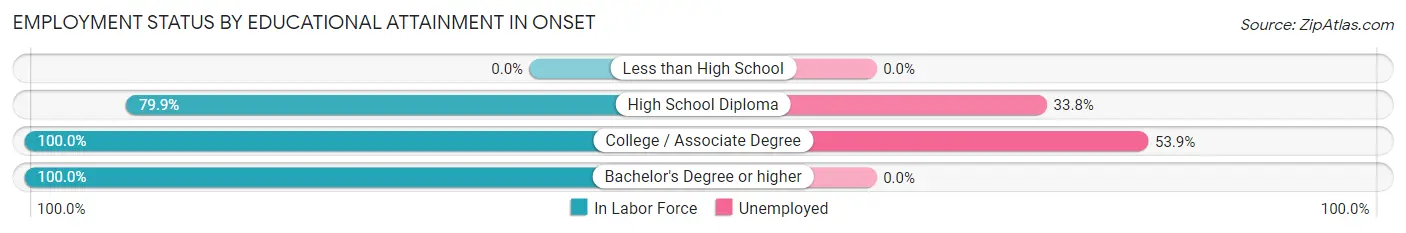
| Educational Attainment | In Labor Force | Unemployed |
| Less than High School | 0 (0.0%) | 0 (0.0%) |
| High School Diploma | 266 (79.9%) | 113 (33.8%) |
| College / Associate Degree | 228 (100.0%) | 123 (53.9%) |
| Bachelor's Degree or higher | 99 (100.0%) | 0 (0.0%) |
| Total | 593 (83.8%) | 254 (35.9%) |
Employment Occupations by Sex in Onset
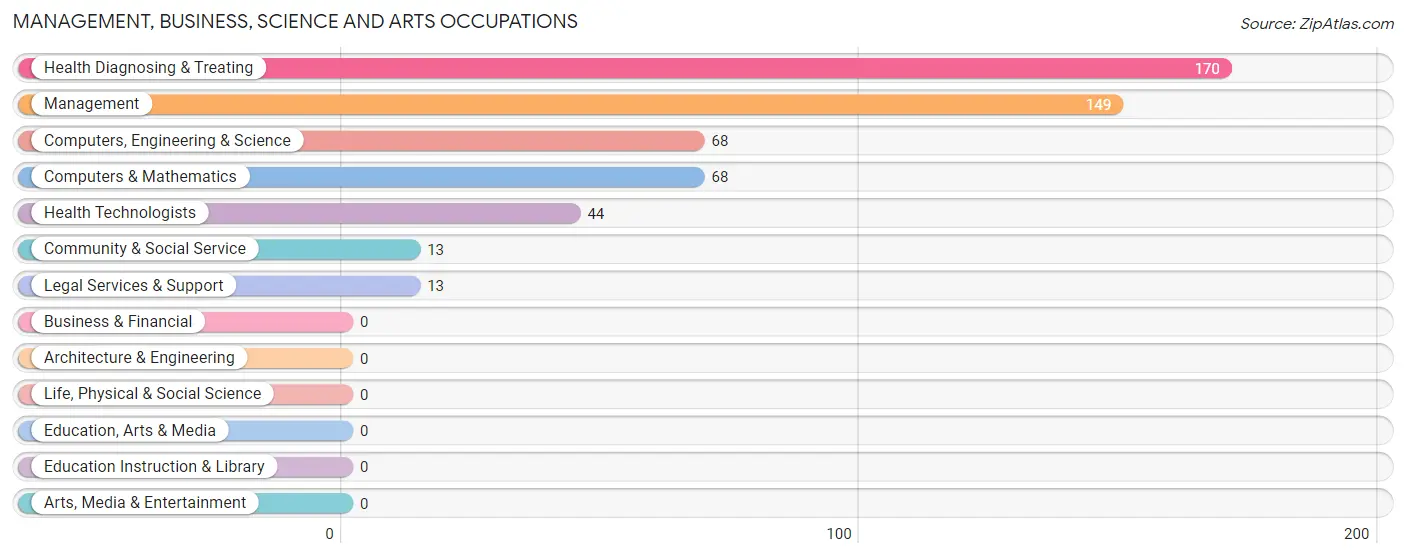
Management, Business, Science and Arts Occupations
The most common Management, Business, Science and Arts occupations in Onset are Health Diagnosing & Treating (170 | 31.9%), Management (149 | 28.0%), Computers, Engineering & Science (68 | 12.8%), Computers & Mathematics (68 | 12.8%), and Health Technologists (44 | 8.3%).
Management, Business, Science and Arts Occupations by Sex
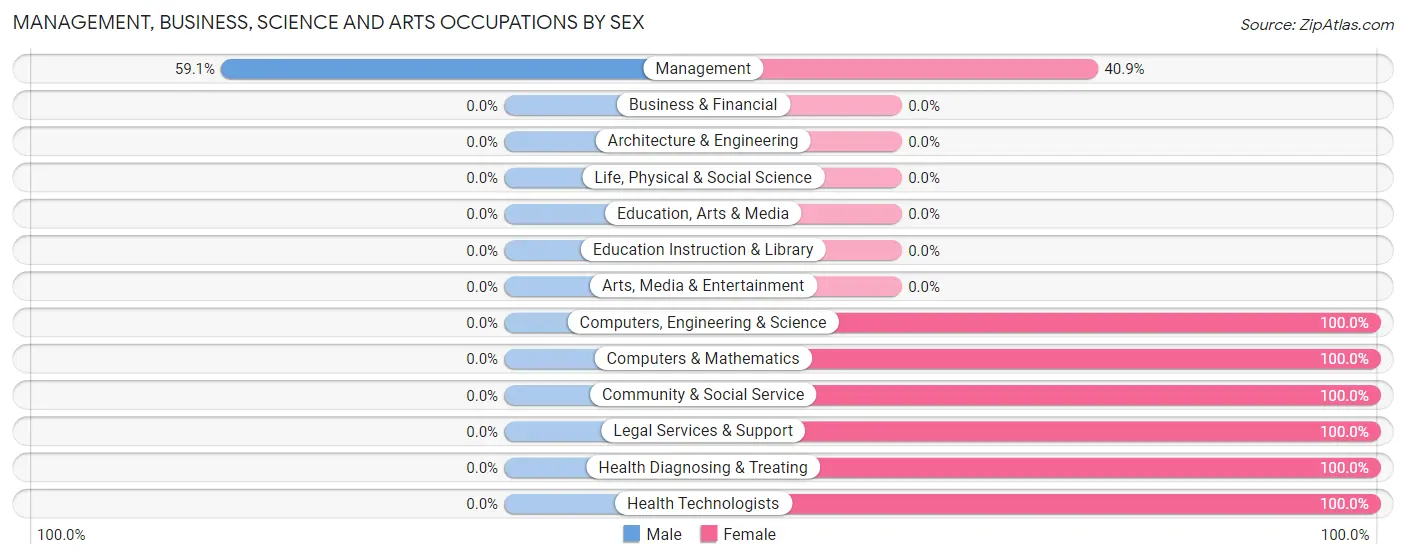
| Occupation | Male | Female |
| Management | 88 (59.1%) | 61 (40.9%) |
| Business & Financial | 0 (0.0%) | 0 (0.0%) |
| Computers, Engineering & Science | 0 (0.0%) | 68 (100.0%) |
| Computers & Mathematics | 0 (0.0%) | 68 (100.0%) |
| Architecture & Engineering | 0 (0.0%) | 0 (0.0%) |
| Life, Physical & Social Science | 0 (0.0%) | 0 (0.0%) |
| Community & Social Service | 0 (0.0%) | 13 (100.0%) |
| Education, Arts & Media | 0 (0.0%) | 0 (0.0%) |
| Legal Services & Support | 0 (0.0%) | 13 (100.0%) |
| Education Instruction & Library | 0 (0.0%) | 0 (0.0%) |
| Arts, Media & Entertainment | 0 (0.0%) | 0 (0.0%) |
| Health Diagnosing & Treating | 0 (0.0%) | 170 (100.0%) |
| Health Technologists | 0 (0.0%) | 44 (100.0%) |
| Total (Category) | 88 (22.0%) | 312 (78.0%) |
| Total (Overall) | 178 (33.4%) | 355 (66.6%) |
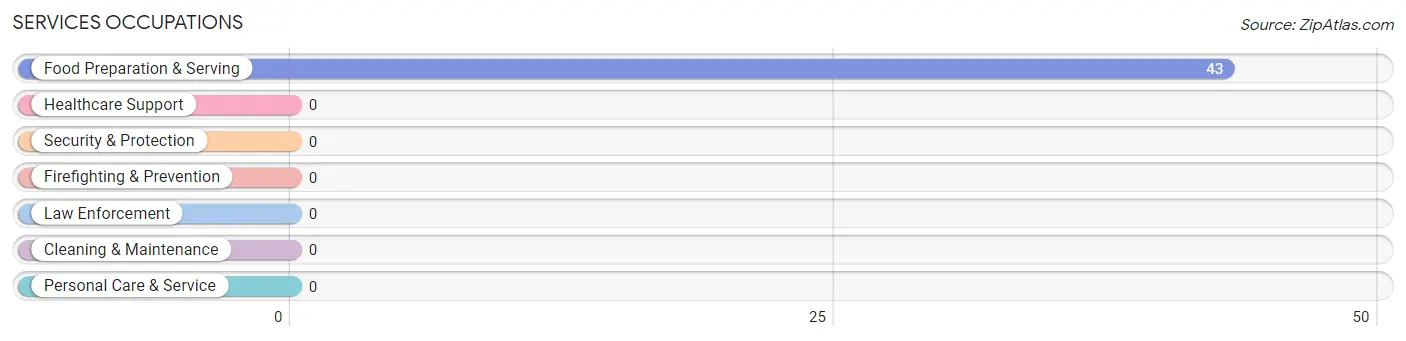
Services Occupations
The most common Services occupations in Onset are , and Food Preparation & Serving (43 | 8.1%).
Services Occupations by Sex
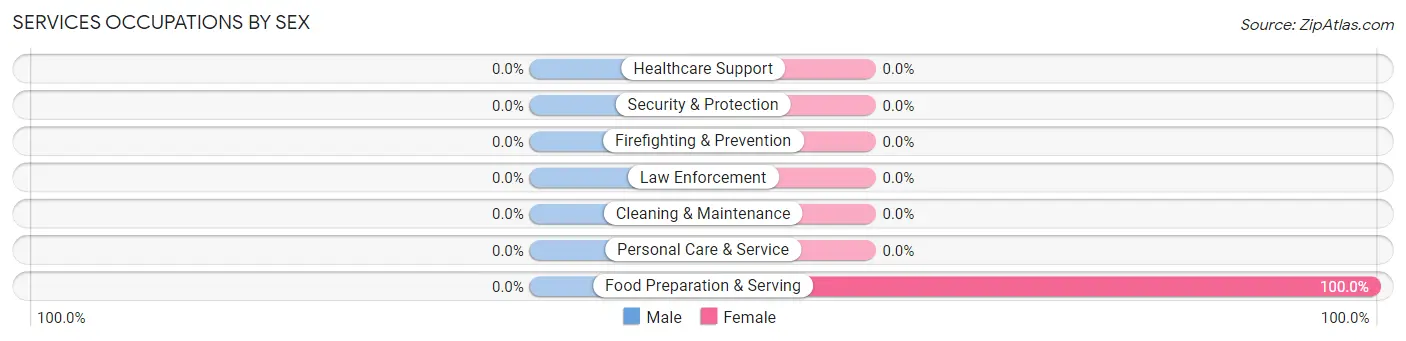
| Occupation | Male | Female |
| Healthcare Support | 0 (0.0%) | 0 (0.0%) |
| Security & Protection | 0 (0.0%) | 0 (0.0%) |
| Firefighting & Prevention | 0 (0.0%) | 0 (0.0%) |
| Law Enforcement | 0 (0.0%) | 0 (0.0%) |
| Food Preparation & Serving | 0 (0.0%) | 43 (100.0%) |
| Cleaning & Maintenance | 0 (0.0%) | 0 (0.0%) |
| Personal Care & Service | 0 (0.0%) | 0 (0.0%) |
| Total (Category) | 0 (0.0%) | 43 (100.0%) |
| Total (Overall) | 178 (33.4%) | 355 (66.6%) |
Sales and Office Occupations
Sales and Office Occupations by Sex
| Occupation | Male | Female |
| Sales & Related | 0 (0.0%) | 0 (0.0%) |
| Office & Administration | 0 (0.0%) | 0 (0.0%) |
| Total (Category) | 0 (0.0%) | 0 (0.0%) |
| Total (Overall) | 178 (33.4%) | 355 (66.6%) |
Natural Resources, Construction and Maintenance Occupations
Natural Resources, Construction and Maintenance Occupations by Sex
| Occupation | Male | Female |
| Farming, Fishing & Forestry | 0 (0.0%) | 0 (0.0%) |
| Construction & Extraction | 0 (0.0%) | 0 (0.0%) |
| Installation, Maintenance & Repair | 0 (0.0%) | 0 (0.0%) |
| Total (Category) | 0 (0.0%) | 0 (0.0%) |
| Total (Overall) | 178 (33.4%) | 355 (66.6%) |
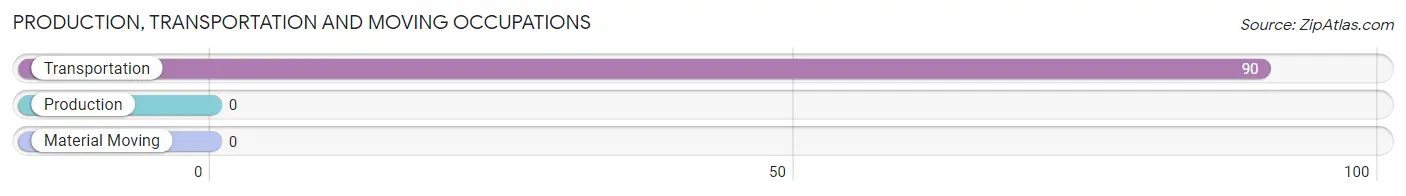
Production, Transportation and Moving Occupations
The most common Production, Transportation and Moving occupations in Onset are , and Transportation (90 | 16.9%).
Production, Transportation and Moving Occupations by Sex
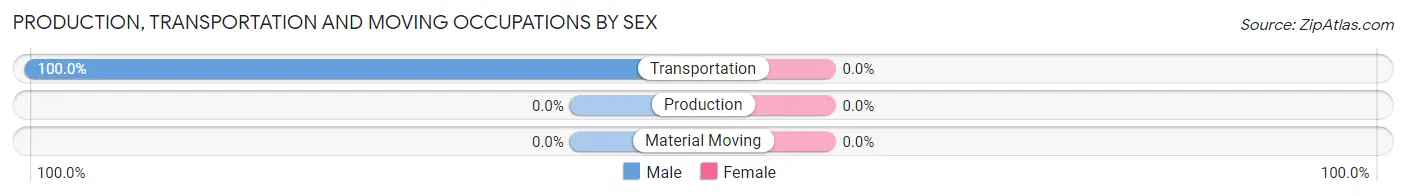
| Occupation | Male | Female |
| Production | 0 (0.0%) | 0 (0.0%) |
| Transportation | 90 (100.0%) | 0 (0.0%) |
| Material Moving | 0 (0.0%) | 0 (0.0%) |
| Total (Category) | 90 (100.0%) | 0 (0.0%) |
| Total (Overall) | 178 (33.4%) | 355 (66.6%) |
Employment Industries by Sex in Onset
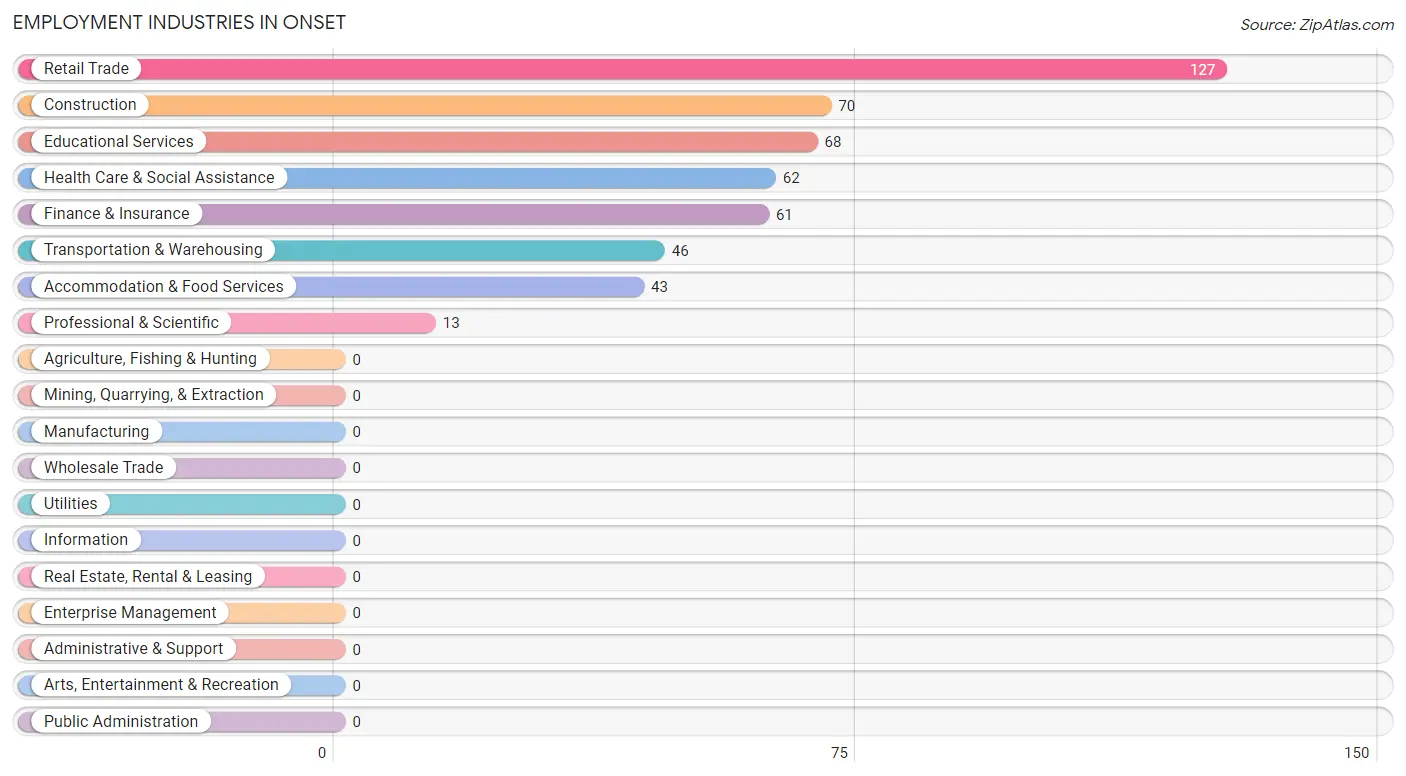
Employment Industries in Onset
The major employment industries in Onset include Retail Trade (127 | 23.8%), Construction (70 | 13.1%), Educational Services (68 | 12.8%), Health Care & Social Assistance (62 | 11.6%), and Finance & Insurance (61 | 11.4%).
Employment Industries by Sex in Onset
The Onset industries that see more men than women are Construction (100.0%), Transportation & Warehousing (100.0%), and Retail Trade (34.6%), whereas the industries that tend to have a higher number of women are Finance & Insurance (100.0%), Professional & Scientific (100.0%), and Educational Services (100.0%).
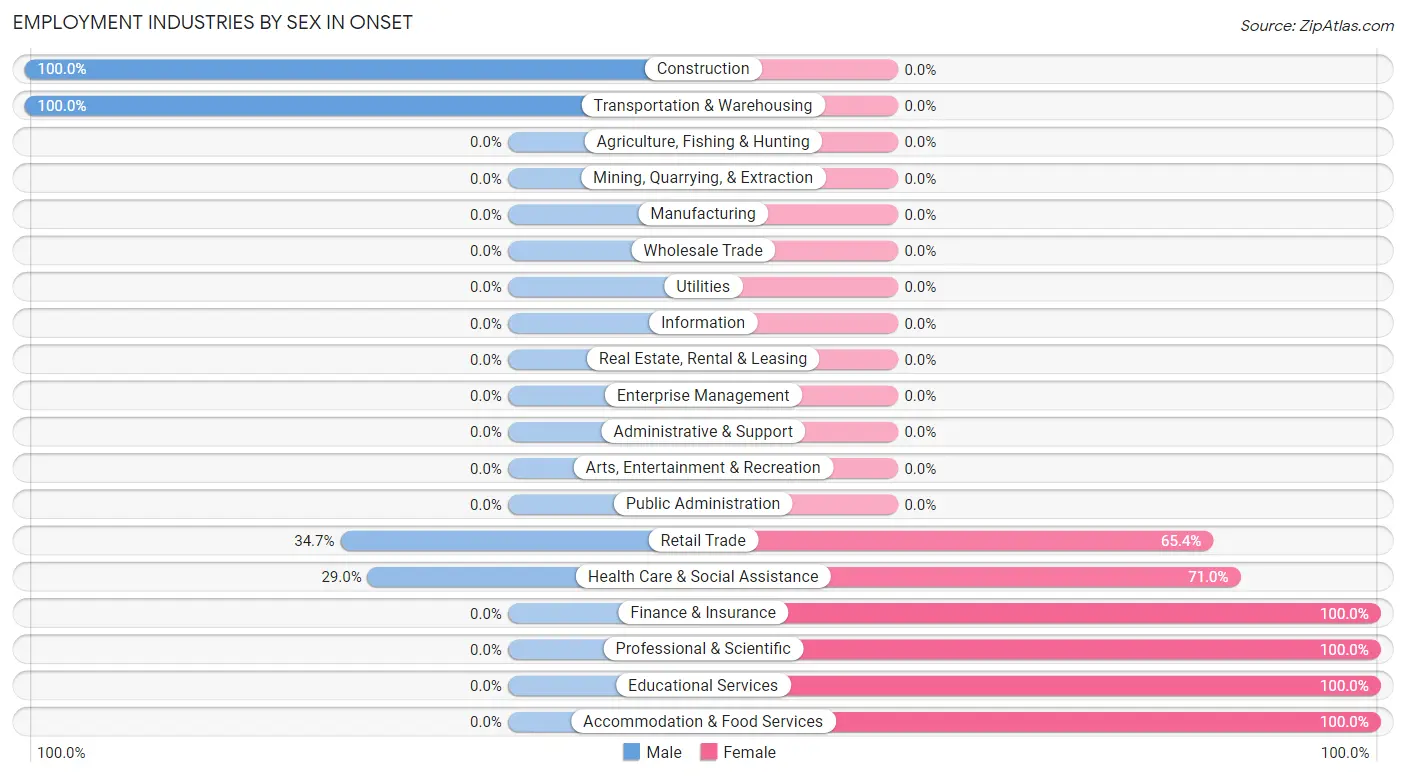
| Industry | Male | Female |
| Agriculture, Fishing & Hunting | 0 (0.0%) | 0 (0.0%) |
| Mining, Quarrying, & Extraction | 0 (0.0%) | 0 (0.0%) |
| Construction | 70 (100.0%) | 0 (0.0%) |
| Manufacturing | 0 (0.0%) | 0 (0.0%) |
| Wholesale Trade | 0 (0.0%) | 0 (0.0%) |
| Retail Trade | 44 (34.6%) | 83 (65.3%) |
| Transportation & Warehousing | 46 (100.0%) | 0 (0.0%) |
| Utilities | 0 (0.0%) | 0 (0.0%) |
| Information | 0 (0.0%) | 0 (0.0%) |
| Finance & Insurance | 0 (0.0%) | 61 (100.0%) |
| Real Estate, Rental & Leasing | 0 (0.0%) | 0 (0.0%) |
| Professional & Scientific | 0 (0.0%) | 13 (100.0%) |
| Enterprise Management | 0 (0.0%) | 0 (0.0%) |
| Administrative & Support | 0 (0.0%) | 0 (0.0%) |
| Educational Services | 0 (0.0%) | 68 (100.0%) |
| Health Care & Social Assistance | 18 (29.0%) | 44 (71.0%) |
| Arts, Entertainment & Recreation | 0 (0.0%) | 0 (0.0%) |
| Accommodation & Food Services | 0 (0.0%) | 43 (100.0%) |
| Public Administration | 0 (0.0%) | 0 (0.0%) |
| Total | 178 (33.4%) | 355 (66.6%) |
Education in Onset
School Enrollment in Onset
The most common levels of schooling among the 156 students in Onset are elementary school (126 | 80.8%), and nursery / preschool (30 | 19.2%).
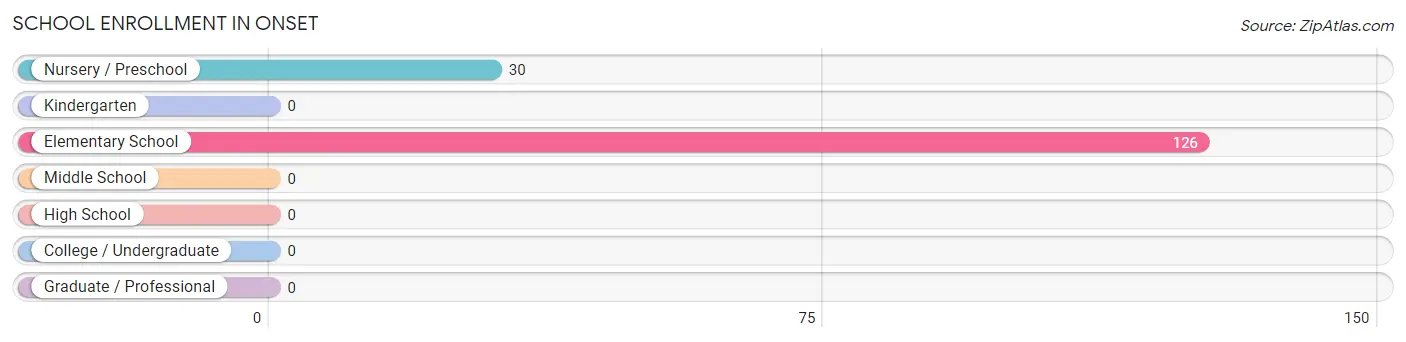
| School Level | # Students | % Students |
| Nursery / Preschool | 30 | 19.2% |
| Kindergarten | 0 | 0.0% |
| Elementary School | 126 | 80.8% |
| Middle School | 0 | 0.0% |
| High School | 0 | 0.0% |
| College / Undergraduate | 0 | 0.0% |
| Graduate / Professional | 0 | 0.0% |
| Total | 156 | 100.0% |
School Enrollment by Age by Funding Source in Onset
Out of a total of 156 students who are enrolled in schools in Onset, 30 (19.2%) attend a private institution, while the remaining 126 (80.8%) are enrolled in public schools. The age group of 3 to 4 year olds has the highest likelihood of being enrolled in private schools, with 30 (100.0% in the age bracket) enrolled. Conversely, the age group of 5 to 9 year old has the lowest likelihood of being enrolled in a private school, with 126 (100.0% in the age bracket) attending a public institution.
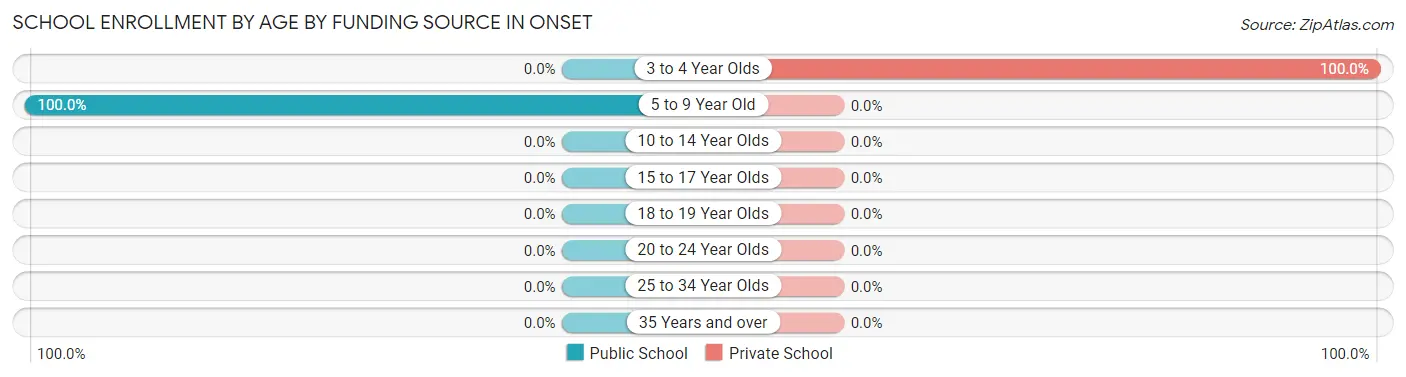
| Age Bracket | Public School | Private School |
| 3 to 4 Year Olds | 0 (0.0%) | 30 (100.0%) |
| 5 to 9 Year Old | 126 (100.0%) | 0 (0.0%) |
| 10 to 14 Year Olds | 0 (0.0%) | 0 (0.0%) |
| 15 to 17 Year Olds | 0 (0.0%) | 0 (0.0%) |
| 18 to 19 Year Olds | 0 (0.0%) | 0 (0.0%) |
| 20 to 24 Year Olds | 0 (0.0%) | 0 (0.0%) |
| 25 to 34 Year Olds | 0 (0.0%) | 0 (0.0%) |
| 35 Years and over | 0 (0.0%) | 0 (0.0%) |
| Total | 126 (80.8%) | 30 (19.2%) |
Educational Attainment by Field of Study in Onset
Engineering (83 | 28.2%), computers & mathematics (68 | 23.1%), liberal arts & history (41 | 14.0%), science & technology (40 | 13.6%), and business (31 | 10.5%) are the most common fields of study among 294 individuals in Onset who have obtained a bachelor's degree or higher.
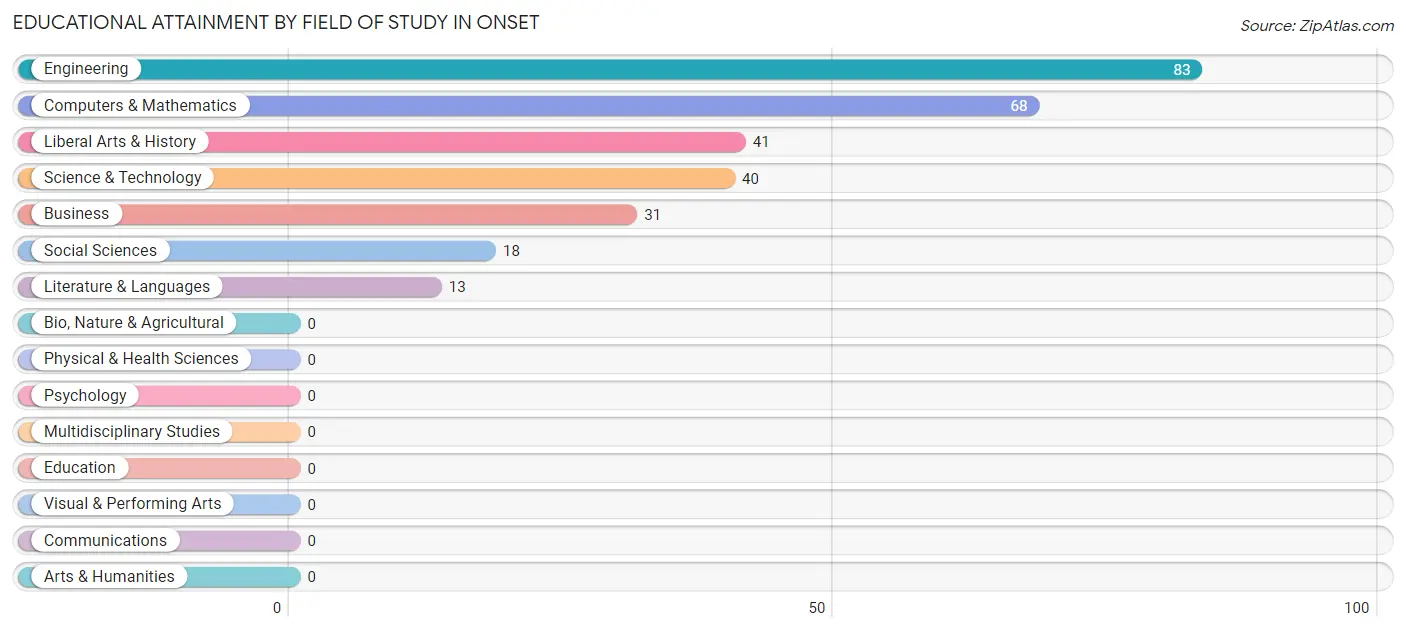
| Field of Study | # Graduates | % Graduates |
| Computers & Mathematics | 68 | 23.1% |
| Bio, Nature & Agricultural | 0 | 0.0% |
| Physical & Health Sciences | 0 | 0.0% |
| Psychology | 0 | 0.0% |
| Social Sciences | 18 | 6.1% |
| Engineering | 83 | 28.2% |
| Multidisciplinary Studies | 0 | 0.0% |
| Science & Technology | 40 | 13.6% |
| Business | 31 | 10.5% |
| Education | 0 | 0.0% |
| Literature & Languages | 13 | 4.4% |
| Liberal Arts & History | 41 | 14.0% |
| Visual & Performing Arts | 0 | 0.0% |
| Communications | 0 | 0.0% |
| Arts & Humanities | 0 | 0.0% |
| Total | 294 | 100.0% |
Transportation & Commute in Onset
Vehicle Availability by Sex in Onset
The most prevalent vehicle ownership categories in Onset are males with 2 vehicles (114, accounting for 71.3%) and females with 2 vehicles (251, making up 32.1%).
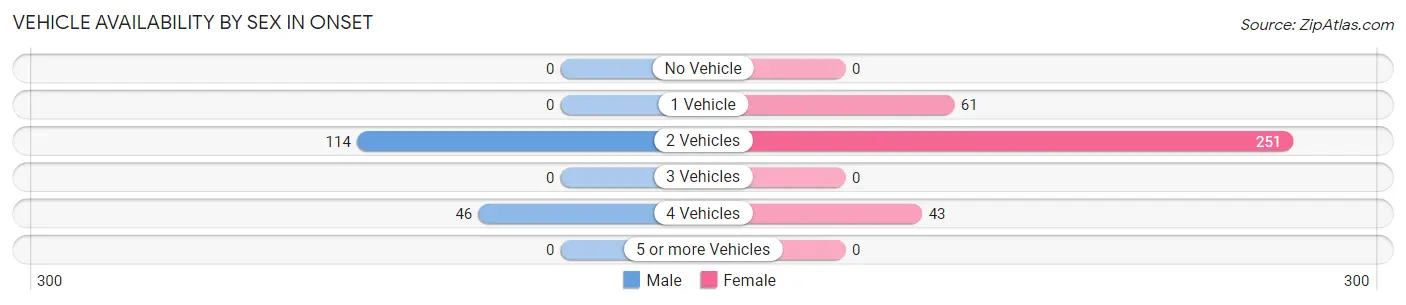
| Vehicles Available | Male | Female |
| No Vehicle | 0 (0.0%) | 0 (0.0%) |
| 1 Vehicle | 0 (0.0%) | 61 (17.2%) |
| 2 Vehicles | 114 (71.3%) | 251 (70.7%) |
| 3 Vehicles | 0 (0.0%) | 0 (0.0%) |
| 4 Vehicles | 46 (28.7%) | 43 (12.1%) |
| 5 or more Vehicles | 0 (0.0%) | 0 (0.0%) |
| Total | 160 (100.0%) | 355 (100.0%) |
Commute Time in Onset
The most frequently occuring commute durations in Onset are 5 to 9 minutes (175 commuters, 48.9%), 30 to 34 minutes (83 commuters, 23.2%), and 10 to 14 minutes (44 commuters, 12.3%).
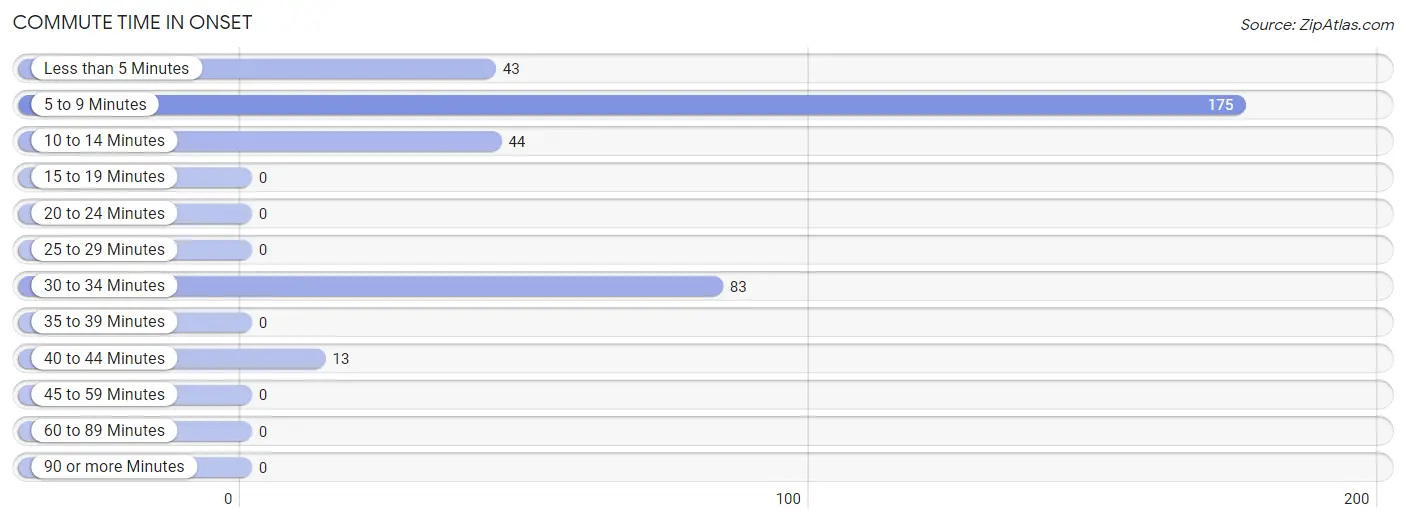
| Commute Time | # Commuters | % Commuters |
| Less than 5 Minutes | 43 | 12.0% |
| 5 to 9 Minutes | 175 | 48.9% |
| 10 to 14 Minutes | 44 | 12.3% |
| 15 to 19 Minutes | 0 | 0.0% |
| 20 to 24 Minutes | 0 | 0.0% |
| 25 to 29 Minutes | 0 | 0.0% |
| 30 to 34 Minutes | 83 | 23.2% |
| 35 to 39 Minutes | 0 | 0.0% |
| 40 to 44 Minutes | 13 | 3.6% |
| 45 to 59 Minutes | 0 | 0.0% |
| 60 to 89 Minutes | 0 | 0.0% |
| 90 or more Minutes | 0 | 0.0% |
Commute Time by Sex in Onset
The most common commute times in Onset are 5 to 9 minutes (70 commuters, 61.4%) for males and 5 to 9 minutes (105 commuters, 43.0%) for females.
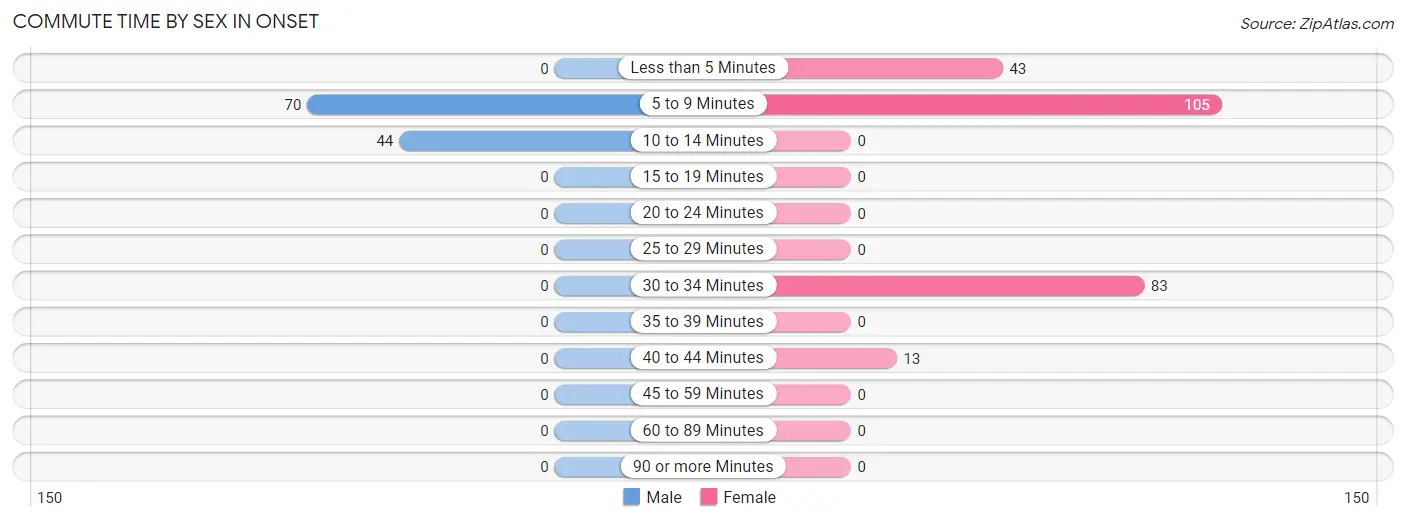
| Commute Time | Male | Female |
| Less than 5 Minutes | 0 (0.0%) | 43 (17.6%) |
| 5 to 9 Minutes | 70 (61.4%) | 105 (43.0%) |
| 10 to 14 Minutes | 44 (38.6%) | 0 (0.0%) |
| 15 to 19 Minutes | 0 (0.0%) | 0 (0.0%) |
| 20 to 24 Minutes | 0 (0.0%) | 0 (0.0%) |
| 25 to 29 Minutes | 0 (0.0%) | 0 (0.0%) |
| 30 to 34 Minutes | 0 (0.0%) | 83 (34.0%) |
| 35 to 39 Minutes | 0 (0.0%) | 0 (0.0%) |
| 40 to 44 Minutes | 0 (0.0%) | 13 (5.3%) |
| 45 to 59 Minutes | 0 (0.0%) | 0 (0.0%) |
| 60 to 89 Minutes | 0 (0.0%) | 0 (0.0%) |
| 90 or more Minutes | 0 (0.0%) | 0 (0.0%) |
Time of Departure to Work by Sex in Onset
The most frequent times of departure to work in Onset are 9:00 AM to 9:59 AM (70, 61.4%) for males and 8:00 AM to 8:29 AM (83, 34.0%) for females.
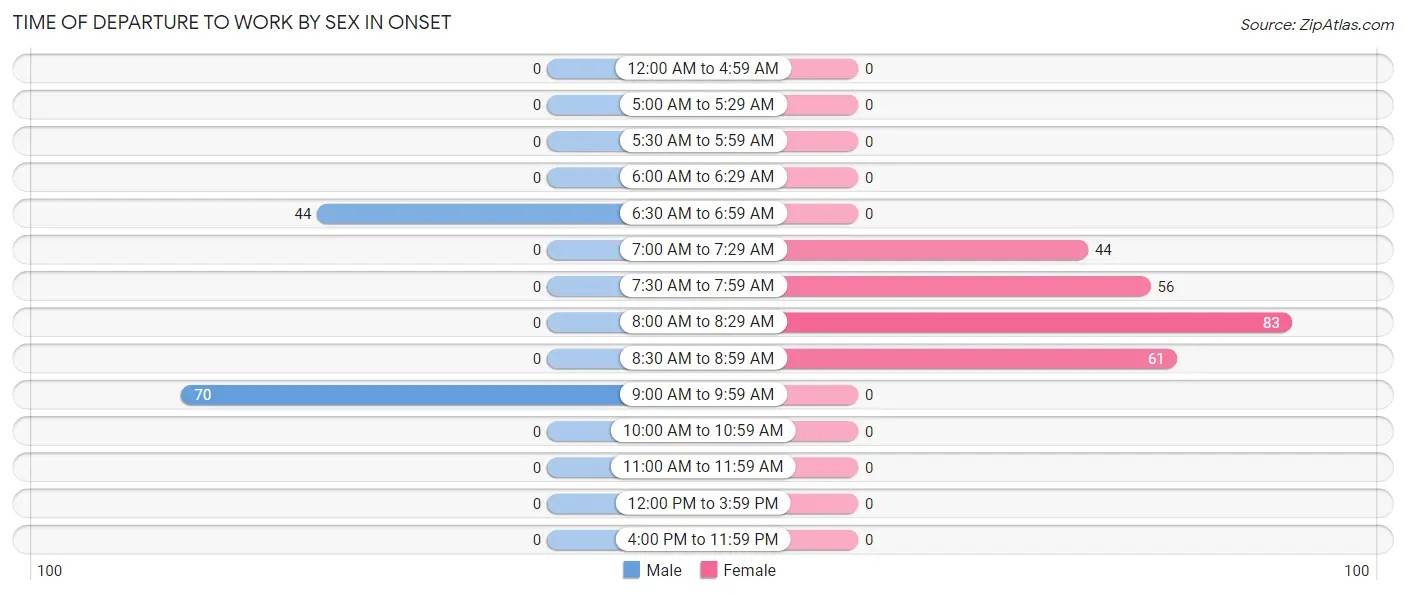
| Time of Departure | Male | Female |
| 12:00 AM to 4:59 AM | 0 (0.0%) | 0 (0.0%) |
| 5:00 AM to 5:29 AM | 0 (0.0%) | 0 (0.0%) |
| 5:30 AM to 5:59 AM | 0 (0.0%) | 0 (0.0%) |
| 6:00 AM to 6:29 AM | 0 (0.0%) | 0 (0.0%) |
| 6:30 AM to 6:59 AM | 44 (38.6%) | 0 (0.0%) |
| 7:00 AM to 7:29 AM | 0 (0.0%) | 44 (18.0%) |
| 7:30 AM to 7:59 AM | 0 (0.0%) | 56 (23.0%) |
| 8:00 AM to 8:29 AM | 0 (0.0%) | 83 (34.0%) |
| 8:30 AM to 8:59 AM | 0 (0.0%) | 61 (25.0%) |
| 9:00 AM to 9:59 AM | 70 (61.4%) | 0 (0.0%) |
| 10:00 AM to 10:59 AM | 0 (0.0%) | 0 (0.0%) |
| 11:00 AM to 11:59 AM | 0 (0.0%) | 0 (0.0%) |
| 12:00 PM to 3:59 PM | 0 (0.0%) | 0 (0.0%) |
| 4:00 PM to 11:59 PM | 0 (0.0%) | 0 (0.0%) |
| Total | 114 (100.0%) | 244 (100.0%) |
Housing Occupancy in Onset
Occupancy by Ownership in Onset
Of the total 679 dwellings in Onset, owner-occupied units account for 528 (77.8%), while renter-occupied units make up 151 (22.2%).
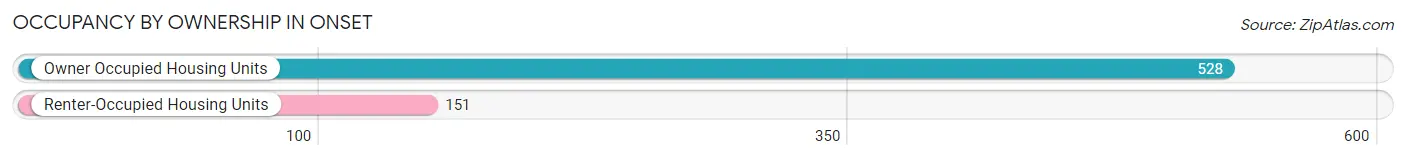
| Occupancy | # Housing Units | % Housing Units |
| Owner Occupied Housing Units | 528 | 77.8% |
| Renter-Occupied Housing Units | 151 | 22.2% |
| Total Occupied Housing Units | 679 | 100.0% |
Occupancy by Household Size in Onset
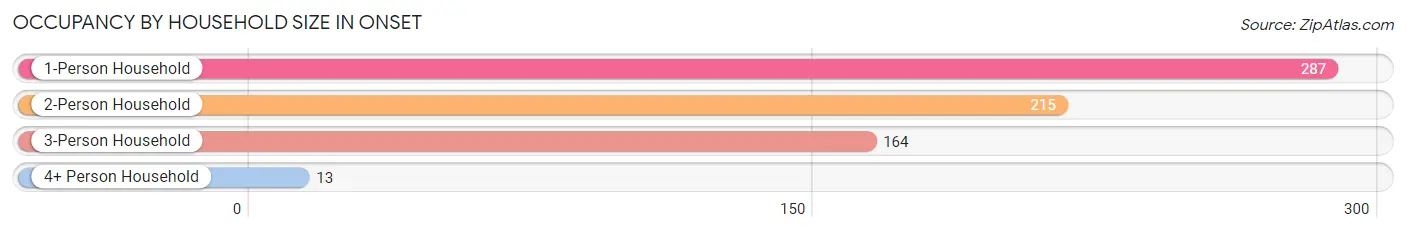
| Household Size | # Housing Units | % Housing Units |
| 1-Person Household | 287 | 42.3% |
| 2-Person Household | 215 | 31.7% |
| 3-Person Household | 164 | 24.1% |
| 4+ Person Household | 13 | 1.9% |
| Total Housing Units | 679 | 100.0% |
Occupancy by Ownership by Household Size in Onset
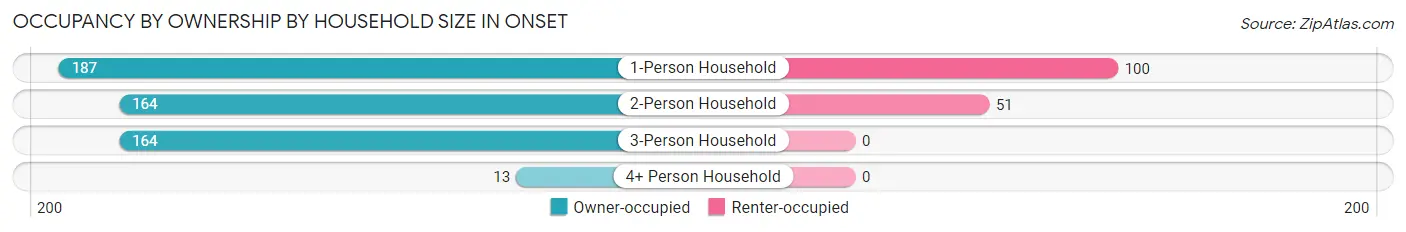
| Household Size | Owner-occupied | Renter-occupied |
| 1-Person Household | 187 (65.2%) | 100 (34.8%) |
| 2-Person Household | 164 (76.3%) | 51 (23.7%) |
| 3-Person Household | 164 (100.0%) | 0 (0.0%) |
| 4+ Person Household | 13 (100.0%) | 0 (0.0%) |
| Total Housing Units | 528 (77.8%) | 151 (22.2%) |
Occupancy by Educational Attainment in Onset
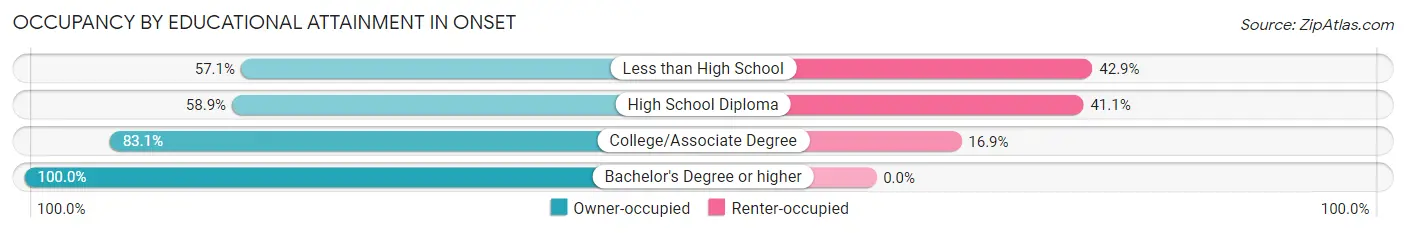
| Household Size | Owner-occupied | Renter-occupied |
| Less than High School | 44 (57.1%) | 33 (42.9%) |
| High School Diploma | 96 (58.9%) | 67 (41.1%) |
| College/Associate Degree | 251 (83.1%) | 51 (16.9%) |
| Bachelor's Degree or higher | 137 (100.0%) | 0 (0.0%) |
Occupancy by Age of Householder in Onset
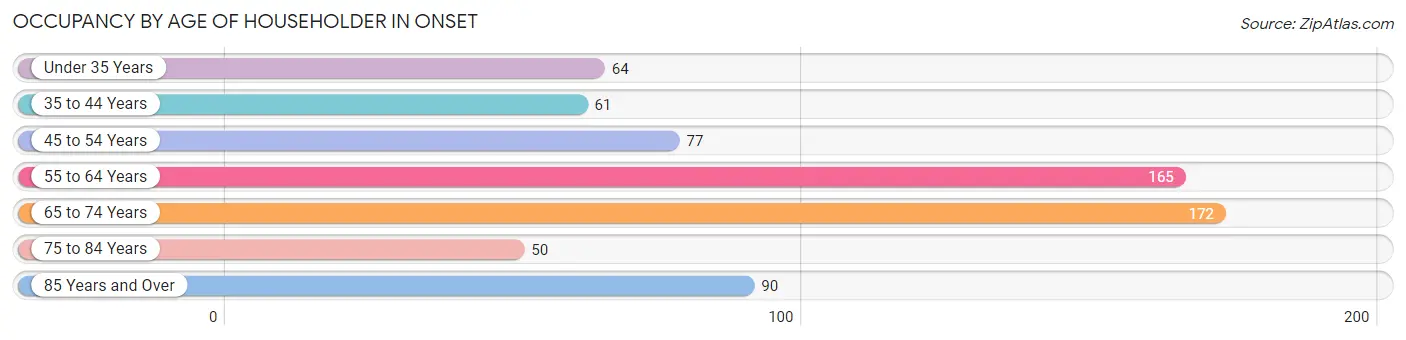
| Age Bracket | # Households | % Households |
| Under 35 Years | 64 | 9.4% |
| 35 to 44 Years | 61 | 9.0% |
| 45 to 54 Years | 77 | 11.3% |
| 55 to 64 Years | 165 | 24.3% |
| 65 to 74 Years | 172 | 25.3% |
| 75 to 84 Years | 50 | 7.4% |
| 85 Years and Over | 90 | 13.3% |
| Total | 679 | 100.0% |
Housing Finances in Onset
Median Income by Occupancy in Onset
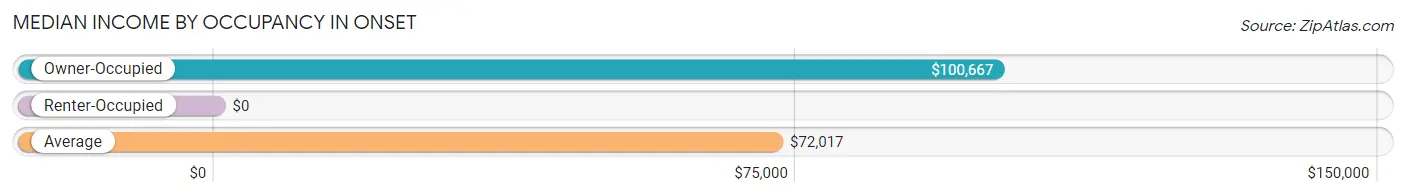
| Occupancy Type | # Households | Median Income |
| Owner-Occupied | 528 (77.8%) | $100,667 |
| Renter-Occupied | 151 (22.2%) | $0 |
| Average | 679 (100.0%) | $72,017 |
Occupancy by Householder Income Bracket in Onset
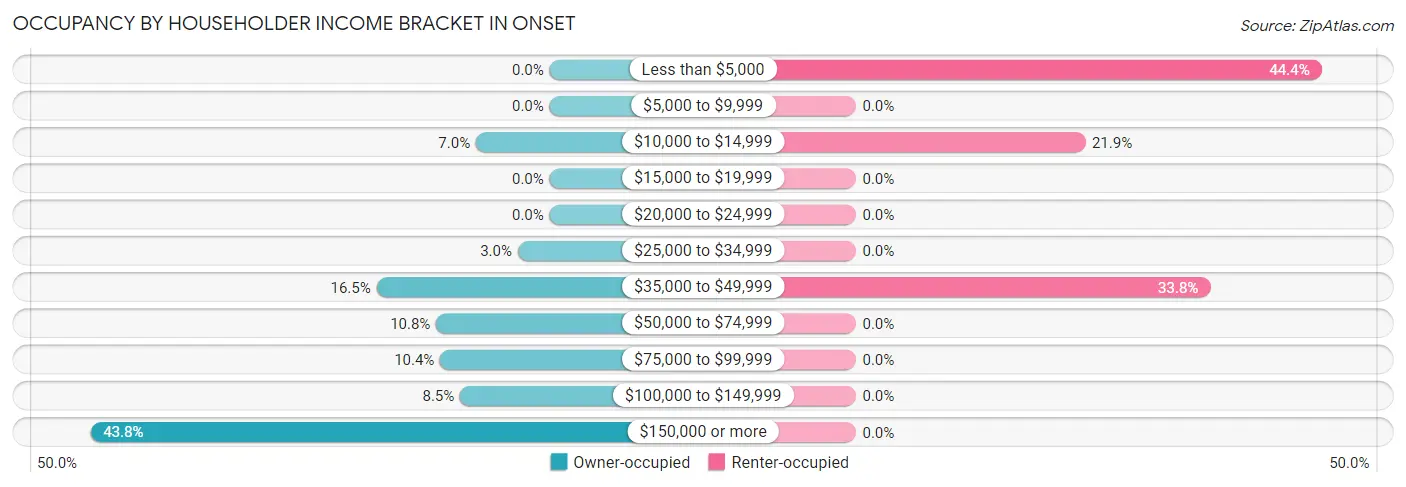
| Income Bracket | Owner-occupied | Renter-occupied |
| Less than $5,000 | 0 (0.0%) | 67 (44.4%) |
| $5,000 to $9,999 | 0 (0.0%) | 0 (0.0%) |
| $10,000 to $14,999 | 37 (7.0%) | 33 (21.8%) |
| $15,000 to $19,999 | 0 (0.0%) | 0 (0.0%) |
| $20,000 to $24,999 | 0 (0.0%) | 0 (0.0%) |
| $25,000 to $34,999 | 16 (3.0%) | 0 (0.0%) |
| $35,000 to $49,999 | 87 (16.5%) | 51 (33.8%) |
| $50,000 to $74,999 | 57 (10.8%) | 0 (0.0%) |
| $75,000 to $99,999 | 55 (10.4%) | 0 (0.0%) |
| $100,000 to $149,999 | 45 (8.5%) | 0 (0.0%) |
| $150,000 or more | 231 (43.8%) | 0 (0.0%) |
| Total | 528 (100.0%) | 151 (100.0%) |
Monthly Housing Cost Tiers in Onset
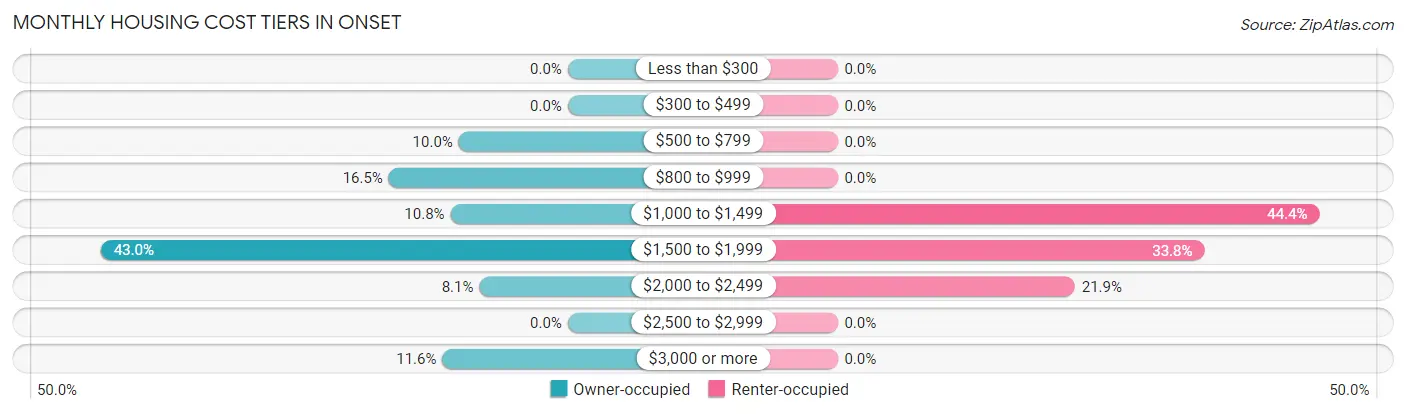
| Monthly Cost | Owner-occupied | Renter-occupied |
| Less than $300 | 0 (0.0%) | 0 (0.0%) |
| $300 to $499 | 0 (0.0%) | 0 (0.0%) |
| $500 to $799 | 53 (10.0%) | 0 (0.0%) |
| $800 to $999 | 87 (16.5%) | 0 (0.0%) |
| $1,000 to $1,499 | 57 (10.8%) | 67 (44.4%) |
| $1,500 to $1,999 | 227 (43.0%) | 51 (33.8%) |
| $2,000 to $2,499 | 43 (8.1%) | 33 (21.8%) |
| $2,500 to $2,999 | 0 (0.0%) | 0 (0.0%) |
| $3,000 or more | 61 (11.6%) | 0 (0.0%) |
| Total | 528 (100.0%) | 151 (100.0%) |
Physical Housing Characteristics in Onset
Housing Structures in Onset
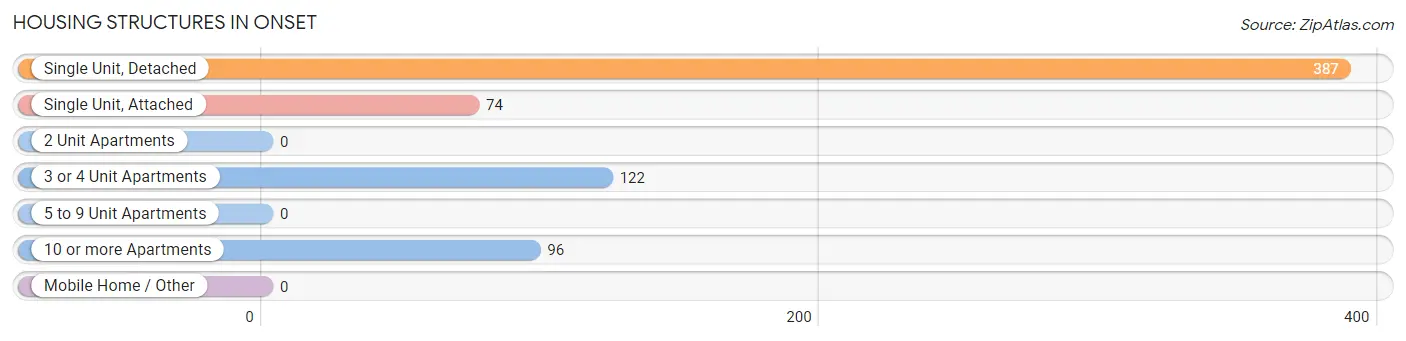
| Structure Type | # Housing Units | % Housing Units |
| Single Unit, Detached | 387 | 57.0% |
| Single Unit, Attached | 74 | 10.9% |
| 2 Unit Apartments | 0 | 0.0% |
| 3 or 4 Unit Apartments | 122 | 18.0% |
| 5 to 9 Unit Apartments | 0 | 0.0% |
| 10 or more Apartments | 96 | 14.1% |
| Mobile Home / Other | 0 | 0.0% |
| Total | 679 | 100.0% |
Housing Structures by Occupancy in Onset
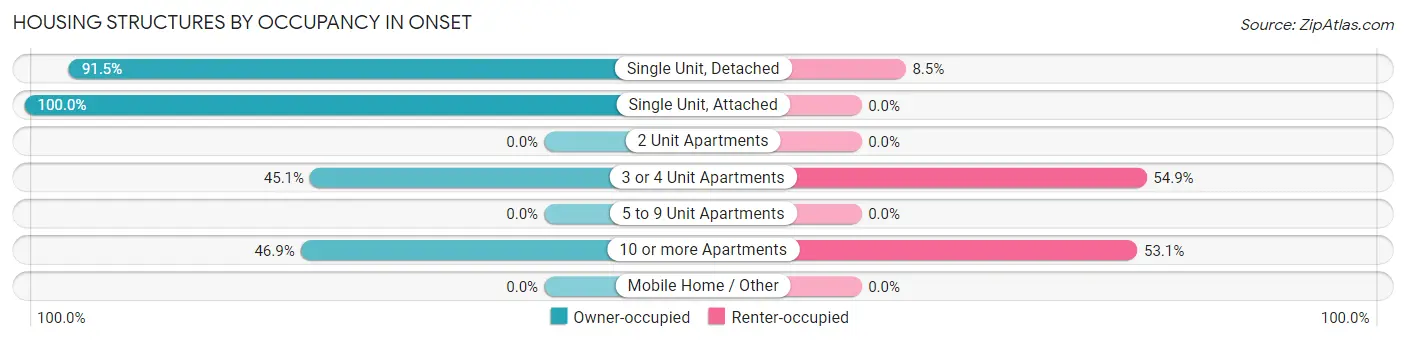
| Structure Type | Owner-occupied | Renter-occupied |
| Single Unit, Detached | 354 (91.5%) | 33 (8.5%) |
| Single Unit, Attached | 74 (100.0%) | 0 (0.0%) |
| 2 Unit Apartments | 0 (0.0%) | 0 (0.0%) |
| 3 or 4 Unit Apartments | 55 (45.1%) | 67 (54.9%) |
| 5 to 9 Unit Apartments | 0 (0.0%) | 0 (0.0%) |
| 10 or more Apartments | 45 (46.9%) | 51 (53.1%) |
| Mobile Home / Other | 0 (0.0%) | 0 (0.0%) |
| Total | 528 (77.8%) | 151 (22.2%) |
Housing Structures by Number of Rooms in Onset
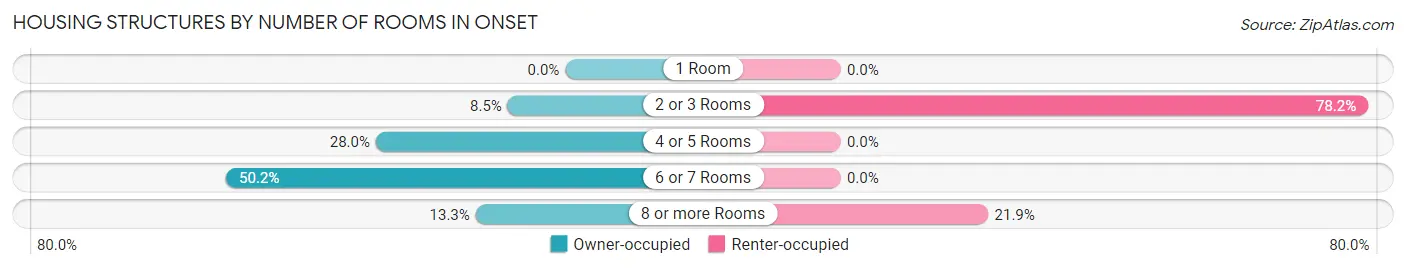
| Number of Rooms | Owner-occupied | Renter-occupied |
| 1 Room | 0 (0.0%) | 0 (0.0%) |
| 2 or 3 Rooms | 45 (8.5%) | 118 (78.1%) |
| 4 or 5 Rooms | 148 (28.0%) | 0 (0.0%) |
| 6 or 7 Rooms | 265 (50.2%) | 0 (0.0%) |
| 8 or more Rooms | 70 (13.3%) | 33 (21.8%) |
| Total | 528 (100.0%) | 151 (100.0%) |
Housing Structure by Heating Type in Onset
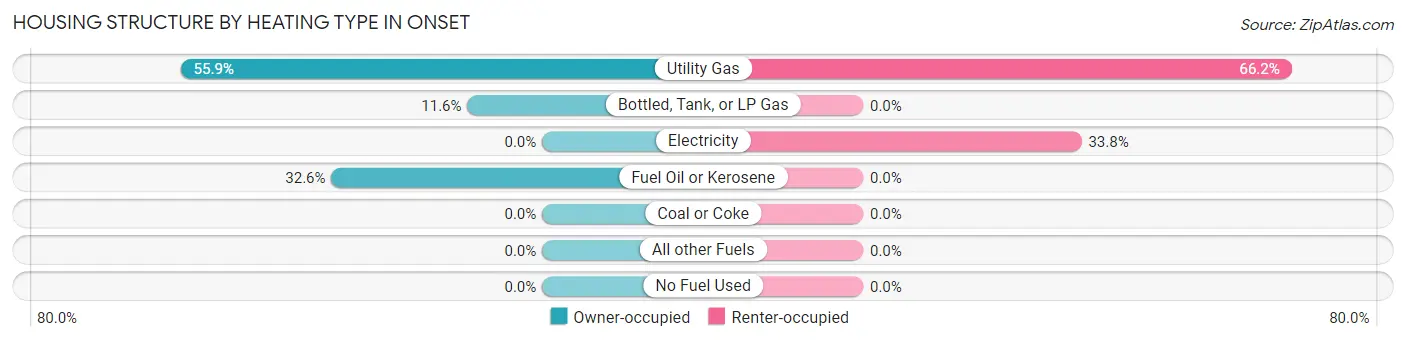
| Heating Type | Owner-occupied | Renter-occupied |
| Utility Gas | 295 (55.9%) | 100 (66.2%) |
| Bottled, Tank, or LP Gas | 61 (11.6%) | 0 (0.0%) |
| Electricity | 0 (0.0%) | 51 (33.8%) |
| Fuel Oil or Kerosene | 172 (32.6%) | 0 (0.0%) |
| Coal or Coke | 0 (0.0%) | 0 (0.0%) |
| All other Fuels | 0 (0.0%) | 0 (0.0%) |
| No Fuel Used | 0 (0.0%) | 0 (0.0%) |
| Total | 528 (100.0%) | 151 (100.0%) |
Household Vehicle Usage in Onset
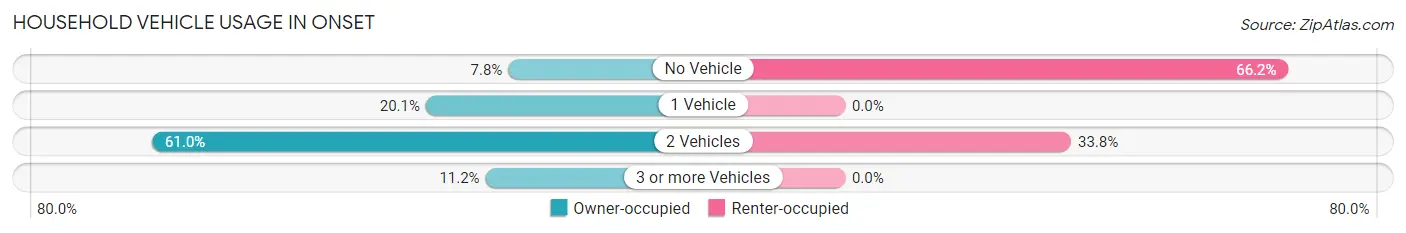
| Vehicles per Household | Owner-occupied | Renter-occupied |
| No Vehicle | 41 (7.8%) | 100 (66.2%) |
| 1 Vehicle | 106 (20.1%) | 0 (0.0%) |
| 2 Vehicles | 322 (61.0%) | 51 (33.8%) |
| 3 or more Vehicles | 59 (11.2%) | 0 (0.0%) |
| Total | 528 (100.0%) | 151 (100.0%) |
Real Estate & Mortgages in Onset
Real Estate and Mortgage Overview in Onset
| Characteristic | Without Mortgage | With Mortgage |
| Housing Units | 153 | 375 |
| Median Property Value | $427,000 | $340,000 |
| Median Household Income | $41,433 | $231 |
| Monthly Housing Costs | $927 | $61 |
| Real Estate Taxes | $2,546 | $0 |
Property Value by Mortgage Status in Onset
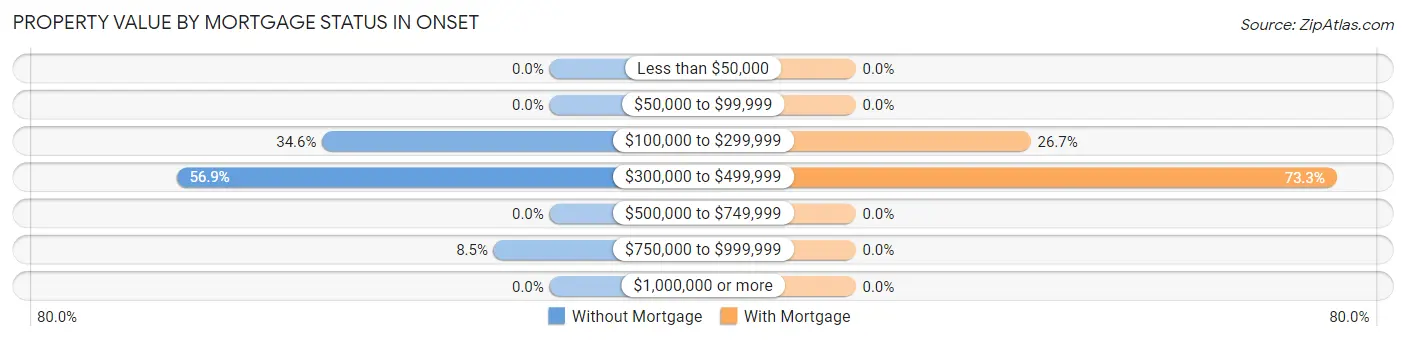
| Property Value | Without Mortgage | With Mortgage |
| Less than $50,000 | 0 (0.0%) | 0 (0.0%) |
| $50,000 to $99,999 | 0 (0.0%) | 0 (0.0%) |
| $100,000 to $299,999 | 53 (34.6%) | 100 (26.7%) |
| $300,000 to $499,999 | 87 (56.9%) | 275 (73.3%) |
| $500,000 to $749,999 | 0 (0.0%) | 0 (0.0%) |
| $750,000 to $999,999 | 13 (8.5%) | 0 (0.0%) |
| $1,000,000 or more | 0 (0.0%) | 0 (0.0%) |
| Total | 153 (100.0%) | 375 (100.0%) |
Household Income by Mortgage Status in Onset
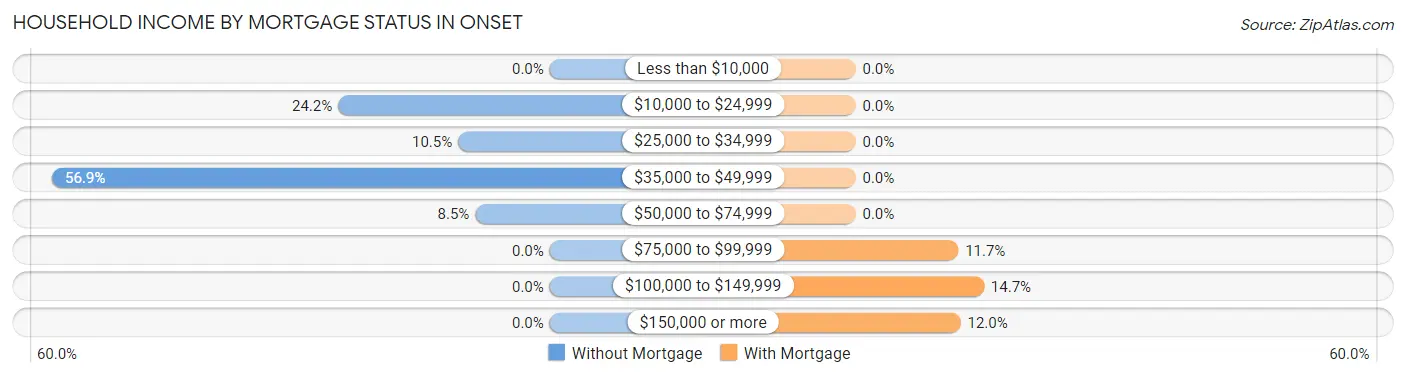
| Household Income | Without Mortgage | With Mortgage |
| Less than $10,000 | 0 (0.0%) | 0 (0.0%) |
| $10,000 to $24,999 | 37 (24.2%) | 0 (0.0%) |
| $25,000 to $34,999 | 16 (10.5%) | 0 (0.0%) |
| $35,000 to $49,999 | 87 (56.9%) | 0 (0.0%) |
| $50,000 to $74,999 | 13 (8.5%) | 0 (0.0%) |
| $75,000 to $99,999 | 0 (0.0%) | 44 (11.7%) |
| $100,000 to $149,999 | 0 (0.0%) | 55 (14.7%) |
| $150,000 or more | 0 (0.0%) | 45 (12.0%) |
| Total | 153 (100.0%) | 375 (100.0%) |
Property Value to Household Income Ratio in Onset
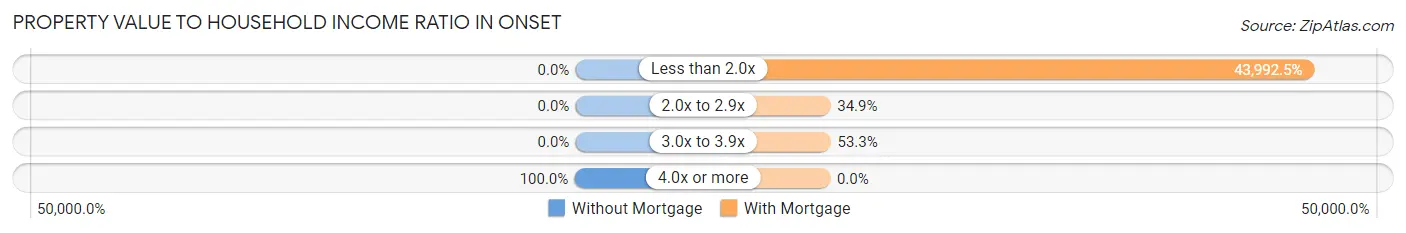
| Value-to-Income Ratio | Without Mortgage | With Mortgage |
| Less than 2.0x | 0 (0.0%) | 164,972 (43,992.5%) |
| 2.0x to 2.9x | 0 (0.0%) | 131 (34.9%) |
| 3.0x to 3.9x | 0 (0.0%) | 200 (53.3%) |
| 4.0x or more | 153 (100.0%) | 0 (0.0%) |
| Total | 153 (100.0%) | 375 (100.0%) |
Real Estate Taxes by Mortgage Status in Onset
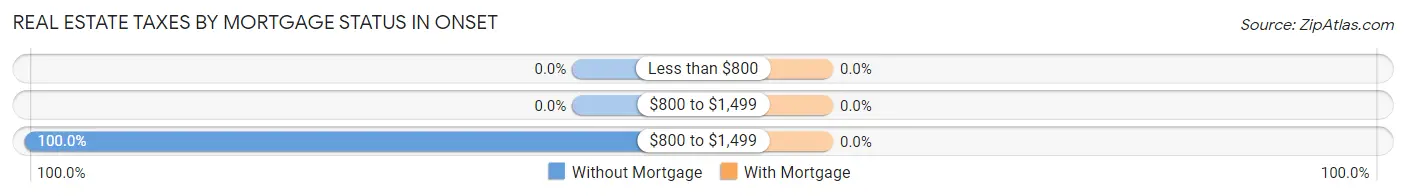
| Property Taxes | Without Mortgage | With Mortgage |
| Less than $800 | 0 (0.0%) | 0 (0.0%) |
| $800 to $1,499 | 0 (0.0%) | 0 (0.0%) |
| $800 to $1,499 | 153 (100.0%) | 0 (0.0%) |
| Total | 153 (100.0%) | 375 (100.0%) |
Health & Disability in Onset
Health Insurance Coverage by Age in Onset
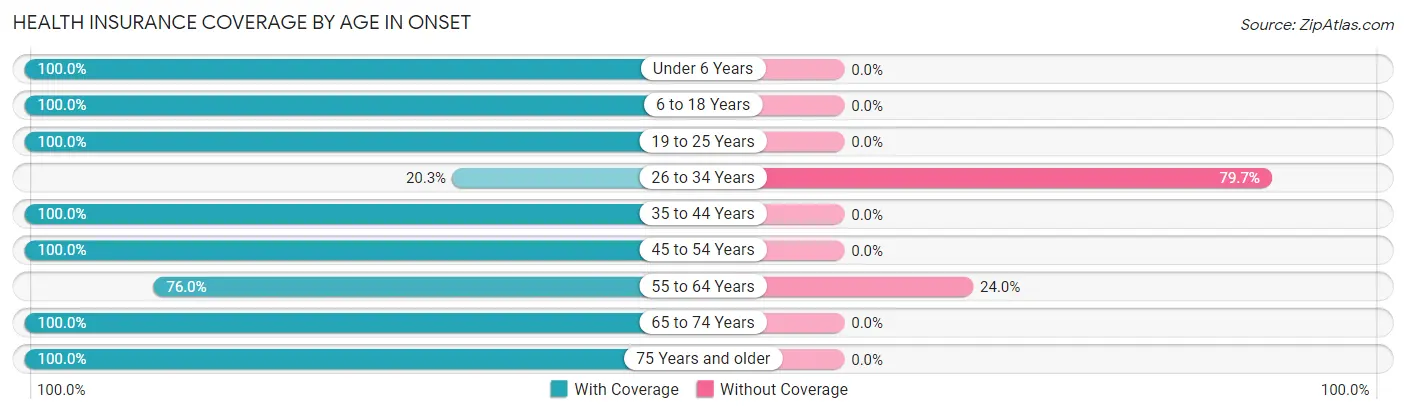
| Age Bracket | With Coverage | Without Coverage |
| Under 6 Years | 30 (100.0%) | 0 (0.0%) |
| 6 to 18 Years | 126 (100.0%) | 0 (0.0%) |
| 19 to 25 Years | 83 (100.0%) | 0 (0.0%) |
| 26 to 34 Years | 13 (20.3%) | 51 (79.7%) |
| 35 to 44 Years | 124 (100.0%) | 0 (0.0%) |
| 45 to 54 Years | 291 (100.0%) | 0 (0.0%) |
| 55 to 64 Years | 174 (76.0%) | 55 (24.0%) |
| 65 to 74 Years | 186 (100.0%) | 0 (0.0%) |
| 75 Years and older | 193 (100.0%) | 0 (0.0%) |
| Total | 1,220 (92.0%) | 106 (8.0%) |
Health Insurance Coverage by Citizenship Status in Onset
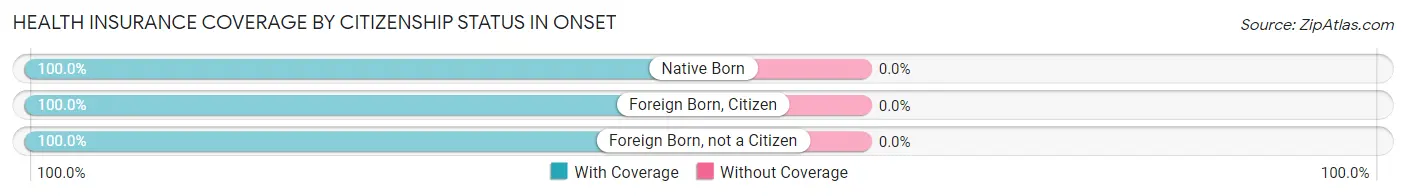
| Citizenship Status | With Coverage | Without Coverage |
| Native Born | 30 (100.0%) | 0 (0.0%) |
| Foreign Born, Citizen | 126 (100.0%) | 0 (0.0%) |
| Foreign Born, not a Citizen | 83 (100.0%) | 0 (0.0%) |
Health Insurance Coverage by Household Income in Onset
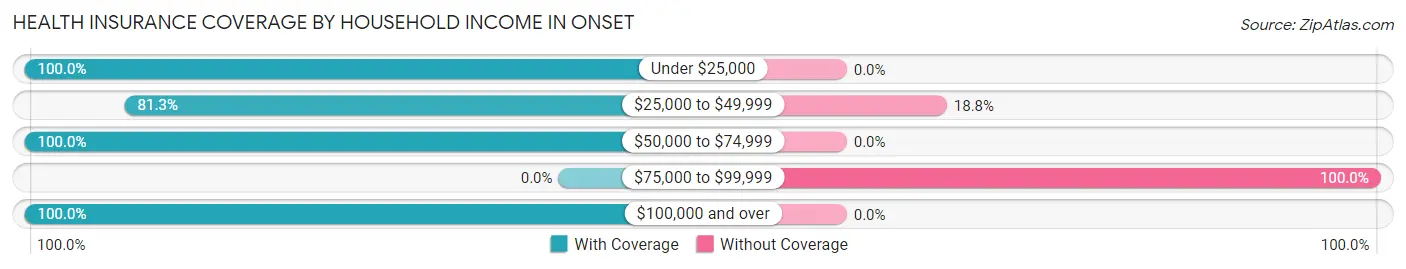
| Household Income | With Coverage | Without Coverage |
| Under $25,000 | 180 (100.0%) | 0 (0.0%) |
| $25,000 to $49,999 | 221 (81.2%) | 51 (18.8%) |
| $50,000 to $74,999 | 154 (100.0%) | 0 (0.0%) |
| $75,000 to $99,999 | 0 (0.0%) | 55 (100.0%) |
| $100,000 and over | 650 (100.0%) | 0 (0.0%) |
Public vs Private Health Insurance Coverage by Age in Onset
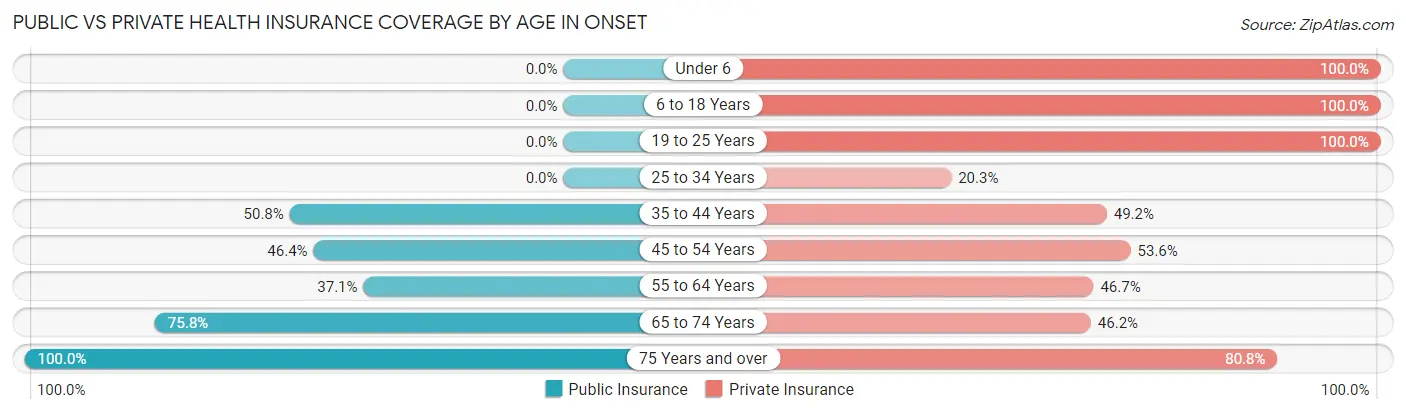
| Age Bracket | Public Insurance | Private Insurance |
| Under 6 | 0 (0.0%) | 30 (100.0%) |
| 6 to 18 Years | 0 (0.0%) | 126 (100.0%) |
| 19 to 25 Years | 0 (0.0%) | 83 (100.0%) |
| 25 to 34 Years | 0 (0.0%) | 13 (20.3%) |
| 35 to 44 Years | 63 (50.8%) | 61 (49.2%) |
| 45 to 54 Years | 135 (46.4%) | 156 (53.6%) |
| 55 to 64 Years | 85 (37.1%) | 107 (46.7%) |
| 65 to 74 Years | 141 (75.8%) | 86 (46.2%) |
| 75 Years and over | 193 (100.0%) | 156 (80.8%) |
| Total | 617 (46.5%) | 818 (61.7%) |
Disability Status by Sex by Age in Onset
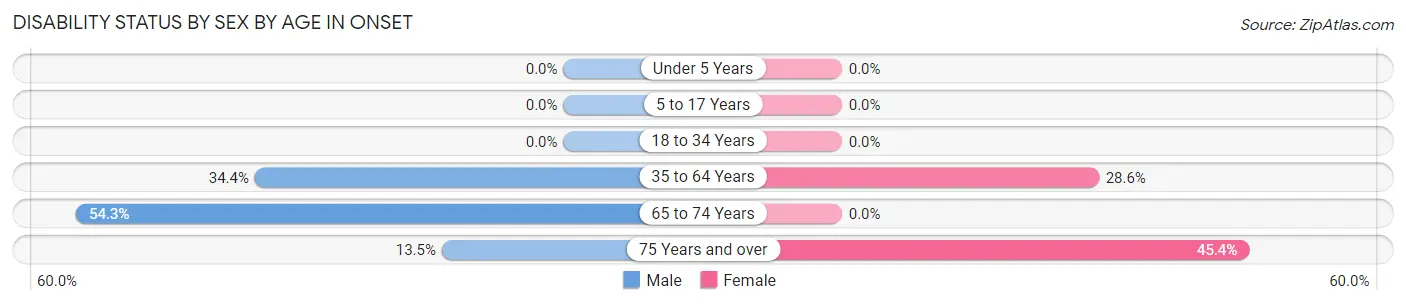
| Age Bracket | Male | Female |
| Under 5 Years | 0 (0.0%) | 0 (0.0%) |
| 5 to 17 Years | 0 (0.0%) | 0 (0.0%) |
| 18 to 34 Years | 0 (0.0%) | 0 (0.0%) |
| 35 to 64 Years | 100 (34.4%) | 101 (28.6%) |
| 65 to 74 Years | 70 (54.3%) | 0 (0.0%) |
| 75 Years and over | 13 (13.5%) | 44 (45.4%) |
Disability Class by Sex by Age in Onset
Disability Class: Hearing Difficulty
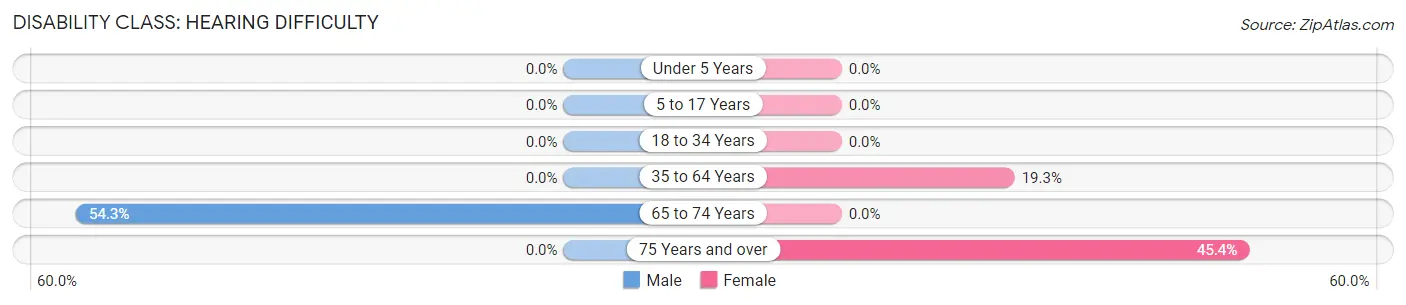
| Age Bracket | Male | Female |
| Under 5 Years | 0 (0.0%) | 0 (0.0%) |
| 5 to 17 Years | 0 (0.0%) | 0 (0.0%) |
| 18 to 34 Years | 0 (0.0%) | 0 (0.0%) |
| 35 to 64 Years | 0 (0.0%) | 68 (19.3%) |
| 65 to 74 Years | 70 (54.3%) | 0 (0.0%) |
| 75 Years and over | 0 (0.0%) | 44 (45.4%) |
Disability Class: Vision Difficulty
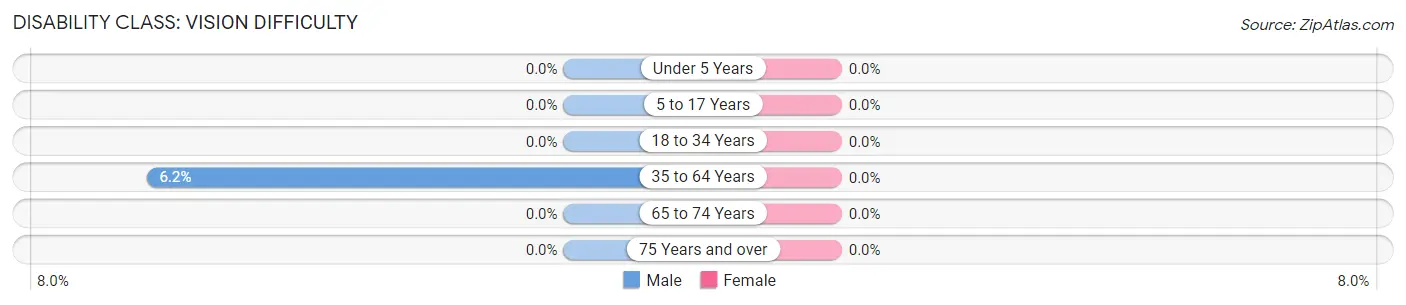
| Age Bracket | Male | Female |
| Under 5 Years | 0 (0.0%) | 0 (0.0%) |
| 5 to 17 Years | 0 (0.0%) | 0 (0.0%) |
| 18 to 34 Years | 0 (0.0%) | 0 (0.0%) |
| 35 to 64 Years | 18 (6.2%) | 0 (0.0%) |
| 65 to 74 Years | 0 (0.0%) | 0 (0.0%) |
| 75 Years and over | 0 (0.0%) | 0 (0.0%) |
Disability Class: Cognitive Difficulty
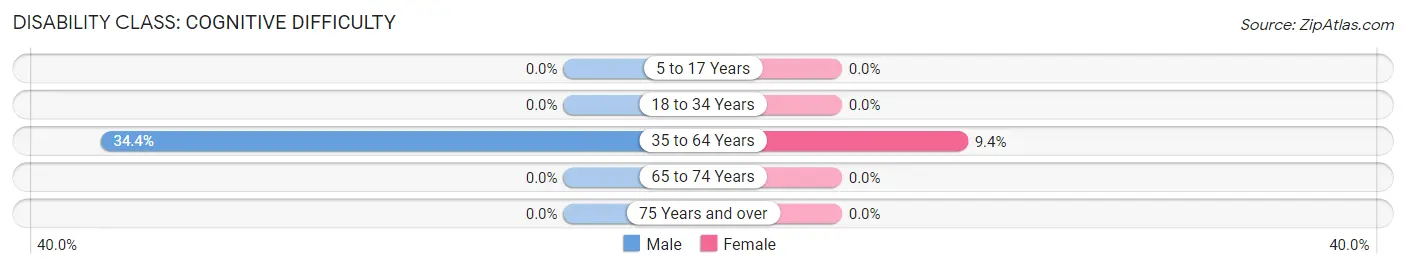
| Age Bracket | Male | Female |
| 5 to 17 Years | 0 (0.0%) | 0 (0.0%) |
| 18 to 34 Years | 0 (0.0%) | 0 (0.0%) |
| 35 to 64 Years | 100 (34.4%) | 33 (9.3%) |
| 65 to 74 Years | 0 (0.0%) | 0 (0.0%) |
| 75 Years and over | 0 (0.0%) | 0 (0.0%) |
Disability Class: Ambulatory Difficulty
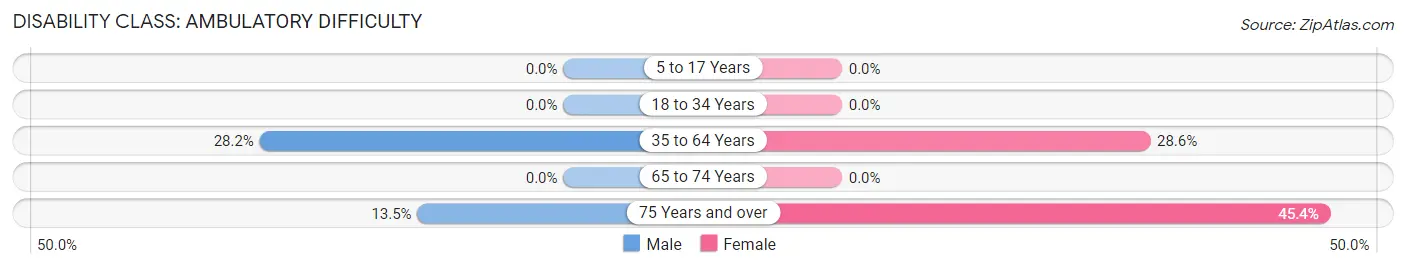
| Age Bracket | Male | Female |
| 5 to 17 Years | 0 (0.0%) | 0 (0.0%) |
| 18 to 34 Years | 0 (0.0%) | 0 (0.0%) |
| 35 to 64 Years | 82 (28.2%) | 101 (28.6%) |
| 65 to 74 Years | 0 (0.0%) | 0 (0.0%) |
| 75 Years and over | 13 (13.5%) | 44 (45.4%) |
Disability Class: Self-Care Difficulty
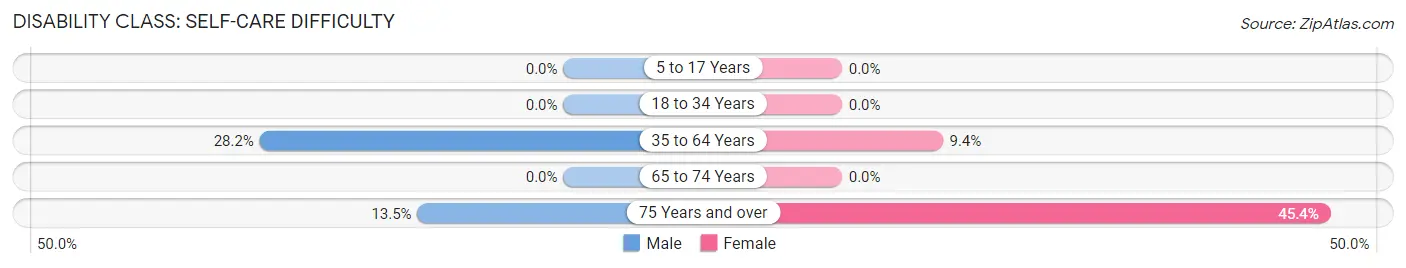
| Age Bracket | Male | Female |
| 5 to 17 Years | 0 (0.0%) | 0 (0.0%) |
| 18 to 34 Years | 0 (0.0%) | 0 (0.0%) |
| 35 to 64 Years | 82 (28.2%) | 33 (9.3%) |
| 65 to 74 Years | 0 (0.0%) | 0 (0.0%) |
| 75 Years and over | 13 (13.5%) | 44 (45.4%) |
Technology Access in Onset
Computing Device Access in Onset
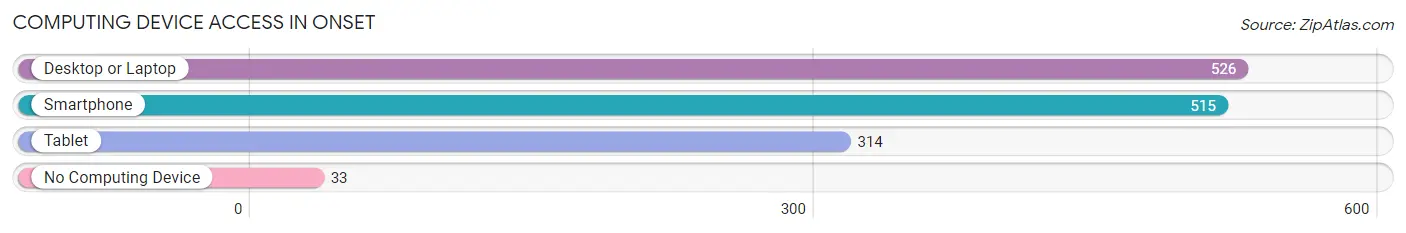
| Device Type | # Households | % Households |
| Desktop or Laptop | 526 | 77.5% |
| Smartphone | 515 | 75.8% |
| Tablet | 314 | 46.2% |
| No Computing Device | 33 | 4.9% |
| Total | 679 | 100.0% |
Internet Access in Onset
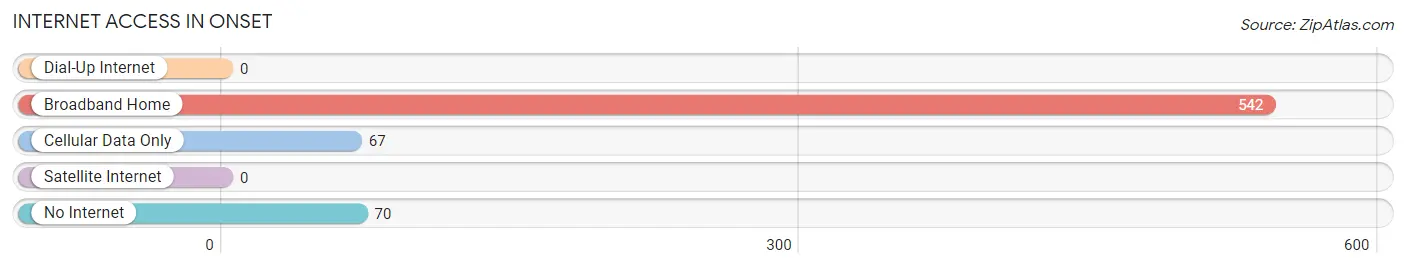
| Internet Type | # Households | % Households |
| Dial-Up Internet | 0 | 0.0% |
| Broadband Home | 542 | 79.8% |
| Cellular Data Only | 67 | 9.9% |
| Satellite Internet | 0 | 0.0% |
| No Internet | 70 | 10.3% |
| Total | 679 | 100.0% |
Onset Summary
Onset is a small village located in the town of Wareham, Massachusetts. It is situated on the western shore of Buzzards Bay, approximately 50 miles south of Boston. The village is known for its beautiful beaches, quaint shops, and vibrant summer activities.
History
Onset was first settled in 1652 by a group of English settlers from Plymouth Colony. The area was originally known as Agawam, and was part of the town of Sandwich. In 1869, the village was officially incorporated as Onset. The name is derived from the Wampanoag word “onset”, which means “at the edge of the water”.
The village was a popular summer destination for wealthy Bostonians in the late 19th century. The Onset Bay Association was formed in 1883 to promote the area as a summer resort. The association built a pier, a pavilion, and a hotel. The pier was destroyed by a hurricane in 1938, but the pavilion and hotel remain today.
Geography
Onset is located on the western shore of Buzzards Bay, approximately 50 miles south of Boston. The village is bordered by the towns of Wareham, Marion, and Rochester. Onset is situated on a peninsula, with Onset Bay to the north and the Wareham River to the south. The village is home to several beaches, including Onset Beach, Shell Point Beach, and Onset Island Beach.
Economy
Onset’s economy is largely based on tourism. The village is a popular summer destination, with many visitors coming to enjoy the beaches, shops, and restaurants. The Onset Bay Association operates a number of businesses in the village, including a marina, a golf course, and a hotel.
The village is also home to several small businesses, including a grocery store, a hardware store, and a pharmacy. In addition, there are several restaurants, bars, and cafes in the village.
Demographics
As of the 2010 census, Onset had a population of 2,822. The population is predominantly white (94.3%), with small percentages of African American (2.2%), Asian (1.2%), and Hispanic (1.2%) residents. The median household income is $50,945, and the median home value is $310,000.
Onset is a small village with a rich history and a vibrant economy. It is a popular summer destination, with many visitors coming to enjoy the beaches, shops, and restaurants. The village is home to a diverse population, with a median household income of $50,945 and a median home value of $310,000.
Common Questions
What is Per Capita Income in Onset?
Per Capita income in Onset is $51,462.
What is the Median Family Income in Onset?
Median Family Income in Onset is $163,864.
What is the Median Household income in Onset?
Median Household Income in Onset is $72,017.
What is Inequality or Gini Index in Onset?
Inequality or Gini Index in Onset is 0.45.
What is the Total Population of Onset?
Total Population of Onset is 1,326.
What is the Total Male Population of Onset?
Total Male Population of Onset is 647.
What is the Total Female Population of Onset?
Total Female Population of Onset is 679.
What is the Ratio of Males per 100 Females in Onset?
There are 95.29 Males per 100 Females in Onset.
What is the Ratio of Females per 100 Males in Onset?
There are 104.95 Females per 100 Males in Onset.
What is the Median Population Age in Onset?
Median Population Age in Onset is 53.7 Years.
What is the Average Family Size in Onset
Average Family Size in Onset is 2.5 People.
What is the Average Household Size in Onset
Average Household Size in Onset is 1.9 People.
How Large is the Labor Force in Onset?
There are 746 People in the Labor Forcein in Onset.
What is the Percentage of People in the Labor Force in Onset?
63.8% of People are in the Labor Force in Onset.
What is the Unemployment Rate in Onset?
Unemployment Rate in Onset is 28.6%.