Zip Codes with the Highest Percentage of Population Employed in Legal Services & Support in Lawrence, MA
RELATED REPORTS & OPTIONS
Legal Services & Support
Lawrence
Compare Zip Codes
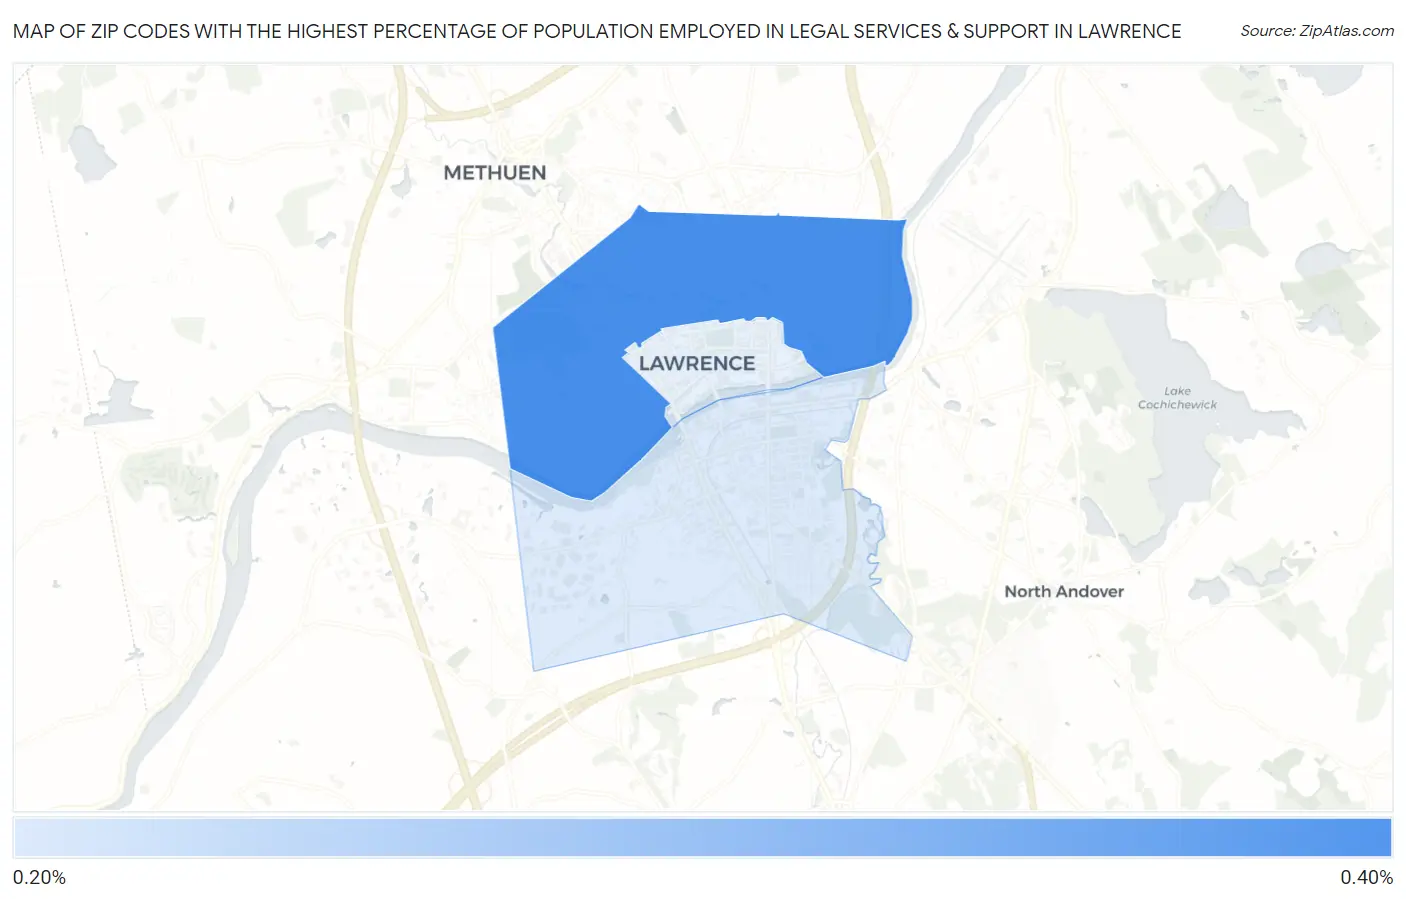
Map of Zip Codes with the Highest Percentage of Population Employed in Legal Services & Support in Lawrence
0.23%
0.35%
Zip Codes with the Highest Percentage of Population Employed in Legal Services & Support in Lawrence, MA
| Zip Code | % Employed | vs State | vs National | |
| 1. | 01841 | 0.35% | 1.5%(-1.13)#395 | 1.2%(-0.830)#14,405 |
| 2. | 01843 | 0.23% | 1.5%(-1.26)#410 | 1.2%(-0.959)#15,934 |
1
Common Questions
What are the Top Zip Codes with the Highest Percentage of Population Employed in Legal Services & Support in Lawrence, MA?
Top Zip Codes with the Highest Percentage of Population Employed in Legal Services & Support in Lawrence, MA are:
What zip code has the Highest Percentage of Population Employed in Legal Services & Support in Lawrence, MA?
01841 has the Highest Percentage of Population Employed in Legal Services & Support in Lawrence, MA with 0.35%.
What is the Percentage of Population Employed in Legal Services & Support in Lawrence, MA?
Percentage of Population Employed in Legal Services & Support in Lawrence is 0.28%.
What is the Percentage of Population Employed in Legal Services & Support in Massachusetts?
Percentage of Population Employed in Legal Services & Support in Massachusetts is 1.5%.
What is the Percentage of Population Employed in Legal Services & Support in the United States?
Percentage of Population Employed in Legal Services & Support in the United States is 1.2%.