Zip Codes with the Highest Percentage of Population Employed in Agriculture, Fishing & Hunting in Gillette, WY
RELATED REPORTS & OPTIONS
Agriculture, Fishing & Hunting
Gillette
Compare Zip Codes
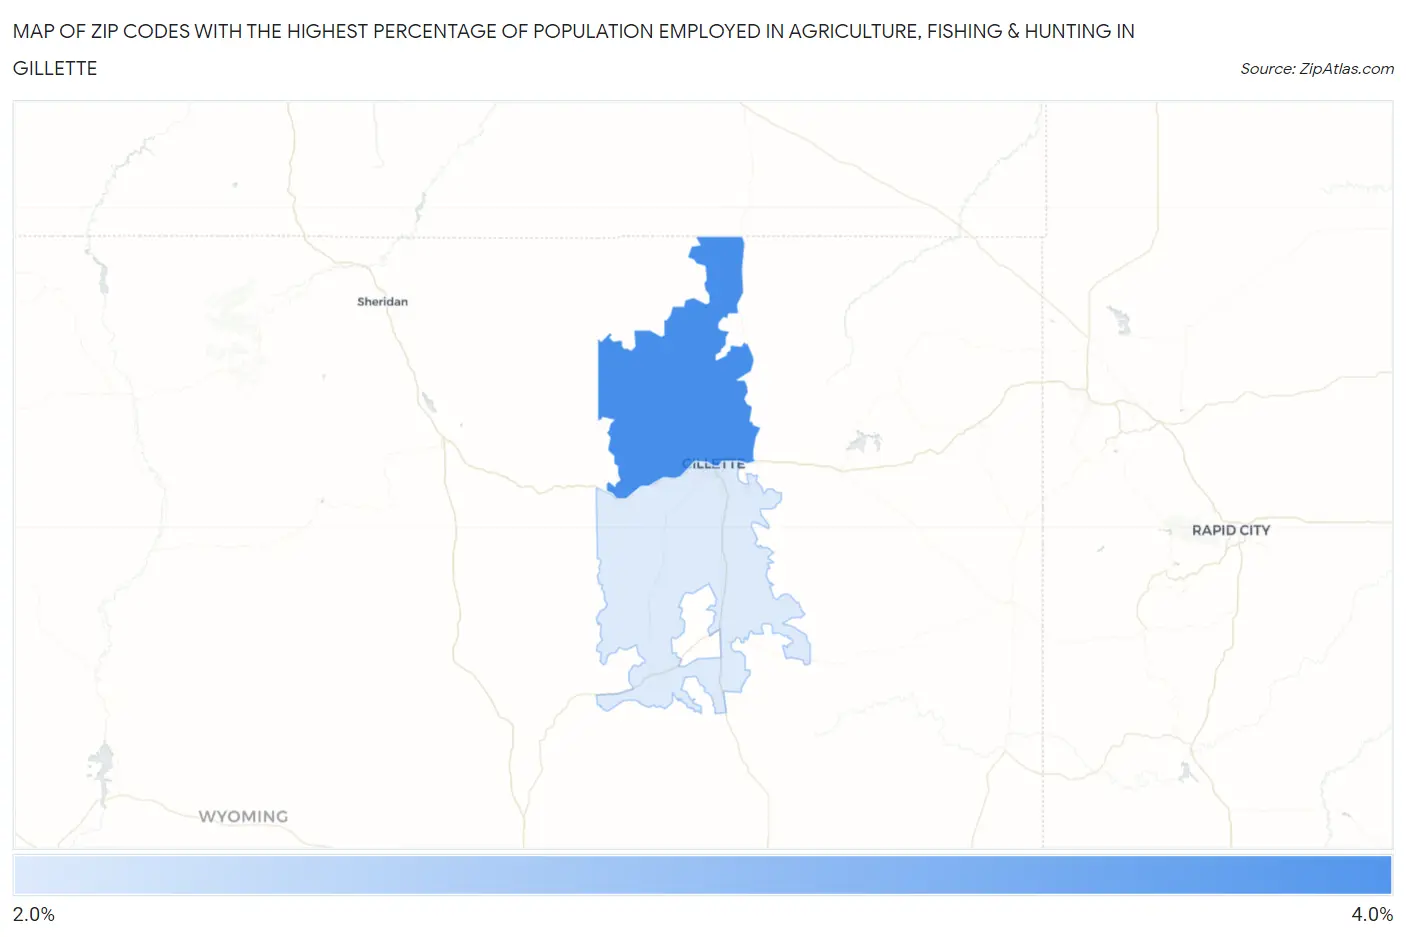
Map of Zip Codes with the Highest Percentage of Population Employed in Agriculture, Fishing & Hunting in Gillette
2.0%
3.3%
Zip Codes with the Highest Percentage of Population Employed in Agriculture, Fishing & Hunting in Gillette, WY
| Zip Code | % Employed | vs State | vs National | |
| 1. | 82716 | 3.3% | 3.4%(-0.076)#96 | 1.2%(+2.13)#10,005 |
| 2. | 82718 | 2.0% | 3.4%(-1.37)#107 | 1.2%(+0.843)#12,665 |
1
Common Questions
What are the Top Zip Codes with the Highest Percentage of Population Employed in Agriculture, Fishing & Hunting in Gillette, WY?
Top Zip Codes with the Highest Percentage of Population Employed in Agriculture, Fishing & Hunting in Gillette, WY are:
What zip code has the Highest Percentage of Population Employed in Agriculture, Fishing & Hunting in Gillette, WY?
82716 has the Highest Percentage of Population Employed in Agriculture, Fishing & Hunting in Gillette, WY with 3.3%.
What is the Percentage of Population Employed in Agriculture, Fishing & Hunting in Gillette, WY?
Percentage of Population Employed in Agriculture, Fishing & Hunting in Gillette is 0.26%.
What is the Percentage of Population Employed in Agriculture, Fishing & Hunting in Wyoming?
Percentage of Population Employed in Agriculture, Fishing & Hunting in Wyoming is 3.4%.
What is the Percentage of Population Employed in Agriculture, Fishing & Hunting in the United States?
Percentage of Population Employed in Agriculture, Fishing & Hunting in the United States is 1.2%.