Zip Codes with the Highest Percentage of Households Without a Vehicle in Gillette, WY
RELATED REPORTS & OPTIONS
Households without a Cars
Gillette
Compare Zip Codes
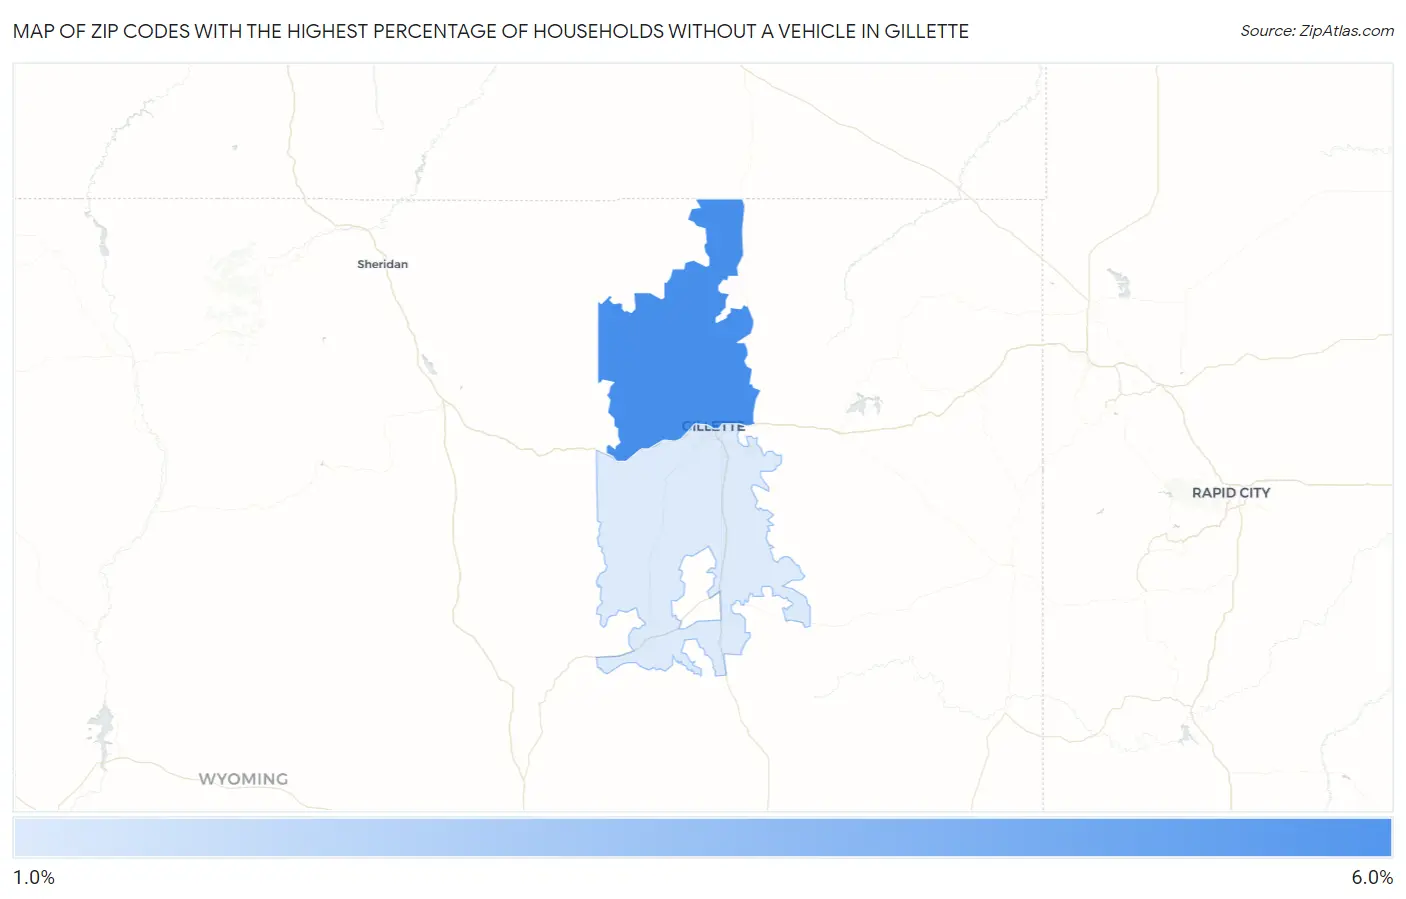
Map of Zip Codes with the Highest Percentage of Households Without a Vehicle in Gillette
1.7%
5.2%
Zip Codes with the Highest Percentage of Households Without a Vehicle in Gillette, WY
| Zip Code | Housholds Without a Car | vs State | vs National | |
| 1. | 82716 | 5.2% | 3.8%(+1.40)#21 | 8.3%(-3.10)#12,379 |
| 2. | 82718 | 1.7% | 3.8%(-2.10)#62 | 8.3%(-6.60)#23,454 |
1
Common Questions
What are the Top Zip Codes with the Highest Percentage of Households Without a Vehicle in Gillette, WY?
Top Zip Codes with the Highest Percentage of Households Without a Vehicle in Gillette, WY are:
What zip code has the Highest Percentage of Households Without a Vehicle in Gillette, WY?
82716 has the Highest Percentage of Households Without a Vehicle in Gillette, WY with 5.2%.
What is the Percentage of Households Without a Vehicle in Gillette, WY?
Percentage of Households Without a Vehicle in Gillette is 3.7%.
What is the Percentage of Households Without a Vehicle in Wyoming?
Percentage of Households Without a Vehicle in Wyoming is 3.8%.
What is the Percentage of Households Without a Vehicle in the United States?
Percentage of Households Without a Vehicle in the United States is 8.3%.