Zip Codes with the Highest Percentage of Population Employed in Farming, Fishing & Forestry in Gillette, WY
RELATED REPORTS & OPTIONS
Farming, Fishing & Forestry
Gillette
Compare Zip Codes
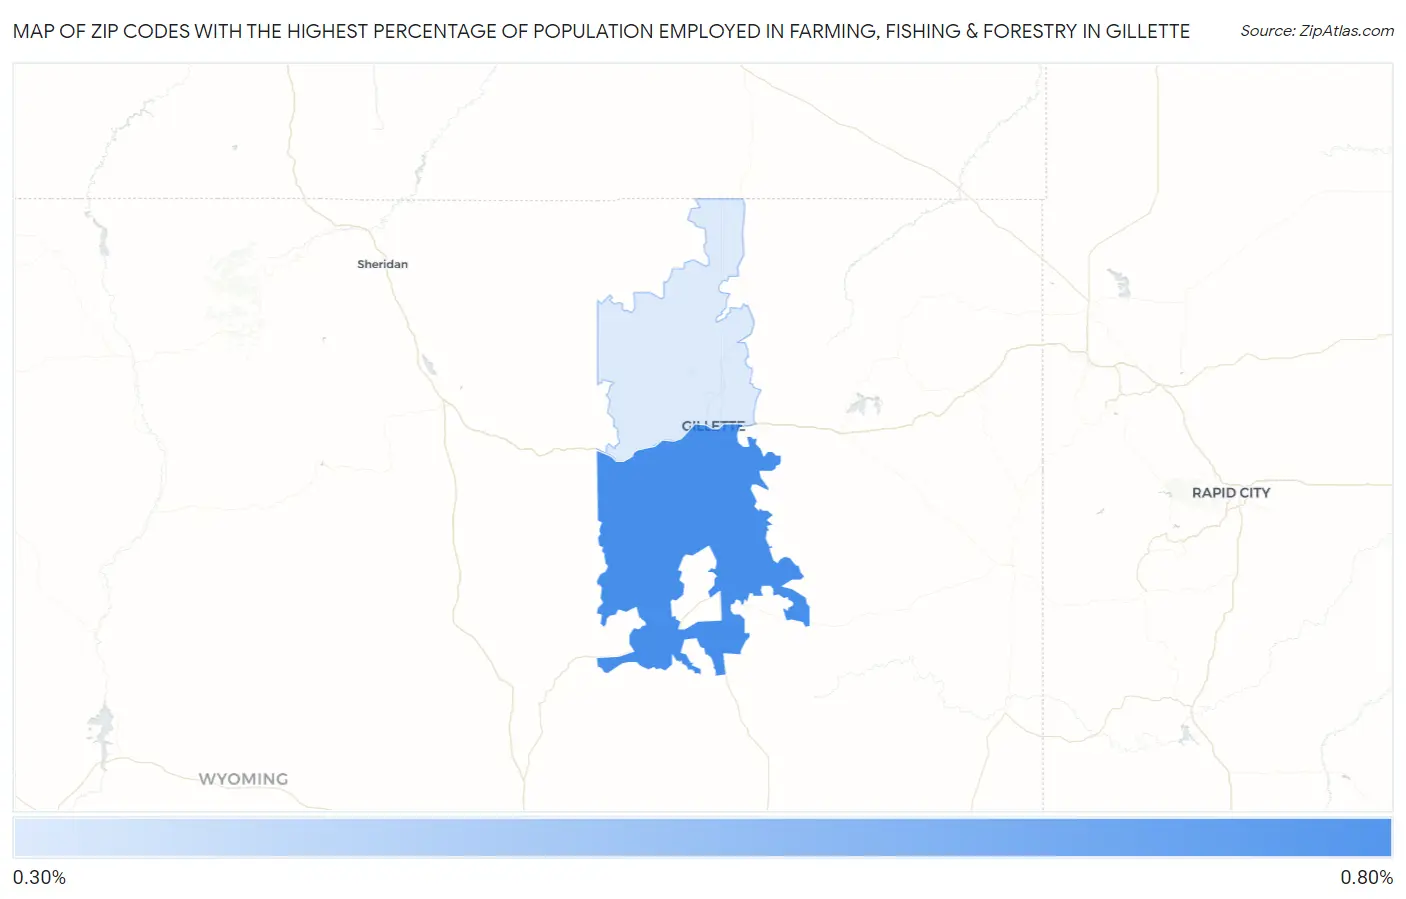
Map of Zip Codes with the Highest Percentage of Population Employed in Farming, Fishing & Forestry in Gillette
0.33%
0.64%
Zip Codes with the Highest Percentage of Population Employed in Farming, Fishing & Forestry in Gillette, WY
| Zip Code | % Employed | vs State | vs National | |
| 1. | 82718 | 0.64% | 1.2%(-0.514)#80 | 0.61%(+0.033)#11,771 |
| 2. | 82716 | 0.33% | 1.2%(-0.824)#88 | 0.61%(-0.278)#14,503 |
1
Common Questions
What are the Top Zip Codes with the Highest Percentage of Population Employed in Farming, Fishing & Forestry in Gillette, WY?
Top Zip Codes with the Highest Percentage of Population Employed in Farming, Fishing & Forestry in Gillette, WY are:
What zip code has the Highest Percentage of Population Employed in Farming, Fishing & Forestry in Gillette, WY?
82718 has the Highest Percentage of Population Employed in Farming, Fishing & Forestry in Gillette, WY with 0.64%.
What is the Percentage of Population Employed in Farming, Fishing & Forestry in Gillette, WY?
Percentage of Population Employed in Farming, Fishing & Forestry in Gillette is 0.19%.
What is the Percentage of Population Employed in Farming, Fishing & Forestry in Wyoming?
Percentage of Population Employed in Farming, Fishing & Forestry in Wyoming is 1.2%.
What is the Percentage of Population Employed in Farming, Fishing & Forestry in the United States?
Percentage of Population Employed in Farming, Fishing & Forestry in the United States is 0.61%.