Zip Codes with the Highest Percentage of Population Employed in Legal Services & Support in Gillette, WY
RELATED REPORTS & OPTIONS
Legal Services & Support
Gillette
Compare Zip Codes
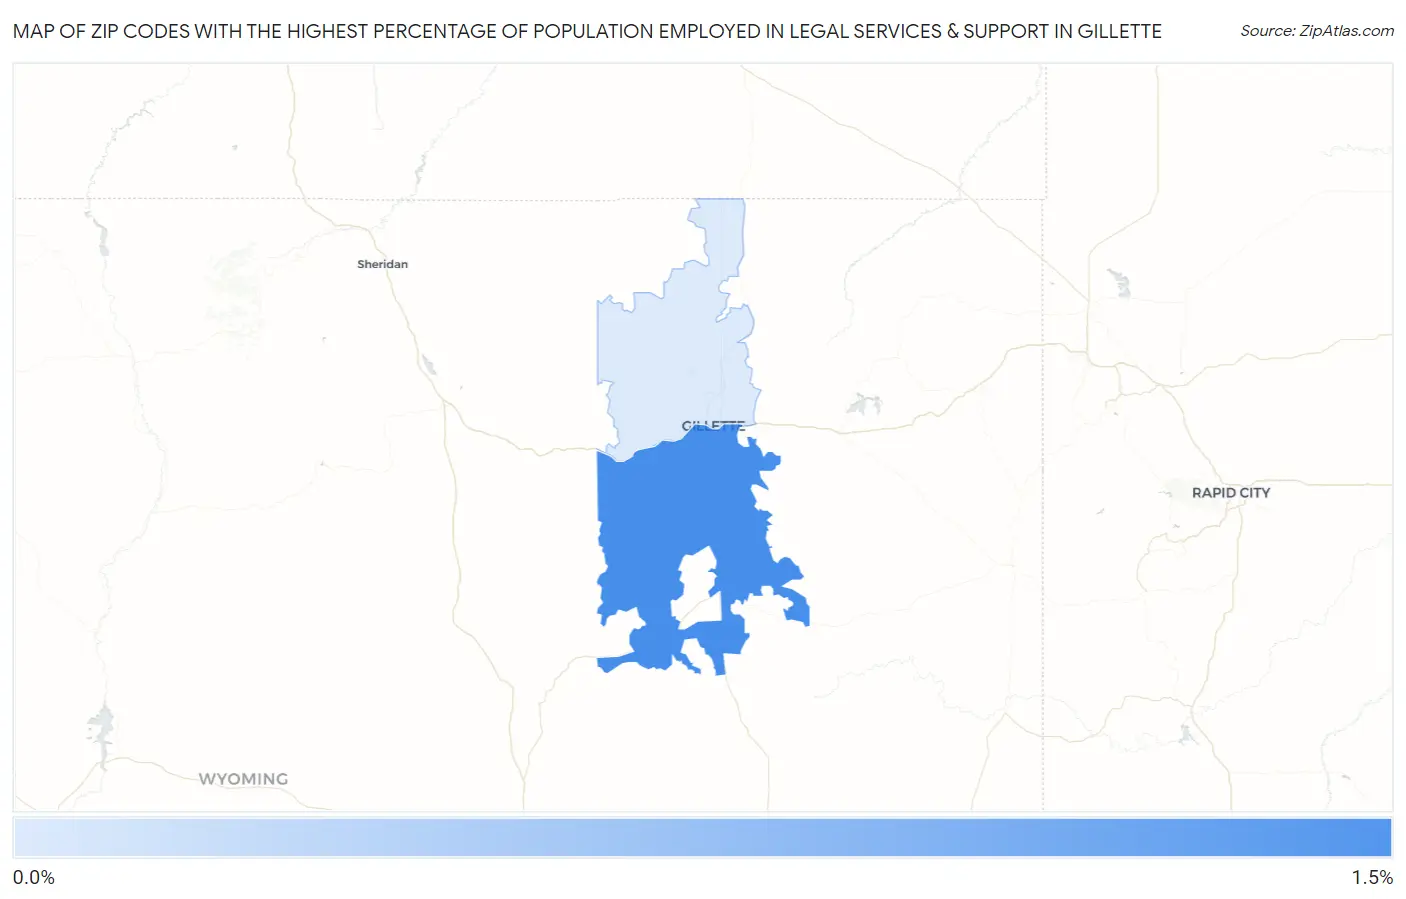
Map of Zip Codes with the Highest Percentage of Population Employed in Legal Services & Support in Gillette
0.011%
1.1%
Zip Codes with the Highest Percentage of Population Employed in Legal Services & Support in Gillette, WY
| Zip Code | % Employed | vs State | vs National | |
| 1. | 82718 | 1.1% | 0.82%(+0.288)#21 | 1.2%(-0.080)#7,143 |
| 2. | 82716 | 0.011% | 0.82%(-0.805)#44 | 1.2%(-1.17)#17,507 |
1
Common Questions
What are the Top Zip Codes with the Highest Percentage of Population Employed in Legal Services & Support in Gillette, WY?
Top Zip Codes with the Highest Percentage of Population Employed in Legal Services & Support in Gillette, WY are:
What zip code has the Highest Percentage of Population Employed in Legal Services & Support in Gillette, WY?
82718 has the Highest Percentage of Population Employed in Legal Services & Support in Gillette, WY with 1.1%.
What is the Percentage of Population Employed in Legal Services & Support in Gillette, WY?
Percentage of Population Employed in Legal Services & Support in Gillette is 0.74%.
What is the Percentage of Population Employed in Legal Services & Support in Wyoming?
Percentage of Population Employed in Legal Services & Support in Wyoming is 0.82%.
What is the Percentage of Population Employed in Legal Services & Support in the United States?
Percentage of Population Employed in Legal Services & Support in the United States is 1.2%.