Zip Codes with the Highest Percentage of Population with a Degree in Visual and Performing Arts in Silverdale, WA
RELATED REPORTS & OPTIONS
Visual and Performing Arts
Silverdale
Compare Zip Codes
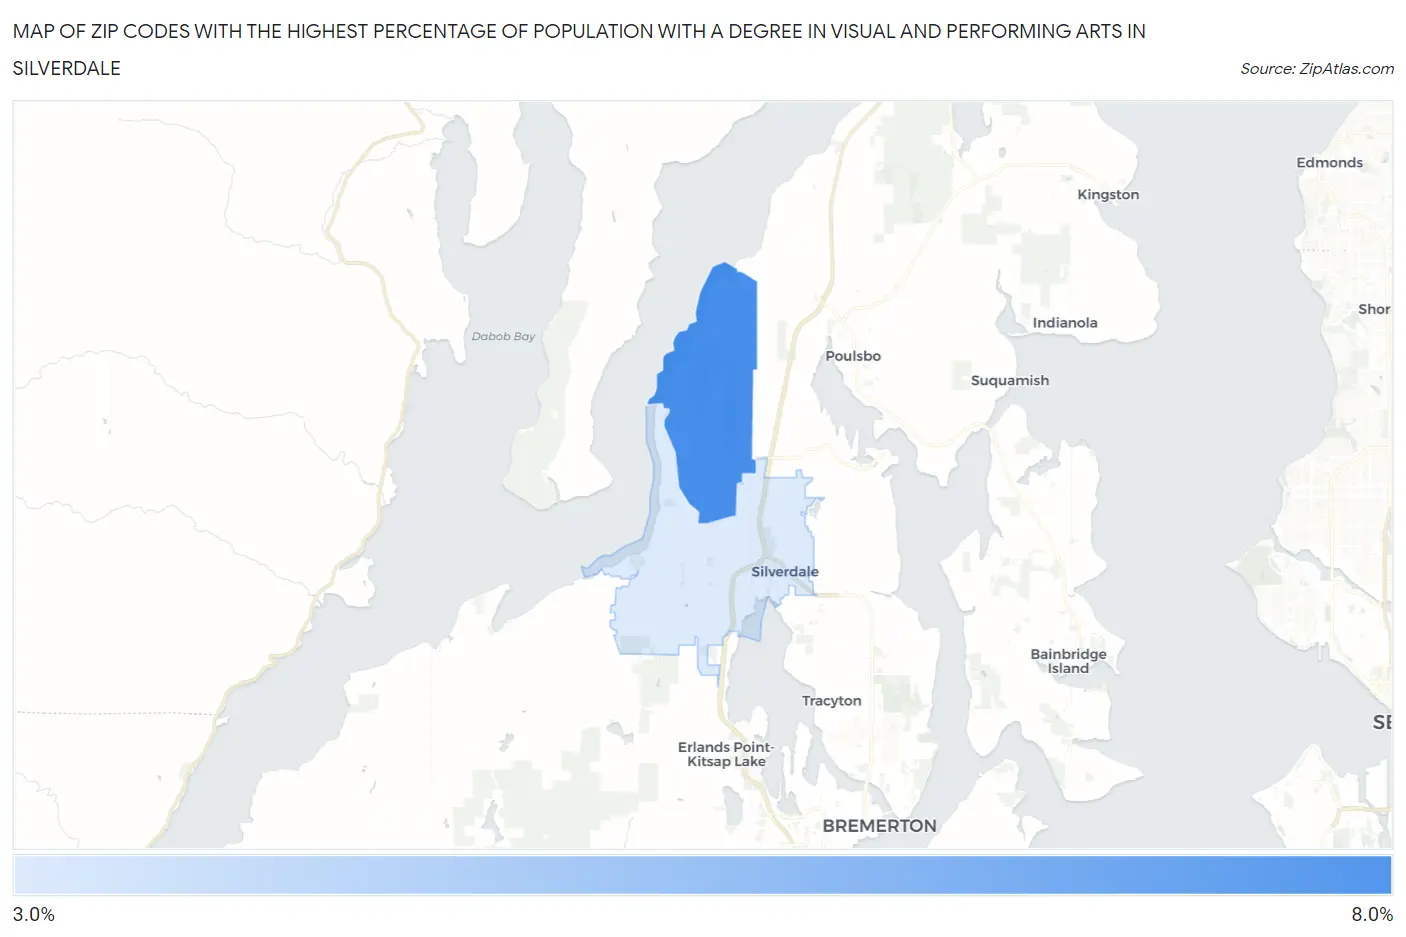
Map of Zip Codes with the Highest Percentage of Population with a Degree in Visual and Performing Arts in Silverdale
3.3%
6.3%
Zip Codes with the Highest Percentage of Population with a Degree in Visual and Performing Arts in Silverdale, WA
| Zip Code | % Graduates | vs State | vs National | |
| 1. | 98315 | 6.3% | 4.6%(+1.67)#112 | 4.3%(+2.04)#4,480 |
| 2. | 98383 | 3.3% | 4.6%(-1.31)#292 | 4.3%(-0.946)#11,590 |
1
Common Questions
What are the Top Zip Codes with the Highest Percentage of Population with a Degree in Visual and Performing Arts in Silverdale, WA?
Top Zip Codes with the Highest Percentage of Population with a Degree in Visual and Performing Arts in Silverdale, WA are:
What zip code has the Highest Percentage of Population with a Degree in Visual and Performing Arts in Silverdale, WA?
98315 has the Highest Percentage of Population with a Degree in Visual and Performing Arts in Silverdale, WA with 6.3%.
What is the Percentage of Population with a Degree in Visual and Performing Arts in Silverdale, WA?
Percentage of Population with a Degree in Visual and Performing Arts in Silverdale is 4.4%.
What is the Percentage of Population with a Degree in Visual and Performing Arts in Washington?
Percentage of Population with a Degree in Visual and Performing Arts in Washington is 4.6%.
What is the Percentage of Population with a Degree in Visual and Performing Arts in the United States?
Percentage of Population with a Degree in Visual and Performing Arts in the United States is 4.3%.