Zip Codes with the Highest Percentage of Population with a Degree in Visual and Performing Arts in Kent, WA
RELATED REPORTS & OPTIONS
Visual and Performing Arts
Kent
Compare Zip Codes
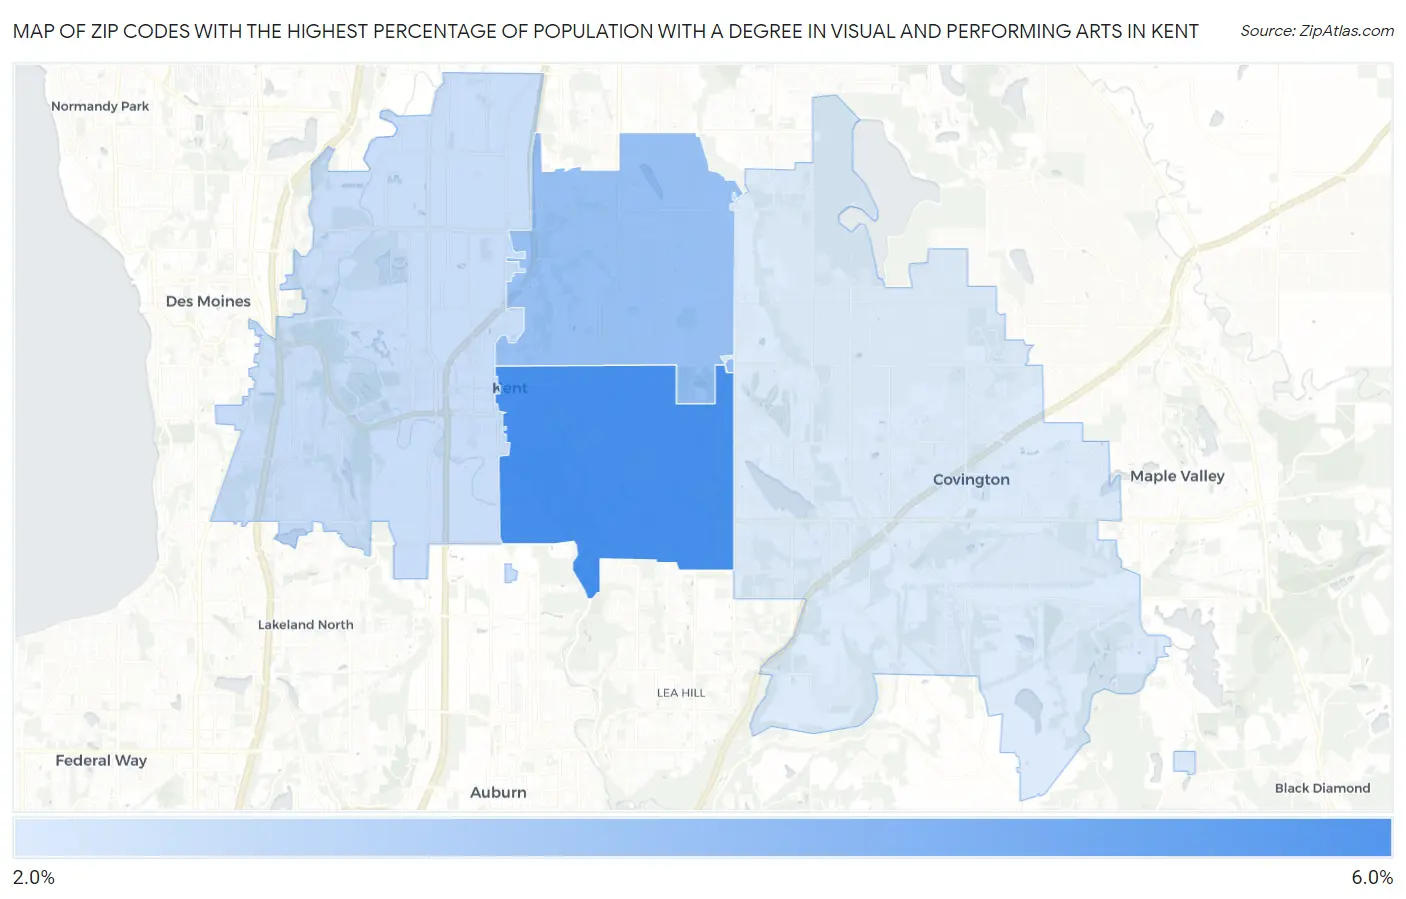
Map of Zip Codes with the Highest Percentage of Population with a Degree in Visual and Performing Arts in Kent
2.8%
5.4%
Zip Codes with the Highest Percentage of Population with a Degree in Visual and Performing Arts in Kent, WA
| Zip Code | % Graduates | vs State | vs National | |
| 1. | 98030 | 5.4% | 4.6%(+0.766)#160 | 4.3%(+1.13)#5,881 |
| 2. | 98031 | 4.0% | 4.6%(-0.629)#244 | 4.3%(-0.262)#9,293 |
| 3. | 98032 | 3.2% | 4.6%(-1.45)#305 | 4.3%(-1.08)#12,088 |
| 4. | 98042 | 2.8% | 4.6%(-1.81)#341 | 4.3%(-1.45)#13,465 |
1
Common Questions
What are the Top 3 Zip Codes with the Highest Percentage of Population with a Degree in Visual and Performing Arts in Kent, WA?
Top 3 Zip Codes with the Highest Percentage of Population with a Degree in Visual and Performing Arts in Kent, WA are:
What zip code has the Highest Percentage of Population with a Degree in Visual and Performing Arts in Kent, WA?
98030 has the Highest Percentage of Population with a Degree in Visual and Performing Arts in Kent, WA with 5.4%.
What is the Percentage of Population with a Degree in Visual and Performing Arts in Kent, WA?
Percentage of Population with a Degree in Visual and Performing Arts in Kent is 4.0%.
What is the Percentage of Population with a Degree in Visual and Performing Arts in Washington?
Percentage of Population with a Degree in Visual and Performing Arts in Washington is 4.6%.
What is the Percentage of Population with a Degree in Visual and Performing Arts in the United States?
Percentage of Population with a Degree in Visual and Performing Arts in the United States is 4.3%.