Croatian vs Immigrants from Yemen Unemployment Among Women with Children Ages 6 to 17 years
COMPARE
Croatian
Immigrants from Yemen
Unemployment Among Women with Children Ages 6 to 17 years
Unemployment Among Women with Children Ages 6 to 17 years Comparison
Croatians
Immigrants from Yemen
8.8%
UNEMPLOYMENT AMONG WOMEN WITH CHILDREN AGES 6 TO 17 YEARS
76.0/ 100
METRIC RATING
149th/ 347
METRIC RANK
12.7%
UNEMPLOYMENT AMONG WOMEN WITH CHILDREN AGES 6 TO 17 YEARS
0.0/ 100
METRIC RATING
337th/ 347
METRIC RANK
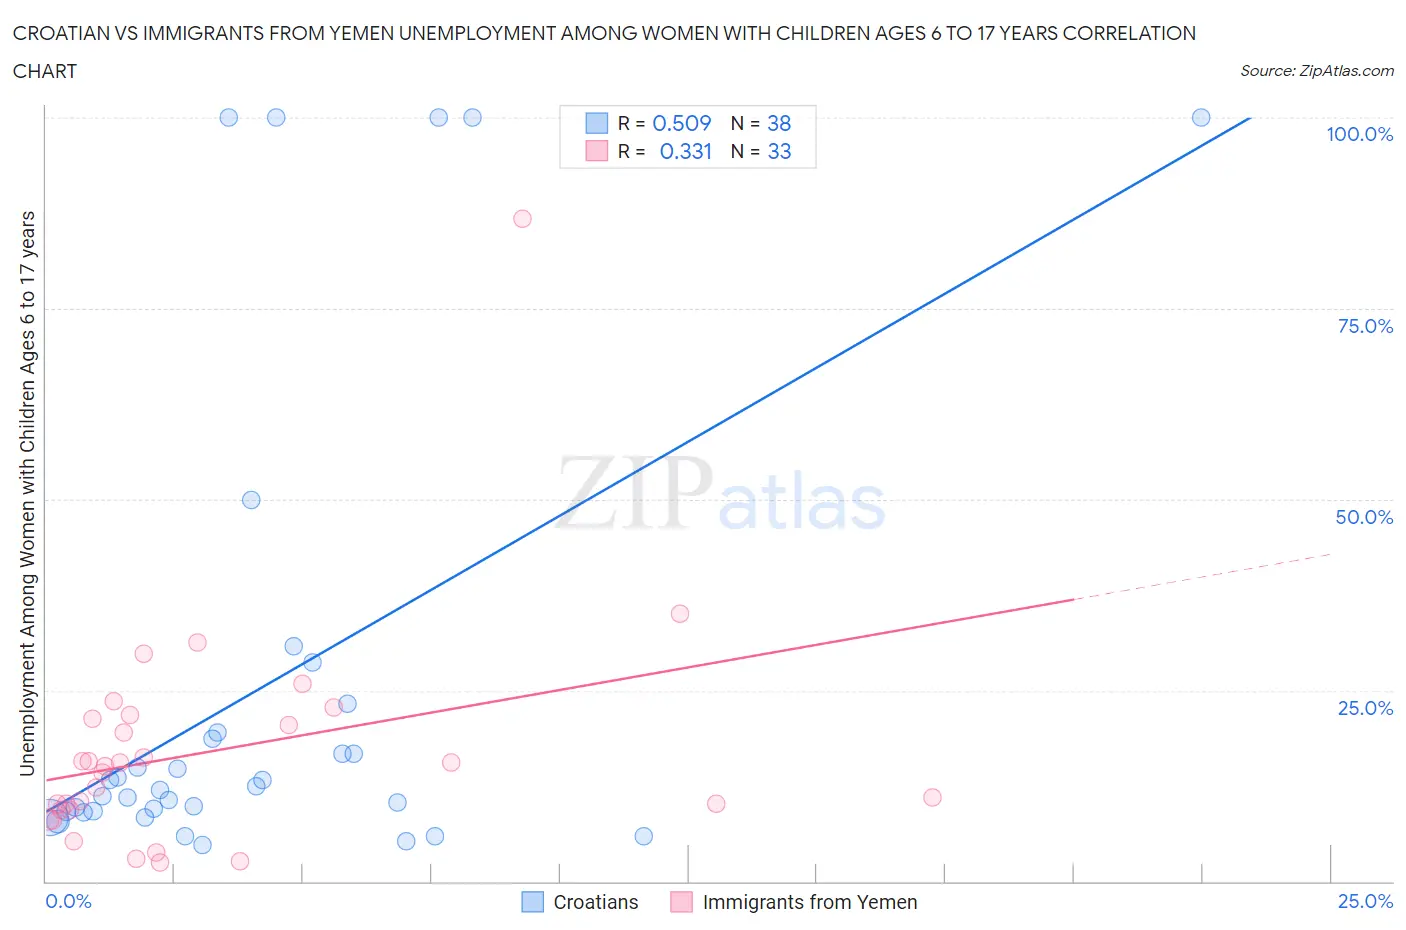
Croatian vs Immigrants from Yemen Unemployment Among Women with Children Ages 6 to 17 years Correlation Chart
The statistical analysis conducted on geographies consisting of 264,265,692 people shows a substantial positive correlation between the proportion of Croatians and unemployment rate among women with children between the ages 6 and 17 in the United States with a correlation coefficient (R) of 0.509 and weighted average of 8.8%. Similarly, the statistical analysis conducted on geographies consisting of 75,031,826 people shows a mild positive correlation between the proportion of Immigrants from Yemen and unemployment rate among women with children between the ages 6 and 17 in the United States with a correlation coefficient (R) of 0.331 and weighted average of 12.7%, a difference of 43.6%.
Unemployment Among Women with Children Ages 6 to 17 years Correlation Summary
| Measurement | Croatian | Immigrants from Yemen |
| Minimum | 4.8% | 2.4% |
| Maximum | 100.0% | 86.7% |
| Range | 95.2% | 84.3% |
| Mean | 25.0% | 17.0% |
| Median | 12.2% | 15.1% |
| Interquartile 25% (IQ1) | 9.1% | 9.3% |
| Interquartile 75% (IQ3) | 19.5% | 21.5% |
| Interquartile Range (IQR) | 10.3% | 12.2% |
| Standard Deviation (Sample) | 30.7% | 15.0% |
| Standard Deviation (Population) | 30.3% | 14.8% |
Similar Demographics by Unemployment Among Women with Children Ages 6 to 17 years
Demographics Similar to Croatians by Unemployment Among Women with Children Ages 6 to 17 years
In terms of unemployment among women with children ages 6 to 17 years, the demographic groups most similar to Croatians are Greek (8.9%, a difference of 0.050%), Costa Rican (8.8%, a difference of 0.060%), Immigrants from Eastern Africa (8.9%, a difference of 0.090%), Immigrants from Northern Europe (8.9%, a difference of 0.090%), and Immigrants from Europe (8.9%, a difference of 0.16%).
| Demographics | Rating | Rank | Unemployment Among Women with Children Ages 6 to 17 years |
| Immigrants | Austria | 87.5 /100 | #142 | Excellent 8.8% |
| Immigrants | Kenya | 86.1 /100 | #143 | Excellent 8.8% |
| Russians | 85.8 /100 | #144 | Excellent 8.8% |
| Kenyans | 85.6 /100 | #145 | Excellent 8.8% |
| Chileans | 80.8 /100 | #146 | Excellent 8.8% |
| Immigrants | Bangladesh | 79.4 /100 | #147 | Good 8.8% |
| Costa Ricans | 77.0 /100 | #148 | Good 8.8% |
| Croatians | 76.0 /100 | #149 | Good 8.8% |
| Greeks | 75.2 /100 | #150 | Good 8.9% |
| Immigrants | Eastern Africa | 74.6 /100 | #151 | Good 8.9% |
| Immigrants | Northern Europe | 74.6 /100 | #152 | Good 8.9% |
| Immigrants | Europe | 73.4 /100 | #153 | Good 8.9% |
| Vietnamese | 72.1 /100 | #154 | Good 8.9% |
| Immigrants | Greece | 71.8 /100 | #155 | Good 8.9% |
| Osage | 65.9 /100 | #156 | Good 8.9% |
Demographics Similar to Immigrants from Yemen by Unemployment Among Women with Children Ages 6 to 17 years
In terms of unemployment among women with children ages 6 to 17 years, the demographic groups most similar to Immigrants from Yemen are Hopi (12.9%, a difference of 1.5%), Houma (12.5%, a difference of 1.9%), Colville (12.3%, a difference of 2.9%), Sioux (13.2%, a difference of 4.2%), and Ugandan (12.0%, a difference of 5.7%).
| Demographics | Rating | Rank | Unemployment Among Women with Children Ages 6 to 17 years |
| Chippewa | 0.0 /100 | #330 | Tragic 11.1% |
| Blacks/African Americans | 0.0 /100 | #331 | Tragic 11.4% |
| Tsimshian | 0.0 /100 | #332 | Tragic 11.4% |
| Natives/Alaskans | 0.0 /100 | #333 | Tragic 11.5% |
| Ugandans | 0.0 /100 | #334 | Tragic 12.0% |
| Colville | 0.0 /100 | #335 | Tragic 12.3% |
| Houma | 0.0 /100 | #336 | Tragic 12.5% |
| Immigrants | Yemen | 0.0 /100 | #337 | Tragic 12.7% |
| Hopi | 0.0 /100 | #338 | Tragic 12.9% |
| Sioux | 0.0 /100 | #339 | Tragic 13.2% |
| Puerto Ricans | 0.0 /100 | #340 | Tragic 13.9% |
| Navajo | 0.0 /100 | #341 | Tragic 14.2% |
| Yuman | 0.0 /100 | #342 | Tragic 14.8% |
| Inupiat | 0.0 /100 | #343 | Tragic 14.9% |
| Cheyenne | 0.0 /100 | #344 | Tragic 16.4% |