Croatian vs Luxembourger Unemployment Among Women with Children Ages 6 to 17 years
COMPARE
Croatian
Luxembourger
Unemployment Among Women with Children Ages 6 to 17 years
Unemployment Among Women with Children Ages 6 to 17 years Comparison
Croatians
Luxembourgers
8.8%
UNEMPLOYMENT AMONG WOMEN WITH CHILDREN AGES 6 TO 17 YEARS
76.0/ 100
METRIC RATING
149th/ 347
METRIC RANK
8.3%
UNEMPLOYMENT AMONG WOMEN WITH CHILDREN AGES 6 TO 17 YEARS
99.9/ 100
METRIC RATING
66th/ 347
METRIC RANK
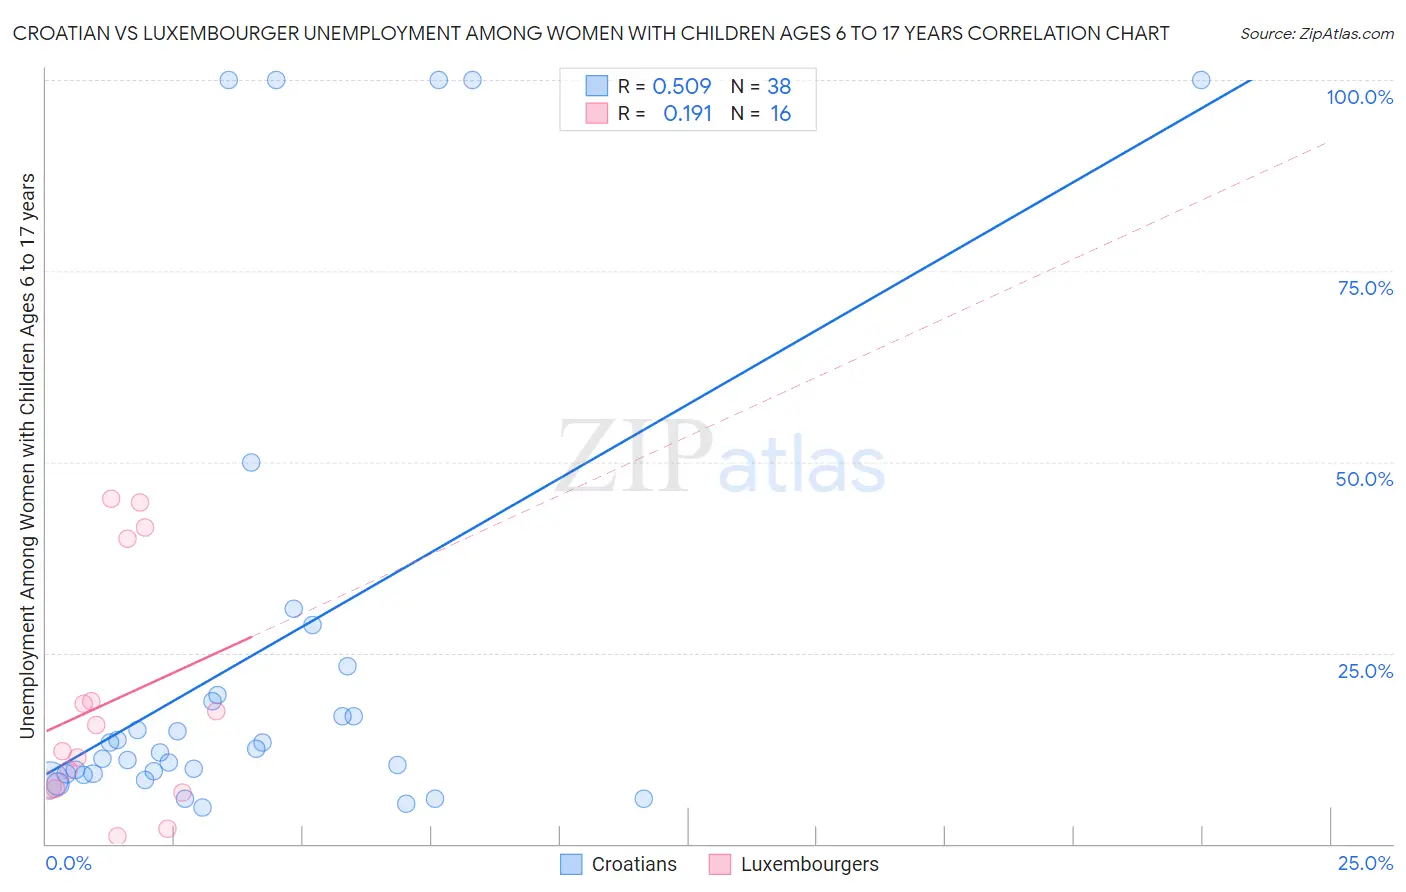
Croatian vs Luxembourger Unemployment Among Women with Children Ages 6 to 17 years Correlation Chart
The statistical analysis conducted on geographies consisting of 264,265,692 people shows a substantial positive correlation between the proportion of Croatians and unemployment rate among women with children between the ages 6 and 17 in the United States with a correlation coefficient (R) of 0.509 and weighted average of 8.8%. Similarly, the statistical analysis conducted on geographies consisting of 115,314,125 people shows a poor positive correlation between the proportion of Luxembourgers and unemployment rate among women with children between the ages 6 and 17 in the United States with a correlation coefficient (R) of 0.191 and weighted average of 8.3%, a difference of 6.8%.
Unemployment Among Women with Children Ages 6 to 17 years Correlation Summary
| Measurement | Croatian | Luxembourger |
| Minimum | 4.8% | 0.97% |
| Maximum | 100.0% | 45.2% |
| Range | 95.2% | 44.2% |
| Mean | 25.0% | 18.7% |
| Median | 12.2% | 13.9% |
| Interquartile 25% (IQ1) | 9.1% | 7.4% |
| Interquartile 75% (IQ3) | 19.5% | 29.4% |
| Interquartile Range (IQR) | 10.3% | 21.9% |
| Standard Deviation (Sample) | 30.7% | 15.4% |
| Standard Deviation (Population) | 30.3% | 14.9% |
Similar Demographics by Unemployment Among Women with Children Ages 6 to 17 years
Demographics Similar to Croatians by Unemployment Among Women with Children Ages 6 to 17 years
In terms of unemployment among women with children ages 6 to 17 years, the demographic groups most similar to Croatians are Greek (8.9%, a difference of 0.050%), Costa Rican (8.8%, a difference of 0.060%), Immigrants from Eastern Africa (8.9%, a difference of 0.090%), Immigrants from Northern Europe (8.9%, a difference of 0.090%), and Immigrants from Europe (8.9%, a difference of 0.16%).
| Demographics | Rating | Rank | Unemployment Among Women with Children Ages 6 to 17 years |
| Immigrants | Austria | 87.5 /100 | #142 | Excellent 8.8% |
| Immigrants | Kenya | 86.1 /100 | #143 | Excellent 8.8% |
| Russians | 85.8 /100 | #144 | Excellent 8.8% |
| Kenyans | 85.6 /100 | #145 | Excellent 8.8% |
| Chileans | 80.8 /100 | #146 | Excellent 8.8% |
| Immigrants | Bangladesh | 79.4 /100 | #147 | Good 8.8% |
| Costa Ricans | 77.0 /100 | #148 | Good 8.8% |
| Croatians | 76.0 /100 | #149 | Good 8.8% |
| Greeks | 75.2 /100 | #150 | Good 8.9% |
| Immigrants | Eastern Africa | 74.6 /100 | #151 | Good 8.9% |
| Immigrants | Northern Europe | 74.6 /100 | #152 | Good 8.9% |
| Immigrants | Europe | 73.4 /100 | #153 | Good 8.9% |
| Vietnamese | 72.1 /100 | #154 | Good 8.9% |
| Immigrants | Greece | 71.8 /100 | #155 | Good 8.9% |
| Osage | 65.9 /100 | #156 | Good 8.9% |
Demographics Similar to Luxembourgers by Unemployment Among Women with Children Ages 6 to 17 years
In terms of unemployment among women with children ages 6 to 17 years, the demographic groups most similar to Luxembourgers are Armenian (8.3%, a difference of 0.10%), Immigrants from Albania (8.3%, a difference of 0.13%), Marshallese (8.3%, a difference of 0.18%), Immigrants from Thailand (8.3%, a difference of 0.21%), and Immigrants from Kuwait (8.3%, a difference of 0.22%).
| Demographics | Rating | Rank | Unemployment Among Women with Children Ages 6 to 17 years |
| Immigrants | Philippines | 100.0 /100 | #59 | Exceptional 8.2% |
| Basques | 100.0 /100 | #60 | Exceptional 8.2% |
| Koreans | 100.0 /100 | #61 | Exceptional 8.2% |
| Spanish American Indians | 100.0 /100 | #62 | Exceptional 8.2% |
| Immigrants | South Eastern Asia | 99.9 /100 | #63 | Exceptional 8.2% |
| Immigrants | Kuwait | 99.9 /100 | #64 | Exceptional 8.3% |
| Immigrants | Albania | 99.9 /100 | #65 | Exceptional 8.3% |
| Luxembourgers | 99.9 /100 | #66 | Exceptional 8.3% |
| Armenians | 99.9 /100 | #67 | Exceptional 8.3% |
| Marshallese | 99.9 /100 | #68 | Exceptional 8.3% |
| Immigrants | Thailand | 99.9 /100 | #69 | Exceptional 8.3% |
| Norwegians | 99.9 /100 | #70 | Exceptional 8.3% |
| Immigrants | Australia | 99.8 /100 | #71 | Exceptional 8.3% |
| Immigrants | Nepal | 99.8 /100 | #72 | Exceptional 8.3% |
| Spanish Americans | 99.8 /100 | #73 | Exceptional 8.4% |