Zip Codes with the Highest Percentage of Population with a Degree in Visual and Performing Arts in Cranston, RI
RELATED REPORTS & OPTIONS
Visual and Performing Arts
Cranston
Compare Zip Codes
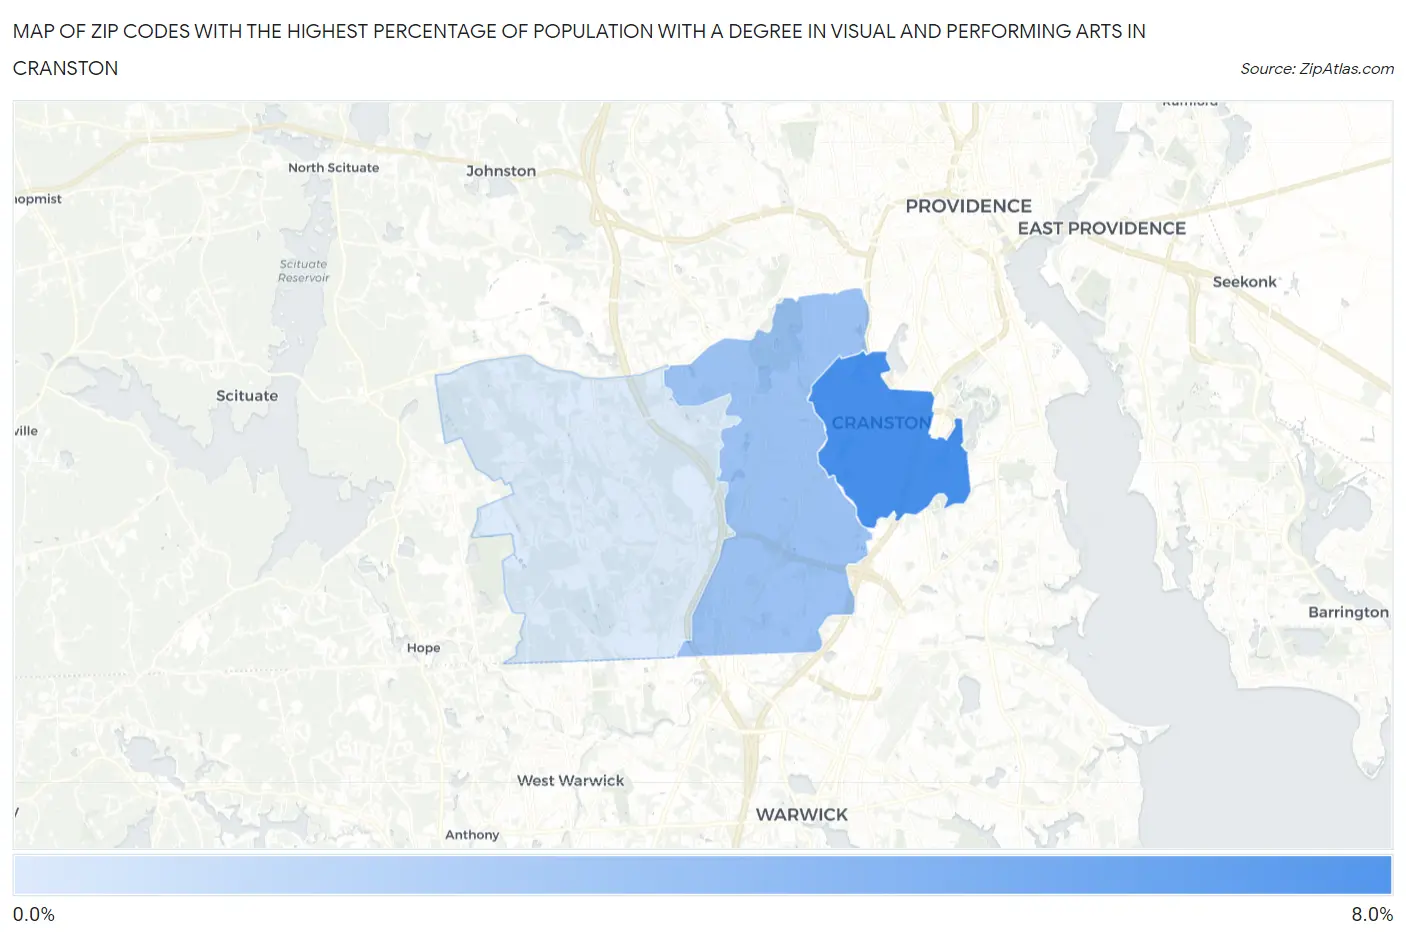
Map of Zip Codes with the Highest Percentage of Population with a Degree in Visual and Performing Arts in Cranston
1.1%
6.8%
Zip Codes with the Highest Percentage of Population with a Degree in Visual and Performing Arts in Cranston, RI
| Zip Code | % Graduates | vs State | vs National | |
| 1. | 02910 | 6.8% | 5.4%(+1.40)#21 | 4.3%(+2.55)#3,878 |
| 2. | 02920 | 3.6% | 5.4%(-1.82)#47 | 4.3%(-0.675)#10,574 |
| 3. | 02921 | 1.1% | 5.4%(-4.30)#68 | 4.3%(-3.16)#19,411 |
1
Common Questions
What are the Top Zip Codes with the Highest Percentage of Population with a Degree in Visual and Performing Arts in Cranston, RI?
Top Zip Codes with the Highest Percentage of Population with a Degree in Visual and Performing Arts in Cranston, RI are:
What zip code has the Highest Percentage of Population with a Degree in Visual and Performing Arts in Cranston, RI?
02910 has the Highest Percentage of Population with a Degree in Visual and Performing Arts in Cranston, RI with 6.8%.
What is the Percentage of Population with a Degree in Visual and Performing Arts in Cranston, RI?
Percentage of Population with a Degree in Visual and Performing Arts in Cranston is 4.5%.
What is the Percentage of Population with a Degree in Visual and Performing Arts in Rhode Island?
Percentage of Population with a Degree in Visual and Performing Arts in Rhode Island is 5.4%.
What is the Percentage of Population with a Degree in Visual and Performing Arts in the United States?
Percentage of Population with a Degree in Visual and Performing Arts in the United States is 4.3%.