Zip Codes with the Highest Percentage of Households with Income Above $200,000 in Cranston, RI
RELATED REPORTS & OPTIONS
Household Income | $200k+
Cranston
Compare Zip Codes
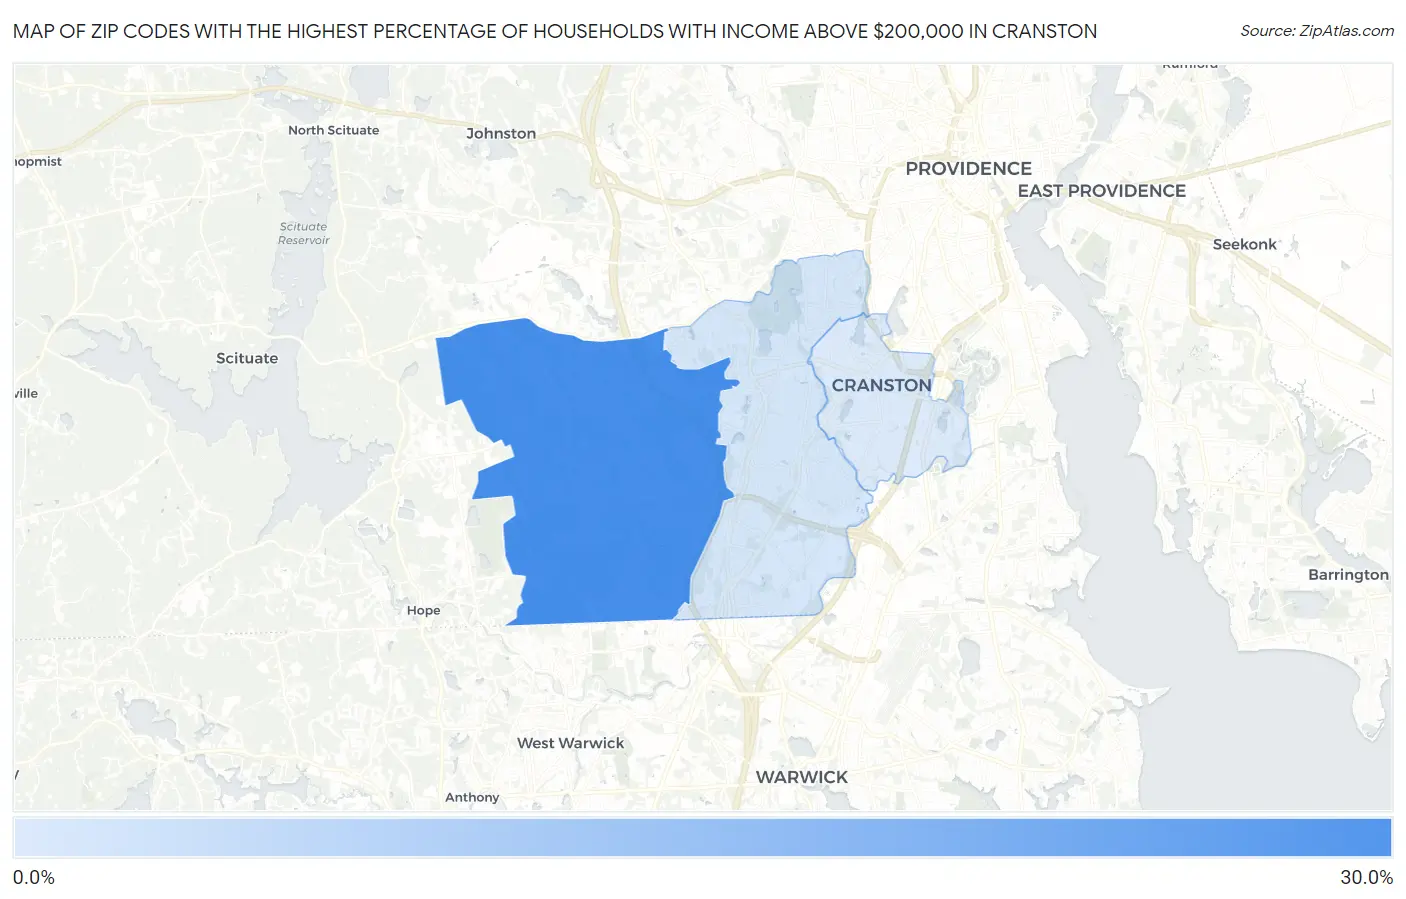
Map of Zip Codes with the Highest Percentage of Households with Income Above $200,000 in Cranston
6.4%
27.0%
Zip Codes with the Highest Percentage of Households with Income Above $200,000 in Cranston, RI
| Zip Code | Households with Income > $200k | vs State | vs National | |
| 1. | 02921 | 27.0% | 11.3%(+15.7)#7 | 11.4%(+15.6)#1,886 |
| 2. | 02920 | 7.2% | 11.3%(-4.10)#53 | 11.4%(-4.20)#11,486 |
| 3. | 02910 | 6.4% | 11.3%(-4.90)#59 | 11.4%(-5.00)#12,737 |
1
Common Questions
What are the Top Zip Codes with the Highest Percentage of Households with Income Above $200,000 in Cranston, RI?
Top Zip Codes with the Highest Percentage of Households with Income Above $200,000 in Cranston, RI are:
What zip code has the Highest Percentage of Households with Income Above $200,000 in Cranston, RI?
02921 has the Highest Percentage of Households with Income Above $200,000 in Cranston, RI with 27.0%.
What is the Percentage of Households with Income Above $200,000 in Cranston, RI?
Percentage of Households with Income Above $200,000 in Cranston is 10.8%.
What is the Percentage of Households with Income Above $200,000 in Rhode Island?
Percentage of Households with Income Above $200,000 in Rhode Island is 11.3%.
What is the Percentage of Households with Income Above $200,000 in the United States?
Percentage of Households with Income Above $200,000 in the United States is 11.4%.