Samoan vs Chinese Single Female Poverty
COMPARE
Samoan
Chinese
Single Female Poverty
Single Female Poverty Comparison
Samoans
Chinese
20.6%
SINGLE FEMALE POVERTY
76.0/ 100
METRIC RATING
155th/ 347
METRIC RANK
16.1%
SINGLE FEMALE POVERTY
100.0/ 100
METRIC RATING
1st/ 347
METRIC RANK
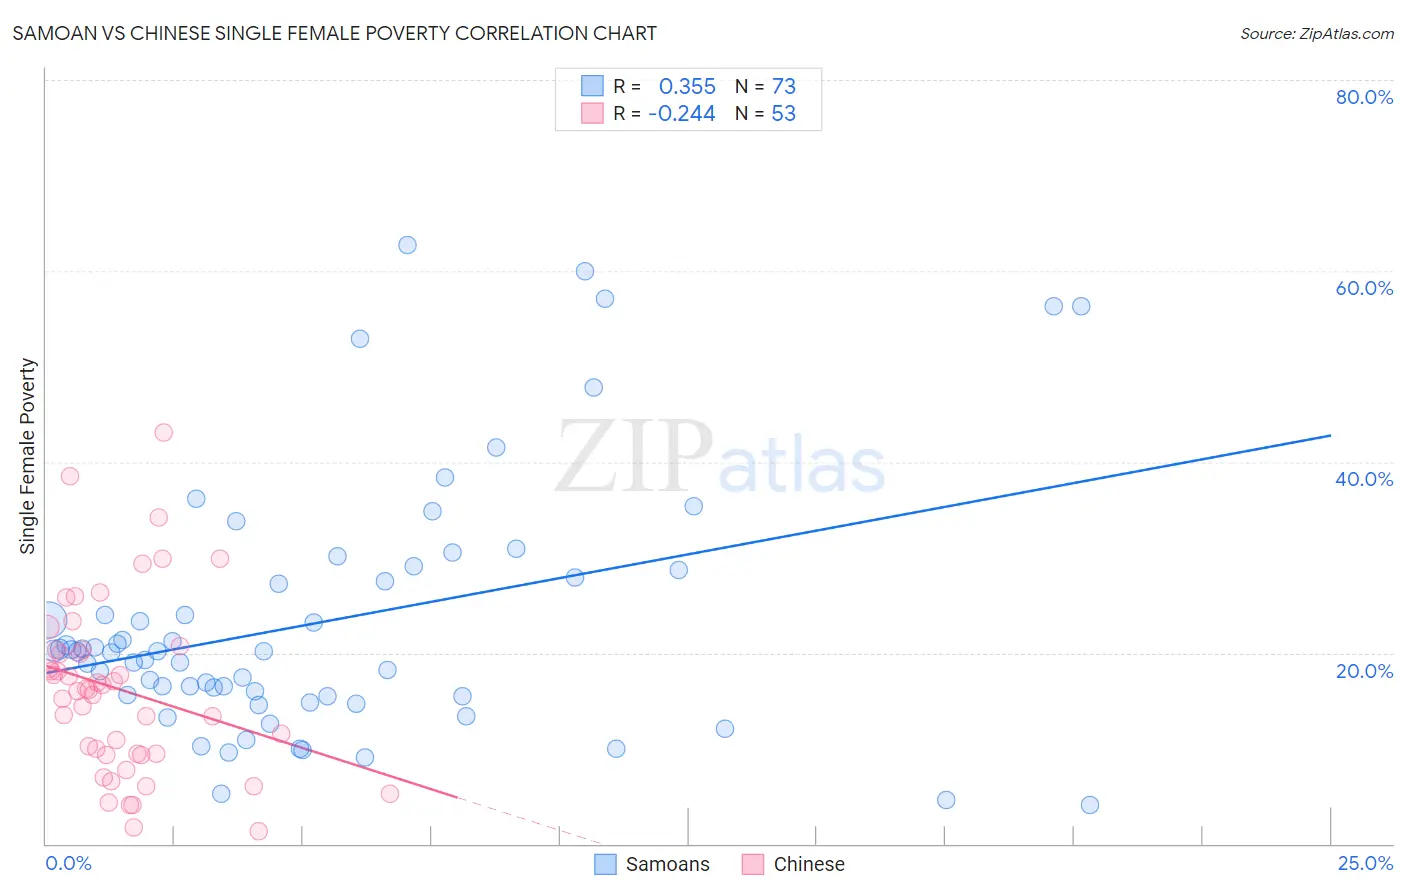
Samoan vs Chinese Single Female Poverty Correlation Chart
The statistical analysis conducted on geographies consisting of 223,791,038 people shows a mild positive correlation between the proportion of Samoans and poverty level among single females in the United States with a correlation coefficient (R) of 0.355 and weighted average of 20.6%. Similarly, the statistical analysis conducted on geographies consisting of 64,651,041 people shows a weak negative correlation between the proportion of Chinese and poverty level among single females in the United States with a correlation coefficient (R) of -0.244 and weighted average of 16.1%, a difference of 27.8%.
Single Female Poverty Correlation Summary
| Measurement | Samoan | Chinese |
| Minimum | 4.0% | 1.3% |
| Maximum | 62.7% | 43.0% |
| Range | 58.7% | 41.7% |
| Mean | 23.3% | 16.1% |
| Median | 20.1% | 16.1% |
| Interquartile 25% (IQ1) | 15.4% | 9.3% |
| Interquartile 75% (IQ3) | 28.3% | 20.3% |
| Interquartile Range (IQR) | 12.9% | 10.9% |
| Standard Deviation (Sample) | 13.3% | 9.1% |
| Standard Deviation (Population) | 13.2% | 9.1% |
Similar Demographics by Single Female Poverty
Demographics Similar to Samoans by Single Female Poverty
In terms of single female poverty, the demographic groups most similar to Samoans are South American Indian (20.6%, a difference of 0.030%), Immigrants from Western Europe (20.6%, a difference of 0.060%), Swedish (20.6%, a difference of 0.10%), Immigrants from Uruguay (20.6%, a difference of 0.15%), and Immigrants from Oceania (20.7%, a difference of 0.15%).
| Demographics | Rating | Rank | Single Female Poverty |
| Luxembourgers | 84.9 /100 | #148 | Excellent 20.4% |
| Portuguese | 81.5 /100 | #149 | Excellent 20.5% |
| Immigrants | Denmark | 80.5 /100 | #150 | Excellent 20.5% |
| Puget Sound Salish | 79.6 /100 | #151 | Good 20.6% |
| Immigrants | Uruguay | 77.7 /100 | #152 | Good 20.6% |
| Swedes | 77.1 /100 | #153 | Good 20.6% |
| Immigrants | Western Europe | 76.7 /100 | #154 | Good 20.6% |
| Samoans | 76.0 /100 | #155 | Good 20.6% |
| South American Indians | 75.7 /100 | #156 | Good 20.6% |
| Immigrants | Oceania | 74.3 /100 | #157 | Good 20.7% |
| Danes | 73.0 /100 | #158 | Good 20.7% |
| Costa Ricans | 71.8 /100 | #159 | Good 20.7% |
| Arabs | 70.8 /100 | #160 | Good 20.7% |
| Kenyans | 68.5 /100 | #161 | Good 20.8% |
| Northern Europeans | 68.4 /100 | #162 | Good 20.8% |
Demographics Similar to Chinese by Single Female Poverty
In terms of single female poverty, the demographic groups most similar to Chinese are Immigrants from Taiwan (16.4%, a difference of 1.3%), Immigrants from Hong Kong (16.5%, a difference of 2.4%), Immigrants from India (16.8%, a difference of 4.2%), Assyrian/Chaldean/Syriac (17.0%, a difference of 5.0%), and Filipino (17.0%, a difference of 5.2%).
| Demographics | Rating | Rank | Single Female Poverty |
| Chinese | 100.0 /100 | #1 | Exceptional 16.1% |
| Immigrants | Taiwan | 100.0 /100 | #2 | Exceptional 16.4% |
| Immigrants | Hong Kong | 100.0 /100 | #3 | Exceptional 16.5% |
| Immigrants | India | 100.0 /100 | #4 | Exceptional 16.8% |
| Assyrians/Chaldeans/Syriacs | 100.0 /100 | #5 | Exceptional 17.0% |
| Filipinos | 100.0 /100 | #6 | Exceptional 17.0% |
| Thais | 100.0 /100 | #7 | Exceptional 17.3% |
| Immigrants | Iran | 100.0 /100 | #8 | Exceptional 17.5% |
| Bhutanese | 100.0 /100 | #9 | Exceptional 17.7% |
| Immigrants | Ireland | 100.0 /100 | #10 | Exceptional 17.8% |
| Immigrants | Lithuania | 100.0 /100 | #11 | Exceptional 17.8% |
| Immigrants | South Central Asia | 100.0 /100 | #12 | Exceptional 17.8% |
| Immigrants | Bolivia | 100.0 /100 | #13 | Exceptional 17.8% |
| Bolivians | 100.0 /100 | #14 | Exceptional 17.9% |
| Indians (Asian) | 100.0 /100 | #15 | Exceptional 17.9% |