Irish vs Chinese Single Female Poverty
COMPARE
Irish
Chinese
Single Female Poverty
Single Female Poverty Comparison
Irish
Chinese
21.4%
SINGLE FEMALE POVERTY
21.4/ 100
METRIC RATING
200th/ 347
METRIC RANK
16.1%
SINGLE FEMALE POVERTY
100.0/ 100
METRIC RATING
1st/ 347
METRIC RANK
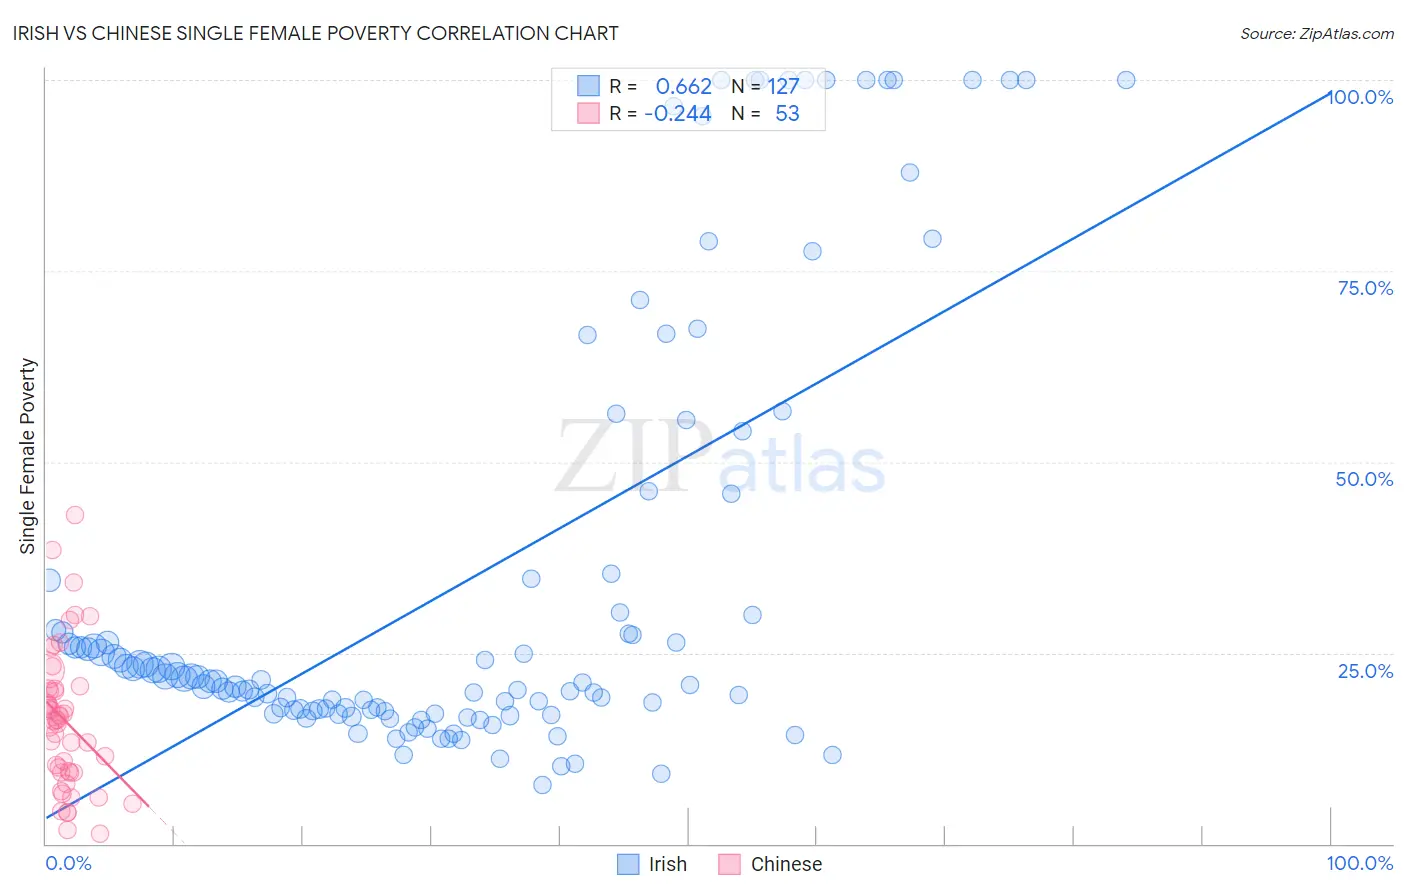
Irish vs Chinese Single Female Poverty Correlation Chart
The statistical analysis conducted on geographies consisting of 557,675,928 people shows a significant positive correlation between the proportion of Irish and poverty level among single females in the United States with a correlation coefficient (R) of 0.662 and weighted average of 21.4%. Similarly, the statistical analysis conducted on geographies consisting of 64,651,041 people shows a weak negative correlation between the proportion of Chinese and poverty level among single females in the United States with a correlation coefficient (R) of -0.244 and weighted average of 16.1%, a difference of 32.8%.
Single Female Poverty Correlation Summary
| Measurement | Irish | Chinese |
| Minimum | 7.7% | 1.3% |
| Maximum | 100.0% | 43.0% |
| Range | 92.3% | 41.7% |
| Mean | 34.3% | 16.1% |
| Median | 21.2% | 16.1% |
| Interquartile 25% (IQ1) | 17.4% | 9.3% |
| Interquartile 75% (IQ3) | 34.5% | 20.3% |
| Interquartile Range (IQR) | 17.1% | 10.9% |
| Standard Deviation (Sample) | 28.5% | 9.1% |
| Standard Deviation (Population) | 28.4% | 9.1% |
Similar Demographics by Single Female Poverty
Demographics Similar to Irish by Single Female Poverty
In terms of single female poverty, the demographic groups most similar to Irish are Nigerian (21.4%, a difference of 0.040%), Immigrants (21.4%, a difference of 0.050%), Immigrants from Kenya (21.4%, a difference of 0.070%), Swiss (21.4%, a difference of 0.25%), and Immigrants from Haiti (21.5%, a difference of 0.25%).
| Demographics | Rating | Rank | Single Female Poverty |
| Basques | 28.1 /100 | #193 | Fair 21.3% |
| Czechoslovakians | 27.7 /100 | #194 | Fair 21.3% |
| Nicaraguans | 27.6 /100 | #195 | Fair 21.3% |
| Immigrants | Saudi Arabia | 27.1 /100 | #196 | Fair 21.3% |
| Japanese | 26.4 /100 | #197 | Fair 21.3% |
| Swiss | 24.2 /100 | #198 | Fair 21.4% |
| Immigrants | Immigrants | 22.0 /100 | #199 | Fair 21.4% |
| Irish | 21.4 /100 | #200 | Fair 21.4% |
| Nigerians | 20.9 /100 | #201 | Fair 21.4% |
| Immigrants | Kenya | 20.7 /100 | #202 | Fair 21.4% |
| Immigrants | Haiti | 18.8 /100 | #203 | Poor 21.5% |
| Immigrants | Africa | 16.7 /100 | #204 | Poor 21.5% |
| Finns | 16.2 /100 | #205 | Poor 21.5% |
| Belgians | 16.1 /100 | #206 | Poor 21.5% |
| Ghanaians | 15.7 /100 | #207 | Poor 21.6% |
Demographics Similar to Chinese by Single Female Poverty
In terms of single female poverty, the demographic groups most similar to Chinese are Immigrants from Taiwan (16.4%, a difference of 1.3%), Immigrants from Hong Kong (16.5%, a difference of 2.4%), Immigrants from India (16.8%, a difference of 4.2%), Assyrian/Chaldean/Syriac (17.0%, a difference of 5.0%), and Filipino (17.0%, a difference of 5.2%).
| Demographics | Rating | Rank | Single Female Poverty |
| Chinese | 100.0 /100 | #1 | Exceptional 16.1% |
| Immigrants | Taiwan | 100.0 /100 | #2 | Exceptional 16.4% |
| Immigrants | Hong Kong | 100.0 /100 | #3 | Exceptional 16.5% |
| Immigrants | India | 100.0 /100 | #4 | Exceptional 16.8% |
| Assyrians/Chaldeans/Syriacs | 100.0 /100 | #5 | Exceptional 17.0% |
| Filipinos | 100.0 /100 | #6 | Exceptional 17.0% |
| Thais | 100.0 /100 | #7 | Exceptional 17.3% |
| Immigrants | Iran | 100.0 /100 | #8 | Exceptional 17.5% |
| Bhutanese | 100.0 /100 | #9 | Exceptional 17.7% |
| Immigrants | Ireland | 100.0 /100 | #10 | Exceptional 17.8% |
| Immigrants | Lithuania | 100.0 /100 | #11 | Exceptional 17.8% |
| Immigrants | South Central Asia | 100.0 /100 | #12 | Exceptional 17.8% |
| Immigrants | Bolivia | 100.0 /100 | #13 | Exceptional 17.8% |
| Bolivians | 100.0 /100 | #14 | Exceptional 17.9% |
| Indians (Asian) | 100.0 /100 | #15 | Exceptional 17.9% |