Samoan vs Immigrants from Norway Single Female Poverty
COMPARE
Samoan
Immigrants from Norway
Single Female Poverty
Single Female Poverty Comparison
Samoans
Immigrants from Norway
20.6%
SINGLE FEMALE POVERTY
76.0/ 100
METRIC RATING
155th/ 347
METRIC RANK
20.8%
SINGLE FEMALE POVERTY
63.0/ 100
METRIC RATING
167th/ 347
METRIC RANK
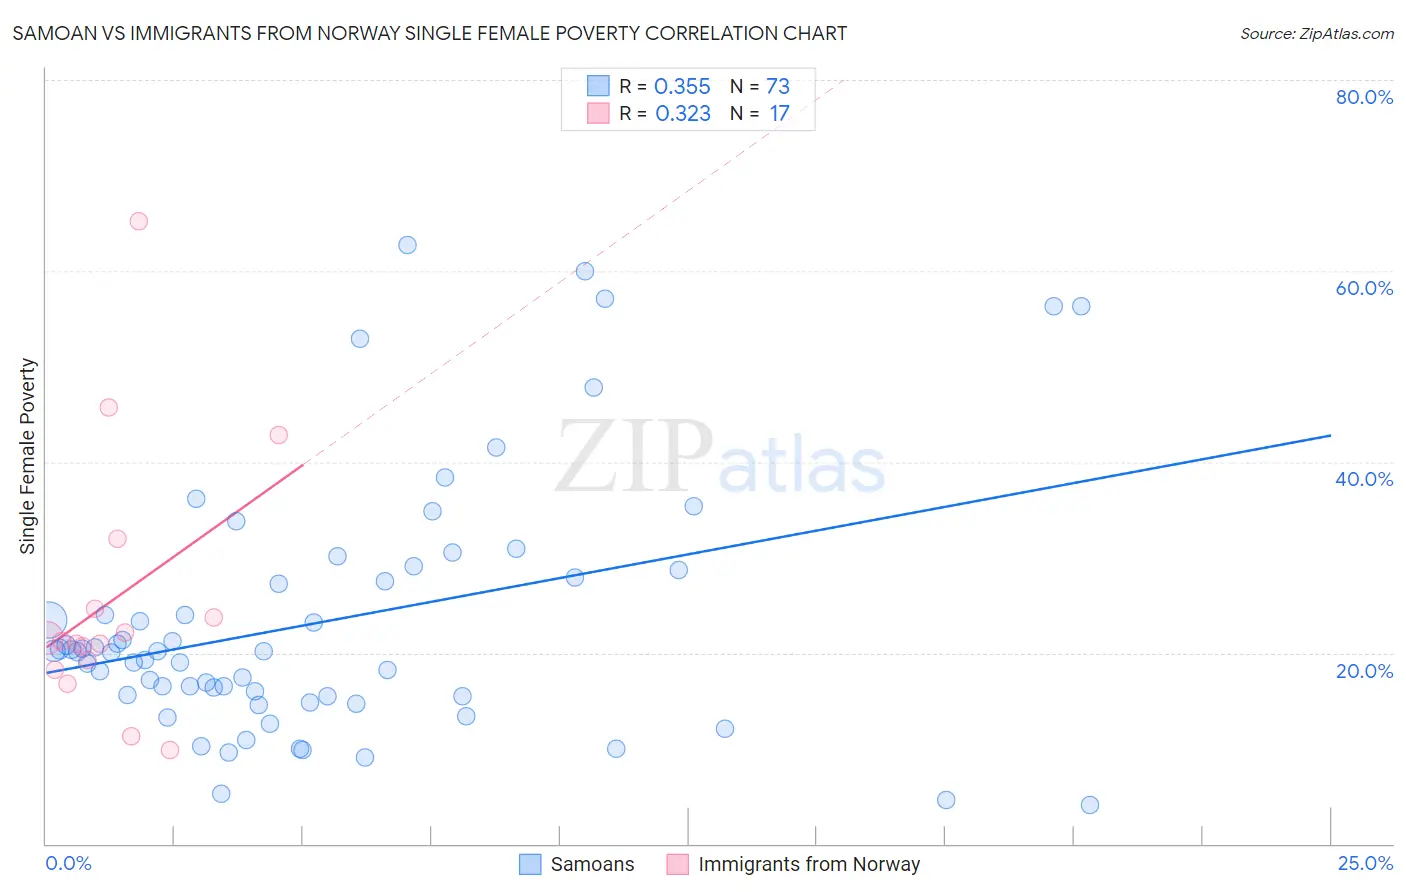
Samoan vs Immigrants from Norway Single Female Poverty Correlation Chart
The statistical analysis conducted on geographies consisting of 223,791,038 people shows a mild positive correlation between the proportion of Samoans and poverty level among single females in the United States with a correlation coefficient (R) of 0.355 and weighted average of 20.6%. Similarly, the statistical analysis conducted on geographies consisting of 115,651,083 people shows a mild positive correlation between the proportion of Immigrants from Norway and poverty level among single females in the United States with a correlation coefficient (R) of 0.323 and weighted average of 20.8%, a difference of 0.99%.
Single Female Poverty Correlation Summary
| Measurement | Samoan | Immigrants from Norway |
| Minimum | 4.0% | 9.8% |
| Maximum | 62.7% | 65.2% |
| Range | 58.7% | 55.4% |
| Mean | 23.3% | 25.7% |
| Median | 20.1% | 21.2% |
| Interquartile 25% (IQ1) | 15.4% | 18.7% |
| Interquartile 75% (IQ3) | 28.3% | 28.3% |
| Interquartile Range (IQR) | 12.9% | 9.6% |
| Standard Deviation (Sample) | 13.3% | 13.8% |
| Standard Deviation (Population) | 13.2% | 13.4% |
Demographics Similar to Samoans and Immigrants from Norway by Single Female Poverty
In terms of single female poverty, the demographic groups most similar to Samoans are South American Indian (20.6%, a difference of 0.030%), Immigrants from Western Europe (20.6%, a difference of 0.060%), Swedish (20.6%, a difference of 0.10%), Immigrants from Uruguay (20.6%, a difference of 0.15%), and Immigrants from Oceania (20.7%, a difference of 0.15%). Similarly, the demographic groups most similar to Immigrants from Norway are Norwegian (20.8%, a difference of 0.0%), Ugandan (20.8%, a difference of 0.070%), Immigrants from Costa Rica (20.9%, a difference of 0.090%), Iraqi (20.8%, a difference of 0.10%), and Lebanese (20.8%, a difference of 0.32%).
| Demographics | Rating | Rank | Single Female Poverty |
| Puget Sound Salish | 79.6 /100 | #151 | Good 20.6% |
| Immigrants | Uruguay | 77.7 /100 | #152 | Good 20.6% |
| Swedes | 77.1 /100 | #153 | Good 20.6% |
| Immigrants | Western Europe | 76.7 /100 | #154 | Good 20.6% |
| Samoans | 76.0 /100 | #155 | Good 20.6% |
| South American Indians | 75.7 /100 | #156 | Good 20.6% |
| Immigrants | Oceania | 74.3 /100 | #157 | Good 20.7% |
| Danes | 73.0 /100 | #158 | Good 20.7% |
| Costa Ricans | 71.8 /100 | #159 | Good 20.7% |
| Arabs | 70.8 /100 | #160 | Good 20.7% |
| Kenyans | 68.5 /100 | #161 | Good 20.8% |
| Northern Europeans | 68.4 /100 | #162 | Good 20.8% |
| Lebanese | 67.6 /100 | #163 | Good 20.8% |
| Iraqis | 64.5 /100 | #164 | Good 20.8% |
| Ugandans | 64.0 /100 | #165 | Good 20.8% |
| Norwegians | 63.0 /100 | #166 | Good 20.8% |
| Immigrants | Norway | 63.0 /100 | #167 | Good 20.8% |
| Immigrants | Costa Rica | 61.5 /100 | #168 | Good 20.9% |
| Immigrants | Trinidad and Tobago | 56.3 /100 | #169 | Average 20.9% |
| New Zealanders | 53.2 /100 | #170 | Average 21.0% |
| Moroccans | 52.8 /100 | #171 | Average 21.0% |