Samoan vs Potawatomi Single Female Poverty
COMPARE
Samoan
Potawatomi
Single Female Poverty
Single Female Poverty Comparison
Samoans
Potawatomi
20.6%
SINGLE FEMALE POVERTY
76.0/ 100
METRIC RATING
155th/ 347
METRIC RANK
25.4%
SINGLE FEMALE POVERTY
0.0/ 100
METRIC RATING
307th/ 347
METRIC RANK
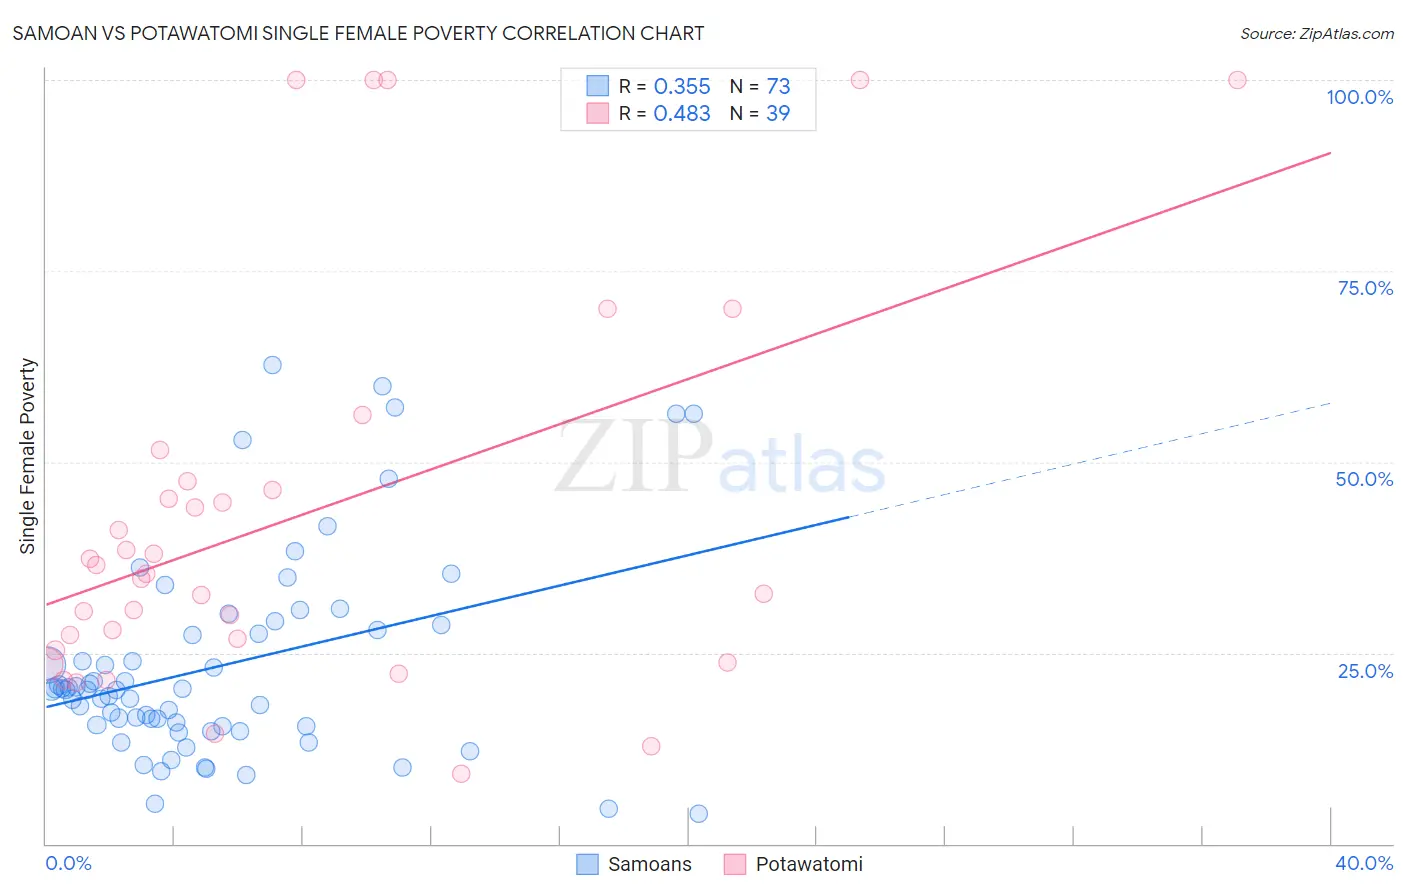
Samoan vs Potawatomi Single Female Poverty Correlation Chart
The statistical analysis conducted on geographies consisting of 223,791,038 people shows a mild positive correlation between the proportion of Samoans and poverty level among single females in the United States with a correlation coefficient (R) of 0.355 and weighted average of 20.6%. Similarly, the statistical analysis conducted on geographies consisting of 117,128,291 people shows a moderate positive correlation between the proportion of Potawatomi and poverty level among single females in the United States with a correlation coefficient (R) of 0.483 and weighted average of 25.4%, a difference of 23.0%.
Single Female Poverty Correlation Summary
| Measurement | Samoan | Potawatomi |
| Minimum | 4.0% | 9.1% |
| Maximum | 62.7% | 100.0% |
| Range | 58.7% | 90.9% |
| Mean | 23.3% | 42.8% |
| Median | 20.1% | 35.3% |
| Interquartile 25% (IQ1) | 15.4% | 25.3% |
| Interquartile 75% (IQ3) | 28.3% | 47.5% |
| Interquartile Range (IQR) | 12.9% | 22.2% |
| Standard Deviation (Sample) | 13.3% | 25.9% |
| Standard Deviation (Population) | 13.2% | 25.5% |
Similar Demographics by Single Female Poverty
Demographics Similar to Samoans by Single Female Poverty
In terms of single female poverty, the demographic groups most similar to Samoans are South American Indian (20.6%, a difference of 0.030%), Immigrants from Western Europe (20.6%, a difference of 0.060%), Swedish (20.6%, a difference of 0.10%), Immigrants from Uruguay (20.6%, a difference of 0.15%), and Immigrants from Oceania (20.7%, a difference of 0.15%).
| Demographics | Rating | Rank | Single Female Poverty |
| Luxembourgers | 84.9 /100 | #148 | Excellent 20.4% |
| Portuguese | 81.5 /100 | #149 | Excellent 20.5% |
| Immigrants | Denmark | 80.5 /100 | #150 | Excellent 20.5% |
| Puget Sound Salish | 79.6 /100 | #151 | Good 20.6% |
| Immigrants | Uruguay | 77.7 /100 | #152 | Good 20.6% |
| Swedes | 77.1 /100 | #153 | Good 20.6% |
| Immigrants | Western Europe | 76.7 /100 | #154 | Good 20.6% |
| Samoans | 76.0 /100 | #155 | Good 20.6% |
| South American Indians | 75.7 /100 | #156 | Good 20.6% |
| Immigrants | Oceania | 74.3 /100 | #157 | Good 20.7% |
| Danes | 73.0 /100 | #158 | Good 20.7% |
| Costa Ricans | 71.8 /100 | #159 | Good 20.7% |
| Arabs | 70.8 /100 | #160 | Good 20.7% |
| Kenyans | 68.5 /100 | #161 | Good 20.8% |
| Northern Europeans | 68.4 /100 | #162 | Good 20.8% |
Demographics Similar to Potawatomi by Single Female Poverty
In terms of single female poverty, the demographic groups most similar to Potawatomi are Aleut (25.4%, a difference of 0.17%), Dominican (25.4%, a difference of 0.18%), Immigrants from Mexico (25.3%, a difference of 0.23%), Immigrants from Dominican Republic (25.3%, a difference of 0.32%), and Central American Indian (25.5%, a difference of 0.33%).
| Demographics | Rating | Rank | Single Female Poverty |
| Blackfeet | 0.0 /100 | #300 | Tragic 25.1% |
| Hondurans | 0.0 /100 | #301 | Tragic 25.1% |
| Shoshone | 0.0 /100 | #302 | Tragic 25.1% |
| Somalis | 0.0 /100 | #303 | Tragic 25.2% |
| Immigrants | Congo | 0.0 /100 | #304 | Tragic 25.3% |
| Immigrants | Dominican Republic | 0.0 /100 | #305 | Tragic 25.3% |
| Immigrants | Mexico | 0.0 /100 | #306 | Tragic 25.3% |
| Potawatomi | 0.0 /100 | #307 | Tragic 25.4% |
| Aleuts | 0.0 /100 | #308 | Tragic 25.4% |
| Dominicans | 0.0 /100 | #309 | Tragic 25.4% |
| Central American Indians | 0.0 /100 | #310 | Tragic 25.5% |
| Immigrants | Honduras | 0.0 /100 | #311 | Tragic 25.5% |
| Paiute | 0.0 /100 | #312 | Tragic 25.5% |
| Comanche | 0.0 /100 | #313 | Tragic 25.6% |
| Cherokee | 0.0 /100 | #314 | Tragic 25.7% |