Chickasaw vs Brazilian Family Poverty
COMPARE
Chickasaw
Brazilian
Family Poverty
Family Poverty Comparison
Chickasaw
Brazilians
10.8%
FAMILY POVERTY
0.2/ 100
METRIC RATING
256th/ 347
METRIC RANK
8.6%
FAMILY POVERTY
80.1/ 100
METRIC RATING
151st/ 347
METRIC RANK
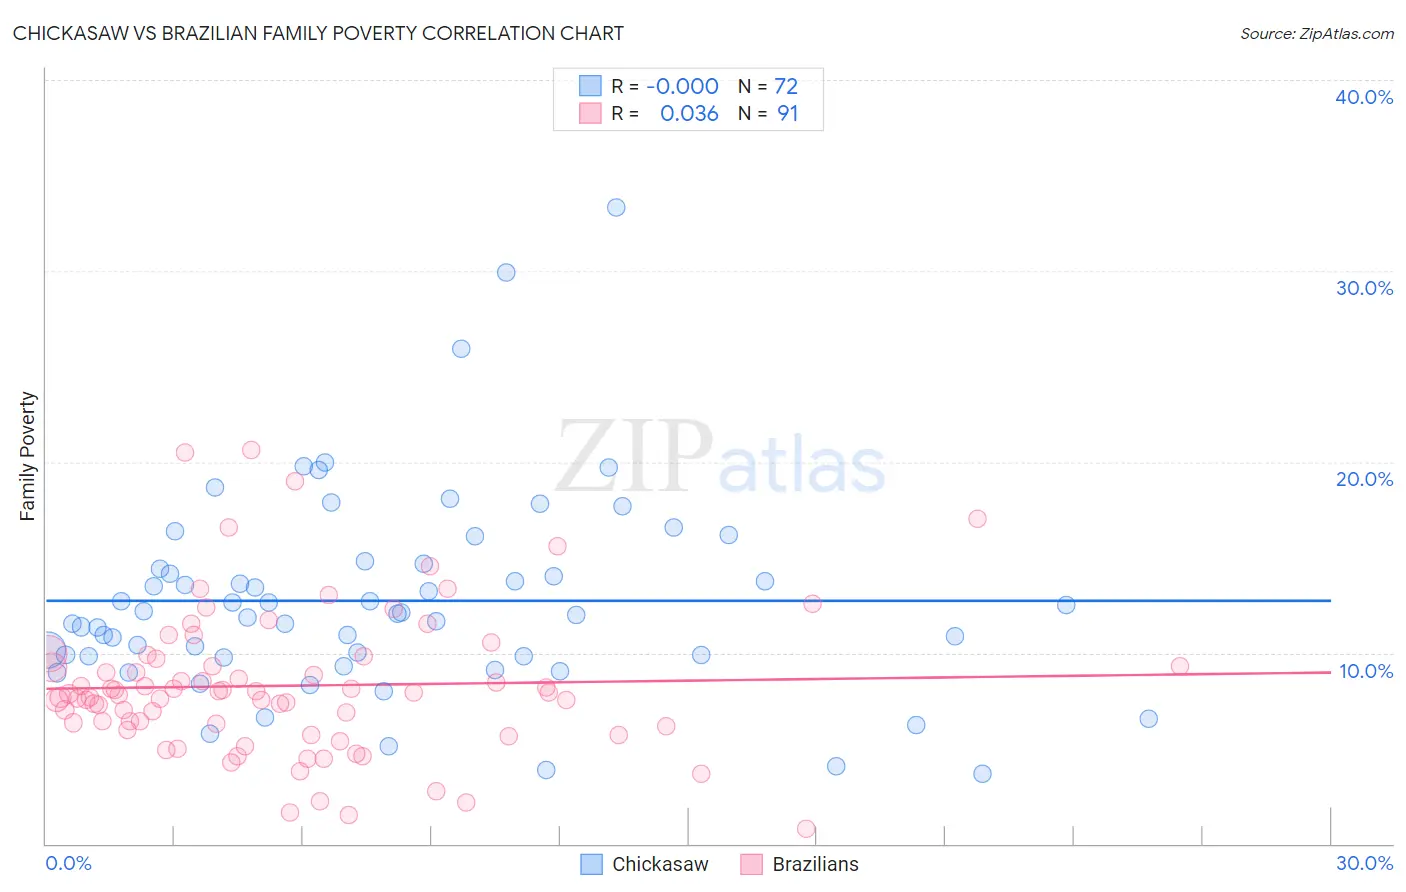
Chickasaw vs Brazilian Family Poverty Correlation Chart
The statistical analysis conducted on geographies consisting of 147,601,652 people shows no correlation between the proportion of Chickasaw and poverty level among families in the United States with a correlation coefficient (R) of -0.000 and weighted average of 10.8%. Similarly, the statistical analysis conducted on geographies consisting of 323,153,944 people shows no correlation between the proportion of Brazilians and poverty level among families in the United States with a correlation coefficient (R) of 0.036 and weighted average of 8.6%, a difference of 26.2%.
Family Poverty Correlation Summary
| Measurement | Chickasaw | Brazilian |
| Minimum | 3.7% | 0.81% |
| Maximum | 33.3% | 20.6% |
| Range | 29.7% | 19.8% |
| Mean | 12.7% | 8.3% |
| Median | 12.0% | 7.9% |
| Interquartile 25% (IQ1) | 9.8% | 6.2% |
| Interquartile 75% (IQ3) | 14.5% | 9.7% |
| Interquartile Range (IQR) | 4.7% | 3.5% |
| Standard Deviation (Sample) | 5.3% | 3.8% |
| Standard Deviation (Population) | 5.2% | 3.8% |
Similar Demographics by Family Poverty
Demographics Similar to Chickasaw by Family Poverty
In terms of family poverty, the demographic groups most similar to Chickasaw are Immigrants from Ghana (10.8%, a difference of 0.040%), Subsaharan African (10.9%, a difference of 0.070%), Mexican American Indian (10.9%, a difference of 0.11%), Immigrants from Liberia (10.8%, a difference of 0.26%), and Bangladeshi (10.9%, a difference of 0.46%).
| Demographics | Rating | Rank | Family Poverty |
| Cubans | 0.4 /100 | #249 | Tragic 10.6% |
| Salvadorans | 0.3 /100 | #250 | Tragic 10.7% |
| Iroquois | 0.3 /100 | #251 | Tragic 10.7% |
| Immigrants | Zaire | 0.3 /100 | #252 | Tragic 10.7% |
| Immigrants | Western Africa | 0.3 /100 | #253 | Tragic 10.7% |
| Ecuadorians | 0.2 /100 | #254 | Tragic 10.8% |
| Immigrants | Liberia | 0.2 /100 | #255 | Tragic 10.8% |
| Chickasaw | 0.2 /100 | #256 | Tragic 10.8% |
| Immigrants | Ghana | 0.2 /100 | #257 | Tragic 10.8% |
| Sub-Saharan Africans | 0.2 /100 | #258 | Tragic 10.9% |
| Mexican American Indians | 0.2 /100 | #259 | Tragic 10.9% |
| Bangladeshis | 0.2 /100 | #260 | Tragic 10.9% |
| Shoshone | 0.2 /100 | #261 | Tragic 10.9% |
| Spanish American Indians | 0.2 /100 | #262 | Tragic 10.9% |
| Cape Verdeans | 0.1 /100 | #263 | Tragic 10.9% |
Demographics Similar to Brazilians by Family Poverty
In terms of family poverty, the demographic groups most similar to Brazilians are Mongolian (8.6%, a difference of 0.050%), Syrian (8.6%, a difference of 0.050%), Samoan (8.6%, a difference of 0.080%), Immigrants from Spain (8.6%, a difference of 0.22%), and Scotch-Irish (8.6%, a difference of 0.45%).
| Demographics | Rating | Rank | Family Poverty |
| Albanians | 83.3 /100 | #144 | Excellent 8.5% |
| Immigrants | South Eastern Asia | 83.2 /100 | #145 | Excellent 8.5% |
| Immigrants | Belarus | 83.2 /100 | #146 | Excellent 8.5% |
| Immigrants | Jordan | 83.0 /100 | #147 | Excellent 8.5% |
| Scotch-Irish | 82.2 /100 | #148 | Excellent 8.6% |
| Mongolians | 80.4 /100 | #149 | Excellent 8.6% |
| Syrians | 80.3 /100 | #150 | Excellent 8.6% |
| Brazilians | 80.1 /100 | #151 | Excellent 8.6% |
| Samoans | 79.8 /100 | #152 | Good 8.6% |
| Immigrants | Spain | 79.1 /100 | #153 | Good 8.6% |
| Immigrants | Vietnam | 75.4 /100 | #154 | Good 8.7% |
| Immigrants | Kuwait | 73.6 /100 | #155 | Good 8.7% |
| Immigrants | Oceania | 71.2 /100 | #156 | Good 8.7% |
| Tsimshian | 69.3 /100 | #157 | Good 8.8% |
| Whites/Caucasians | 69.1 /100 | #158 | Good 8.8% |