Chickasaw vs Brazilian In Labor Force | Age > 16
COMPARE
Chickasaw
Brazilian
In Labor Force | Age > 16
In Labor Force | Age > 16 Comparison
Chickasaw
Brazilians
62.3%
IN LABOR FORCE | AGE > 16
0.0/ 100
METRIC RATING
318th/ 347
METRIC RANK
66.6%
IN LABOR FORCE | AGE > 16
100.0/ 100
METRIC RATING
46th/ 347
METRIC RANK
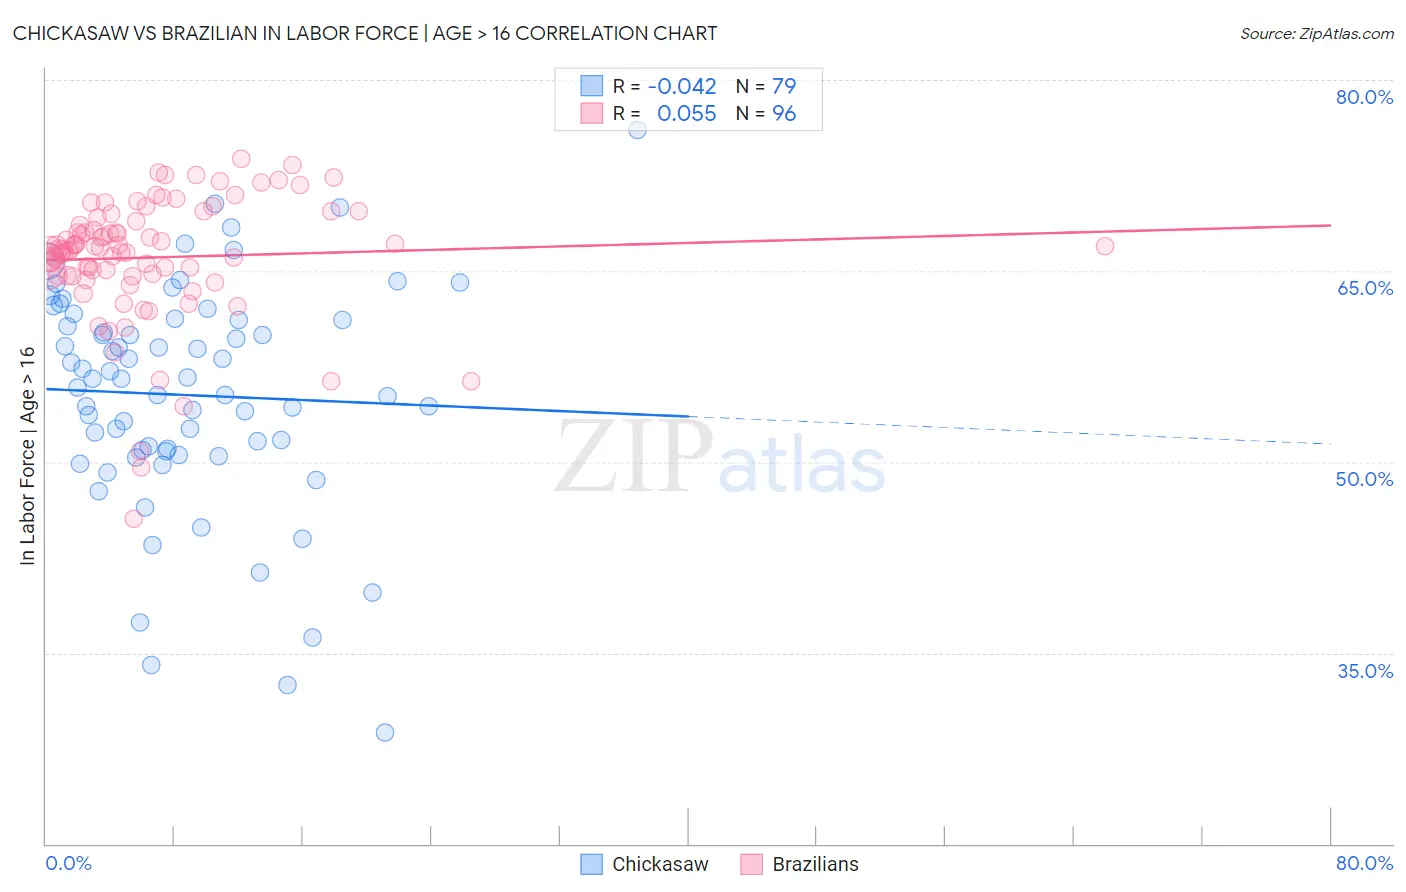
Chickasaw vs Brazilian In Labor Force | Age > 16 Correlation Chart
The statistical analysis conducted on geographies consisting of 147,722,257 people shows no correlation between the proportion of Chickasaw and labor force participation rate among population ages 16 and over in the United States with a correlation coefficient (R) of -0.042 and weighted average of 62.3%. Similarly, the statistical analysis conducted on geographies consisting of 323,965,381 people shows a slight positive correlation between the proportion of Brazilians and labor force participation rate among population ages 16 and over in the United States with a correlation coefficient (R) of 0.055 and weighted average of 66.6%, a difference of 6.9%.
In Labor Force | Age > 16 Correlation Summary
| Measurement | Chickasaw | Brazilian |
| Minimum | 28.7% | 45.5% |
| Maximum | 76.1% | 73.8% |
| Range | 47.4% | 28.3% |
| Mean | 55.2% | 66.1% |
| Median | 56.5% | 66.8% |
| Interquartile 25% (IQ1) | 50.9% | 64.6% |
| Interquartile 75% (IQ3) | 61.1% | 69.1% |
| Interquartile Range (IQR) | 10.2% | 4.5% |
| Standard Deviation (Sample) | 8.9% | 5.0% |
| Standard Deviation (Population) | 8.8% | 4.9% |
Similar Demographics by In Labor Force | Age > 16
Demographics Similar to Chickasaw by In Labor Force | Age > 16
In terms of in labor force | age > 16, the demographic groups most similar to Chickasaw are Kiowa (62.4%, a difference of 0.19%), Arapaho (62.1%, a difference of 0.24%), Yakama (62.1%, a difference of 0.25%), American (62.1%, a difference of 0.28%), and Ottawa (62.0%, a difference of 0.44%).
| Demographics | Rating | Rank | In Labor Force | Age > 16 |
| Blackfeet | 0.0 /100 | #311 | Tragic 63.2% |
| Iroquois | 0.0 /100 | #312 | Tragic 63.2% |
| Chippewa | 0.0 /100 | #313 | Tragic 63.1% |
| Yaqui | 0.0 /100 | #314 | Tragic 63.0% |
| Potawatomi | 0.0 /100 | #315 | Tragic 62.8% |
| Yup'ik | 0.0 /100 | #316 | Tragic 62.7% |
| Kiowa | 0.0 /100 | #317 | Tragic 62.4% |
| Chickasaw | 0.0 /100 | #318 | Tragic 62.3% |
| Arapaho | 0.0 /100 | #319 | Tragic 62.1% |
| Yakama | 0.0 /100 | #320 | Tragic 62.1% |
| Americans | 0.0 /100 | #321 | Tragic 62.1% |
| Ottawa | 0.0 /100 | #322 | Tragic 62.0% |
| Seminole | 0.0 /100 | #323 | Tragic 62.0% |
| Cheyenne | 0.0 /100 | #324 | Tragic 62.0% |
| Cherokee | 0.0 /100 | #325 | Tragic 61.9% |
Demographics Similar to Brazilians by In Labor Force | Age > 16
In terms of in labor force | age > 16, the demographic groups most similar to Brazilians are Immigrants from Bulgaria (66.6%, a difference of 0.0%), Nigerian (66.6%, a difference of 0.010%), Immigrants from Northern Africa (66.6%, a difference of 0.030%), Immigrants from Brazil (66.7%, a difference of 0.070%), and Cape Verdean (66.6%, a difference of 0.080%).
| Demographics | Rating | Rank | In Labor Force | Age > 16 |
| Salvadorans | 100.0 /100 | #39 | Exceptional 66.8% |
| Immigrants | El Salvador | 100.0 /100 | #40 | Exceptional 66.8% |
| Immigrants | Zimbabwe | 100.0 /100 | #41 | Exceptional 66.8% |
| Senegalese | 100.0 /100 | #42 | Exceptional 66.7% |
| Luxembourgers | 100.0 /100 | #43 | Exceptional 66.7% |
| Immigrants | Pakistan | 100.0 /100 | #44 | Exceptional 66.7% |
| Immigrants | Brazil | 100.0 /100 | #45 | Exceptional 66.7% |
| Brazilians | 100.0 /100 | #46 | Exceptional 66.6% |
| Immigrants | Bulgaria | 100.0 /100 | #47 | Exceptional 66.6% |
| Nigerians | 100.0 /100 | #48 | Exceptional 66.6% |
| Immigrants | Northern Africa | 100.0 /100 | #49 | Exceptional 66.6% |
| Cape Verdeans | 100.0 /100 | #50 | Exceptional 66.6% |
| Immigrants | Kuwait | 100.0 /100 | #51 | Exceptional 66.5% |
| Paraguayans | 99.9 /100 | #52 | Exceptional 66.5% |
| Immigrants | Sri Lanka | 99.9 /100 | #53 | Exceptional 66.5% |