Chickasaw vs Immigrants from Nigeria Family Poverty
COMPARE
Chickasaw
Immigrants from Nigeria
Family Poverty
Family Poverty Comparison
Chickasaw
Immigrants from Nigeria
10.8%
FAMILY POVERTY
0.2/ 100
METRIC RATING
256th/ 347
METRIC RANK
10.2%
FAMILY POVERTY
1.9/ 100
METRIC RATING
236th/ 347
METRIC RANK
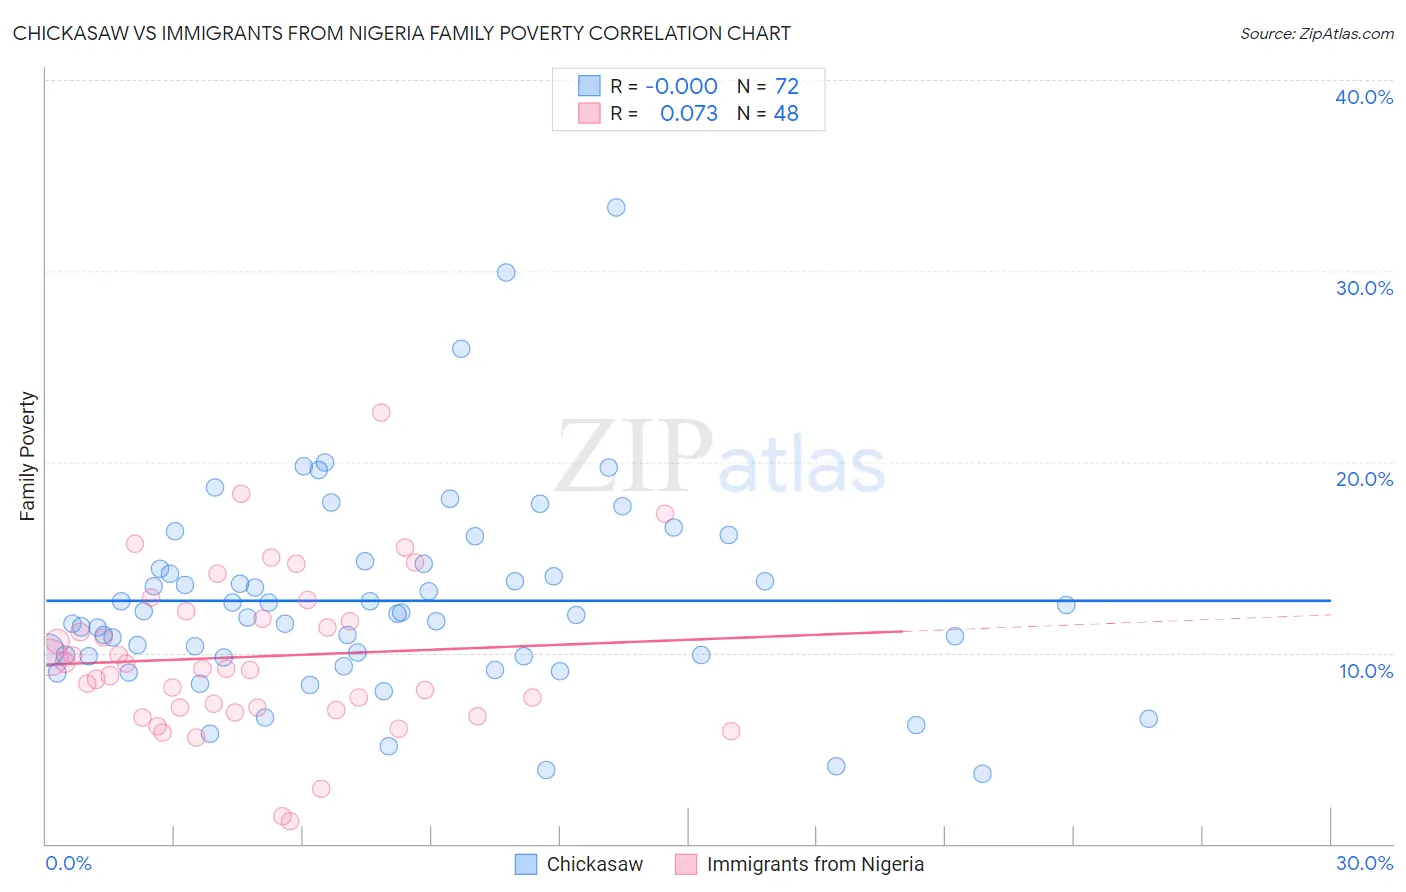
Chickasaw vs Immigrants from Nigeria Family Poverty Correlation Chart
The statistical analysis conducted on geographies consisting of 147,601,652 people shows no correlation between the proportion of Chickasaw and poverty level among families in the United States with a correlation coefficient (R) of -0.000 and weighted average of 10.8%. Similarly, the statistical analysis conducted on geographies consisting of 283,018,314 people shows a slight positive correlation between the proportion of Immigrants from Nigeria and poverty level among families in the United States with a correlation coefficient (R) of 0.073 and weighted average of 10.2%, a difference of 6.6%.
Family Poverty Correlation Summary
| Measurement | Chickasaw | Immigrants from Nigeria |
| Minimum | 3.7% | 1.2% |
| Maximum | 33.3% | 22.6% |
| Range | 29.7% | 21.4% |
| Mean | 12.7% | 9.8% |
| Median | 12.0% | 9.2% |
| Interquartile 25% (IQ1) | 9.8% | 7.1% |
| Interquartile 75% (IQ3) | 14.5% | 12.0% |
| Interquartile Range (IQR) | 4.7% | 4.9% |
| Standard Deviation (Sample) | 5.3% | 4.2% |
| Standard Deviation (Population) | 5.2% | 4.2% |
Demographics Similar to Chickasaw and Immigrants from Nigeria by Family Poverty
In terms of family poverty, the demographic groups most similar to Chickasaw are Immigrants from Liberia (10.8%, a difference of 0.26%), Ecuadorian (10.8%, a difference of 0.64%), Immigrants from Western Africa (10.7%, a difference of 0.94%), Immigrants from Zaire (10.7%, a difference of 1.1%), and Iroquois (10.7%, a difference of 1.2%). Similarly, the demographic groups most similar to Immigrants from Nigeria are Immigrants from Laos (10.2%, a difference of 0.26%), French American Indian (10.2%, a difference of 0.63%), Potawatomi (10.2%, a difference of 0.67%), Immigrants from the Azores (10.3%, a difference of 0.97%), and Ghanaian (10.3%, a difference of 1.1%).
| Demographics | Rating | Rank | Family Poverty |
| Immigrants | Nigeria | 1.9 /100 | #236 | Tragic 10.2% |
| Immigrants | Laos | 1.7 /100 | #237 | Tragic 10.2% |
| French American Indians | 1.5 /100 | #238 | Tragic 10.2% |
| Potawatomi | 1.5 /100 | #239 | Tragic 10.2% |
| Immigrants | Azores | 1.4 /100 | #240 | Tragic 10.3% |
| Ghanaians | 1.3 /100 | #241 | Tragic 10.3% |
| Alaska Natives | 1.0 /100 | #242 | Tragic 10.4% |
| Nepalese | 0.8 /100 | #243 | Tragic 10.4% |
| Cree | 0.7 /100 | #244 | Tragic 10.5% |
| Immigrants | Burma/Myanmar | 0.6 /100 | #245 | Tragic 10.5% |
| Cherokee | 0.5 /100 | #246 | Tragic 10.6% |
| Liberians | 0.4 /100 | #247 | Tragic 10.6% |
| Nicaraguans | 0.4 /100 | #248 | Tragic 10.6% |
| Cubans | 0.4 /100 | #249 | Tragic 10.6% |
| Salvadorans | 0.3 /100 | #250 | Tragic 10.7% |
| Iroquois | 0.3 /100 | #251 | Tragic 10.7% |
| Immigrants | Zaire | 0.3 /100 | #252 | Tragic 10.7% |
| Immigrants | Western Africa | 0.3 /100 | #253 | Tragic 10.7% |
| Ecuadorians | 0.2 /100 | #254 | Tragic 10.8% |
| Immigrants | Liberia | 0.2 /100 | #255 | Tragic 10.8% |
| Chickasaw | 0.2 /100 | #256 | Tragic 10.8% |