Bolivian vs Brazilian Family Poverty
COMPARE
Bolivian
Brazilian
Family Poverty
Family Poverty Comparison
Bolivians
Brazilians
7.5%
FAMILY POVERTY
99.3/ 100
METRIC RATING
38th/ 347
METRIC RANK
8.6%
FAMILY POVERTY
80.1/ 100
METRIC RATING
151st/ 347
METRIC RANK
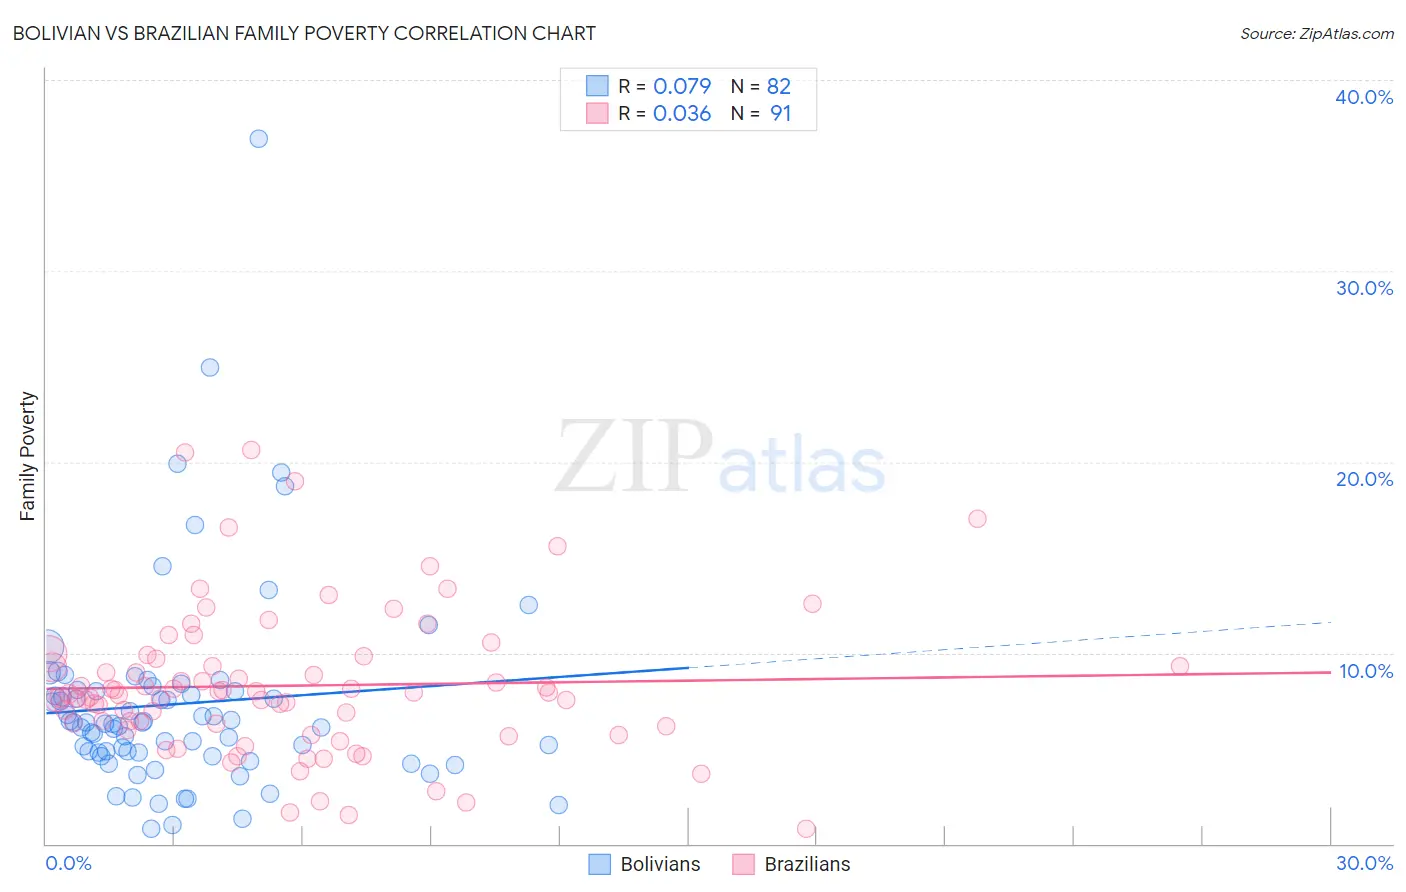
Bolivian vs Brazilian Family Poverty Correlation Chart
The statistical analysis conducted on geographies consisting of 184,453,114 people shows a slight positive correlation between the proportion of Bolivians and poverty level among families in the United States with a correlation coefficient (R) of 0.079 and weighted average of 7.5%. Similarly, the statistical analysis conducted on geographies consisting of 323,153,944 people shows no correlation between the proportion of Brazilians and poverty level among families in the United States with a correlation coefficient (R) of 0.036 and weighted average of 8.6%, a difference of 14.0%.
Family Poverty Correlation Summary
| Measurement | Bolivian | Brazilian |
| Minimum | 0.79% | 0.81% |
| Maximum | 36.9% | 20.6% |
| Range | 36.2% | 19.8% |
| Mean | 7.3% | 8.3% |
| Median | 6.3% | 7.9% |
| Interquartile 25% (IQ1) | 4.8% | 6.2% |
| Interquartile 75% (IQ3) | 8.0% | 9.7% |
| Interquartile Range (IQR) | 3.2% | 3.5% |
| Standard Deviation (Sample) | 5.4% | 3.8% |
| Standard Deviation (Population) | 5.4% | 3.8% |
Similar Demographics by Family Poverty
Demographics Similar to Bolivians by Family Poverty
In terms of family poverty, the demographic groups most similar to Bolivians are Carpatho Rusyn (7.5%, a difference of 0.060%), Slovene (7.5%, a difference of 0.10%), Estonian (7.5%, a difference of 0.24%), Immigrants from Australia (7.6%, a difference of 0.40%), and Turkish (7.5%, a difference of 0.41%).
| Demographics | Rating | Rank | Family Poverty |
| Czechs | 99.6 /100 | #31 | Exceptional 7.4% |
| Poles | 99.5 /100 | #32 | Exceptional 7.4% |
| Immigrants | Japan | 99.5 /100 | #33 | Exceptional 7.4% |
| Russians | 99.5 /100 | #34 | Exceptional 7.5% |
| Greeks | 99.4 /100 | #35 | Exceptional 7.5% |
| Turks | 99.4 /100 | #36 | Exceptional 7.5% |
| Estonians | 99.4 /100 | #37 | Exceptional 7.5% |
| Bolivians | 99.3 /100 | #38 | Exceptional 7.5% |
| Carpatho Rusyns | 99.3 /100 | #39 | Exceptional 7.5% |
| Slovenes | 99.3 /100 | #40 | Exceptional 7.5% |
| Immigrants | Australia | 99.2 /100 | #41 | Exceptional 7.6% |
| Scandinavians | 99.1 /100 | #42 | Exceptional 7.6% |
| Immigrants | Austria | 99.1 /100 | #43 | Exceptional 7.6% |
| Germans | 99.0 /100 | #44 | Exceptional 7.7% |
| Okinawans | 98.9 /100 | #45 | Exceptional 7.7% |
Demographics Similar to Brazilians by Family Poverty
In terms of family poverty, the demographic groups most similar to Brazilians are Mongolian (8.6%, a difference of 0.050%), Syrian (8.6%, a difference of 0.050%), Samoan (8.6%, a difference of 0.080%), Immigrants from Spain (8.6%, a difference of 0.22%), and Scotch-Irish (8.6%, a difference of 0.45%).
| Demographics | Rating | Rank | Family Poverty |
| Albanians | 83.3 /100 | #144 | Excellent 8.5% |
| Immigrants | South Eastern Asia | 83.2 /100 | #145 | Excellent 8.5% |
| Immigrants | Belarus | 83.2 /100 | #146 | Excellent 8.5% |
| Immigrants | Jordan | 83.0 /100 | #147 | Excellent 8.5% |
| Scotch-Irish | 82.2 /100 | #148 | Excellent 8.6% |
| Mongolians | 80.4 /100 | #149 | Excellent 8.6% |
| Syrians | 80.3 /100 | #150 | Excellent 8.6% |
| Brazilians | 80.1 /100 | #151 | Excellent 8.6% |
| Samoans | 79.8 /100 | #152 | Good 8.6% |
| Immigrants | Spain | 79.1 /100 | #153 | Good 8.6% |
| Immigrants | Vietnam | 75.4 /100 | #154 | Good 8.7% |
| Immigrants | Kuwait | 73.6 /100 | #155 | Good 8.7% |
| Immigrants | Oceania | 71.2 /100 | #156 | Good 8.7% |
| Tsimshian | 69.3 /100 | #157 | Good 8.8% |
| Whites/Caucasians | 69.1 /100 | #158 | Good 8.8% |