Norwegian vs Brazilian Family Poverty
COMPARE
Norwegian
Brazilian
Family Poverty
Family Poverty Comparison
Norwegians
Brazilians
6.9%
FAMILY POVERTY
99.9/ 100
METRIC RATING
6th/ 347
METRIC RANK
8.6%
FAMILY POVERTY
80.1/ 100
METRIC RATING
151st/ 347
METRIC RANK
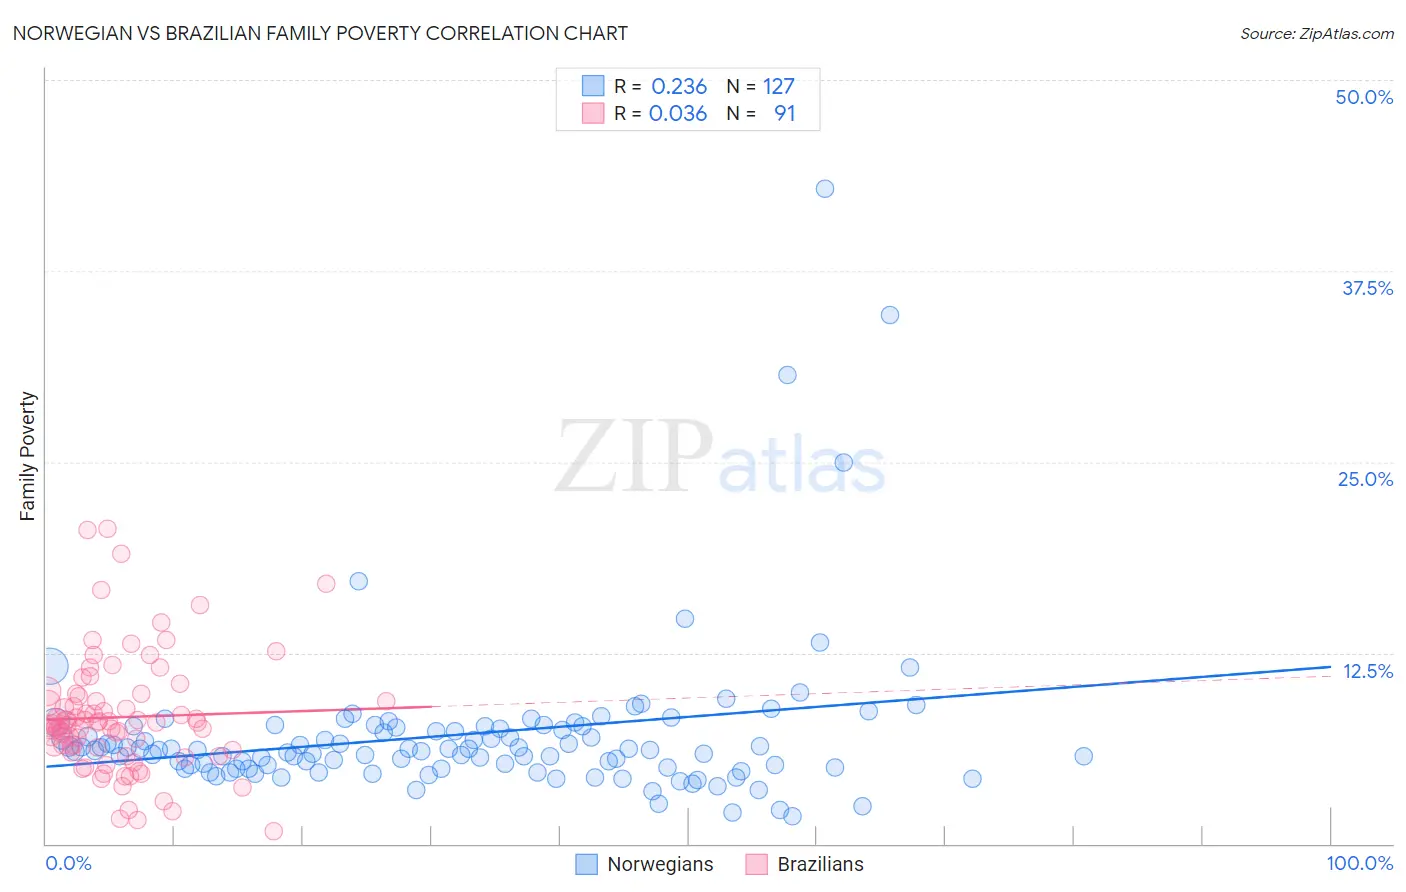
Norwegian vs Brazilian Family Poverty Correlation Chart
The statistical analysis conducted on geographies consisting of 529,824,258 people shows a weak positive correlation between the proportion of Norwegians and poverty level among families in the United States with a correlation coefficient (R) of 0.236 and weighted average of 6.9%. Similarly, the statistical analysis conducted on geographies consisting of 323,153,944 people shows no correlation between the proportion of Brazilians and poverty level among families in the United States with a correlation coefficient (R) of 0.036 and weighted average of 8.6%, a difference of 24.8%.
Family Poverty Correlation Summary
| Measurement | Norwegian | Brazilian |
| Minimum | 1.8% | 0.81% |
| Maximum | 42.9% | 20.6% |
| Range | 41.1% | 19.8% |
| Mean | 7.2% | 8.3% |
| Median | 6.1% | 7.9% |
| Interquartile 25% (IQ1) | 5.0% | 6.2% |
| Interquartile 75% (IQ3) | 7.6% | 9.7% |
| Interquartile Range (IQR) | 2.6% | 3.5% |
| Standard Deviation (Sample) | 5.3% | 3.8% |
| Standard Deviation (Population) | 5.3% | 3.8% |
Similar Demographics by Family Poverty
Demographics Similar to Norwegians by Family Poverty
In terms of family poverty, the demographic groups most similar to Norwegians are Immigrants from Ireland (7.0%, a difference of 1.4%), Bhutanese (7.0%, a difference of 2.3%), Latvian (7.1%, a difference of 2.8%), Bulgarian (7.1%, a difference of 3.0%), and Immigrants from Singapore (7.1%, a difference of 3.0%).
| Demographics | Rating | Rank | Family Poverty |
| Immigrants | India | 100.0 /100 | #1 | Exceptional 6.2% |
| Chinese | 100.0 /100 | #2 | Exceptional 6.5% |
| Immigrants | Taiwan | 100.0 /100 | #3 | Exceptional 6.6% |
| Filipinos | 100.0 /100 | #4 | Exceptional 6.6% |
| Thais | 100.0 /100 | #5 | Exceptional 6.7% |
| Norwegians | 99.9 /100 | #6 | Exceptional 6.9% |
| Immigrants | Ireland | 99.9 /100 | #7 | Exceptional 7.0% |
| Bhutanese | 99.9 /100 | #8 | Exceptional 7.0% |
| Latvians | 99.9 /100 | #9 | Exceptional 7.1% |
| Bulgarians | 99.8 /100 | #10 | Exceptional 7.1% |
| Immigrants | Singapore | 99.8 /100 | #11 | Exceptional 7.1% |
| Maltese | 99.8 /100 | #12 | Exceptional 7.1% |
| Swedes | 99.8 /100 | #13 | Exceptional 7.1% |
| Iranians | 99.8 /100 | #14 | Exceptional 7.1% |
| Lithuanians | 99.8 /100 | #15 | Exceptional 7.2% |
Demographics Similar to Brazilians by Family Poverty
In terms of family poverty, the demographic groups most similar to Brazilians are Mongolian (8.6%, a difference of 0.050%), Syrian (8.6%, a difference of 0.050%), Samoan (8.6%, a difference of 0.080%), Immigrants from Spain (8.6%, a difference of 0.22%), and Scotch-Irish (8.6%, a difference of 0.45%).
| Demographics | Rating | Rank | Family Poverty |
| Albanians | 83.3 /100 | #144 | Excellent 8.5% |
| Immigrants | South Eastern Asia | 83.2 /100 | #145 | Excellent 8.5% |
| Immigrants | Belarus | 83.2 /100 | #146 | Excellent 8.5% |
| Immigrants | Jordan | 83.0 /100 | #147 | Excellent 8.5% |
| Scotch-Irish | 82.2 /100 | #148 | Excellent 8.6% |
| Mongolians | 80.4 /100 | #149 | Excellent 8.6% |
| Syrians | 80.3 /100 | #150 | Excellent 8.6% |
| Brazilians | 80.1 /100 | #151 | Excellent 8.6% |
| Samoans | 79.8 /100 | #152 | Good 8.6% |
| Immigrants | Spain | 79.1 /100 | #153 | Good 8.6% |
| Immigrants | Vietnam | 75.4 /100 | #154 | Good 8.7% |
| Immigrants | Kuwait | 73.6 /100 | #155 | Good 8.7% |
| Immigrants | Oceania | 71.2 /100 | #156 | Good 8.7% |
| Tsimshian | 69.3 /100 | #157 | Good 8.8% |
| Whites/Caucasians | 69.1 /100 | #158 | Good 8.8% |