Mexican vs Brazilian Family Poverty
COMPARE
Mexican
Brazilian
Family Poverty
Family Poverty Comparison
Mexicans
Brazilians
11.8%
FAMILY POVERTY
0.0/ 100
METRIC RATING
305th/ 347
METRIC RANK
8.6%
FAMILY POVERTY
80.1/ 100
METRIC RATING
151st/ 347
METRIC RANK
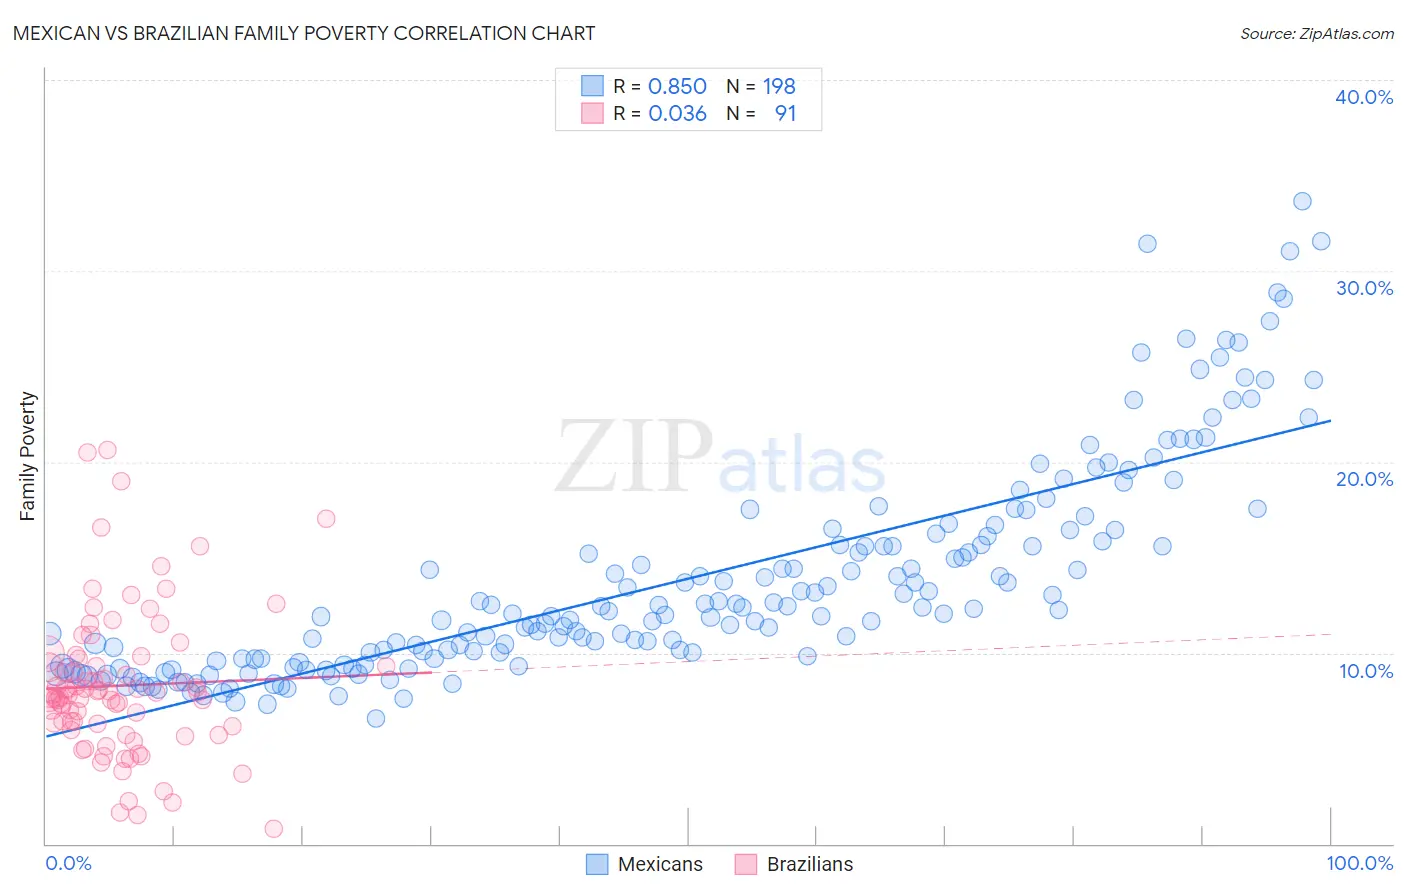
Mexican vs Brazilian Family Poverty Correlation Chart
The statistical analysis conducted on geographies consisting of 561,352,455 people shows a very strong positive correlation between the proportion of Mexicans and poverty level among families in the United States with a correlation coefficient (R) of 0.850 and weighted average of 11.8%. Similarly, the statistical analysis conducted on geographies consisting of 323,153,944 people shows no correlation between the proportion of Brazilians and poverty level among families in the United States with a correlation coefficient (R) of 0.036 and weighted average of 8.6%, a difference of 37.5%.
Family Poverty Correlation Summary
| Measurement | Mexican | Brazilian |
| Minimum | 6.6% | 0.81% |
| Maximum | 33.6% | 20.6% |
| Range | 27.1% | 19.8% |
| Mean | 13.8% | 8.3% |
| Median | 12.1% | 7.9% |
| Interquartile 25% (IQ1) | 9.7% | 6.2% |
| Interquartile 75% (IQ3) | 15.8% | 9.7% |
| Interquartile Range (IQR) | 6.2% | 3.5% |
| Standard Deviation (Sample) | 5.6% | 3.8% |
| Standard Deviation (Population) | 5.6% | 3.8% |
Similar Demographics by Family Poverty
Demographics Similar to Mexicans by Family Poverty
In terms of family poverty, the demographic groups most similar to Mexicans are Immigrants from Latin America (11.8%, a difference of 0.18%), African (11.8%, a difference of 0.37%), Cajun (11.9%, a difference of 0.56%), Immigrants from Congo (11.9%, a difference of 0.67%), and Seminole (11.9%, a difference of 0.73%).
| Demographics | Rating | Rank | Family Poverty |
| Immigrants | Senegal | 0.0 /100 | #298 | Tragic 11.7% |
| Dutch West Indians | 0.0 /100 | #299 | Tragic 11.7% |
| Immigrants | Bangladesh | 0.0 /100 | #300 | Tragic 11.7% |
| Bahamians | 0.0 /100 | #301 | Tragic 11.7% |
| Guatemalans | 0.0 /100 | #302 | Tragic 11.7% |
| Africans | 0.0 /100 | #303 | Tragic 11.8% |
| Immigrants | Latin America | 0.0 /100 | #304 | Tragic 11.8% |
| Mexicans | 0.0 /100 | #305 | Tragic 11.8% |
| Cajuns | 0.0 /100 | #306 | Tragic 11.9% |
| Immigrants | Congo | 0.0 /100 | #307 | Tragic 11.9% |
| Seminole | 0.0 /100 | #308 | Tragic 11.9% |
| Hispanics or Latinos | 0.0 /100 | #309 | Tragic 12.0% |
| Immigrants | Guatemala | 0.0 /100 | #310 | Tragic 12.0% |
| Ute | 0.0 /100 | #311 | Tragic 12.1% |
| Immigrants | Central America | 0.0 /100 | #312 | Tragic 12.1% |
Demographics Similar to Brazilians by Family Poverty
In terms of family poverty, the demographic groups most similar to Brazilians are Mongolian (8.6%, a difference of 0.050%), Syrian (8.6%, a difference of 0.050%), Samoan (8.6%, a difference of 0.080%), Immigrants from Spain (8.6%, a difference of 0.22%), and Scotch-Irish (8.6%, a difference of 0.45%).
| Demographics | Rating | Rank | Family Poverty |
| Albanians | 83.3 /100 | #144 | Excellent 8.5% |
| Immigrants | South Eastern Asia | 83.2 /100 | #145 | Excellent 8.5% |
| Immigrants | Belarus | 83.2 /100 | #146 | Excellent 8.5% |
| Immigrants | Jordan | 83.0 /100 | #147 | Excellent 8.5% |
| Scotch-Irish | 82.2 /100 | #148 | Excellent 8.6% |
| Mongolians | 80.4 /100 | #149 | Excellent 8.6% |
| Syrians | 80.3 /100 | #150 | Excellent 8.6% |
| Brazilians | 80.1 /100 | #151 | Excellent 8.6% |
| Samoans | 79.8 /100 | #152 | Good 8.6% |
| Immigrants | Spain | 79.1 /100 | #153 | Good 8.6% |
| Immigrants | Vietnam | 75.4 /100 | #154 | Good 8.7% |
| Immigrants | Kuwait | 73.6 /100 | #155 | Good 8.7% |
| Immigrants | Oceania | 71.2 /100 | #156 | Good 8.7% |
| Tsimshian | 69.3 /100 | #157 | Good 8.8% |
| Whites/Caucasians | 69.1 /100 | #158 | Good 8.8% |