Chickasaw vs Brazilian Cognitive Disability
COMPARE
Chickasaw
Brazilian
Cognitive Disability
Cognitive Disability Comparison
Chickasaw
Brazilians
18.5%
COGNITIVE DISABILITY
0.0/ 100
METRIC RATING
312th/ 347
METRIC RANK
17.1%
COGNITIVE DISABILITY
78.9/ 100
METRIC RATING
155th/ 347
METRIC RANK
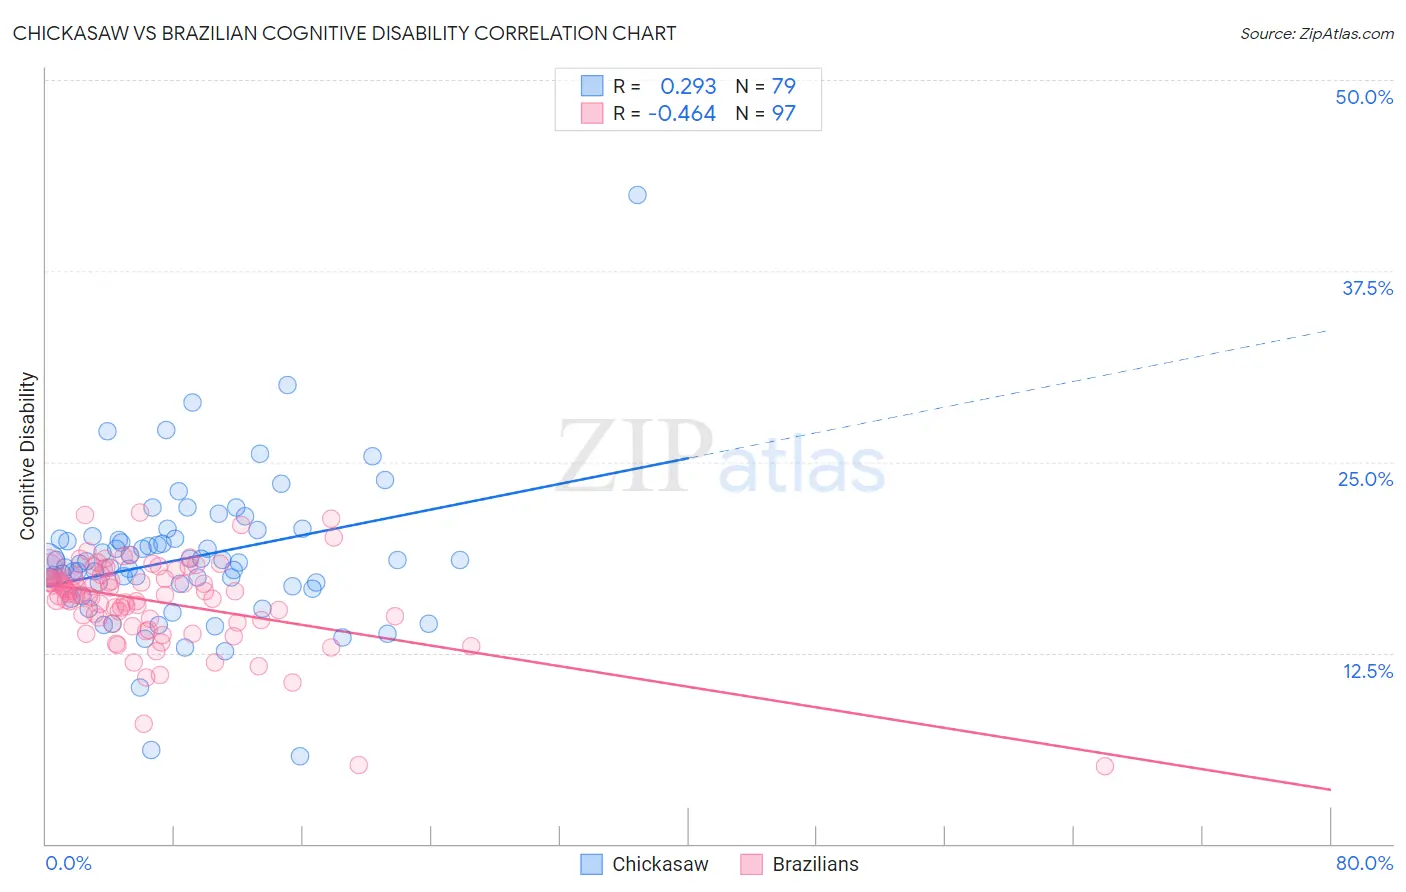
Chickasaw vs Brazilian Cognitive Disability Correlation Chart
The statistical analysis conducted on geographies consisting of 147,689,565 people shows a weak positive correlation between the proportion of Chickasaw and percentage of population with cognitive disability in the United States with a correlation coefficient (R) of 0.293 and weighted average of 18.5%. Similarly, the statistical analysis conducted on geographies consisting of 323,952,153 people shows a moderate negative correlation between the proportion of Brazilians and percentage of population with cognitive disability in the United States with a correlation coefficient (R) of -0.464 and weighted average of 17.1%, a difference of 8.1%.
Cognitive Disability Correlation Summary
| Measurement | Chickasaw | Brazilian |
| Minimum | 5.7% | 5.1% |
| Maximum | 42.5% | 21.7% |
| Range | 36.8% | 16.6% |
| Mean | 18.7% | 15.9% |
| Median | 18.5% | 16.3% |
| Interquartile 25% (IQ1) | 16.9% | 14.6% |
| Interquartile 75% (IQ3) | 20.0% | 17.5% |
| Interquartile Range (IQR) | 3.1% | 2.9% |
| Standard Deviation (Sample) | 4.9% | 2.9% |
| Standard Deviation (Population) | 4.9% | 2.9% |
Similar Demographics by Cognitive Disability
Demographics Similar to Chickasaw by Cognitive Disability
In terms of cognitive disability, the demographic groups most similar to Chickasaw are Yaqui (18.5%, a difference of 0.11%), Subsaharan African (18.5%, a difference of 0.17%), Hmong (18.4%, a difference of 0.29%), Choctaw (18.4%, a difference of 0.31%), and Immigrants from Dominica (18.6%, a difference of 0.35%).
| Demographics | Rating | Rank | Cognitive Disability |
| Colville | 0.0 /100 | #305 | Tragic 18.3% |
| Seminole | 0.0 /100 | #306 | Tragic 18.3% |
| Ugandans | 0.0 /100 | #307 | Tragic 18.3% |
| Immigrants | Western Africa | 0.0 /100 | #308 | Tragic 18.4% |
| Immigrants | Eastern Africa | 0.0 /100 | #309 | Tragic 18.4% |
| Choctaw | 0.0 /100 | #310 | Tragic 18.4% |
| Hmong | 0.0 /100 | #311 | Tragic 18.4% |
| Chickasaw | 0.0 /100 | #312 | Tragic 18.5% |
| Yaqui | 0.0 /100 | #313 | Tragic 18.5% |
| Sub-Saharan Africans | 0.0 /100 | #314 | Tragic 18.5% |
| Immigrants | Dominica | 0.0 /100 | #315 | Tragic 18.6% |
| Immigrants | Middle Africa | 0.0 /100 | #316 | Tragic 18.6% |
| Liberians | 0.0 /100 | #317 | Tragic 18.6% |
| Bangladeshis | 0.0 /100 | #318 | Tragic 18.6% |
| Comanche | 0.0 /100 | #319 | Tragic 18.6% |
Demographics Similar to Brazilians by Cognitive Disability
In terms of cognitive disability, the demographic groups most similar to Brazilians are Sri Lankan (17.1%, a difference of 0.0%), Immigrants from Malaysia (17.1%, a difference of 0.020%), Immigrants from Kazakhstan (17.1%, a difference of 0.070%), Immigrants from Australia (17.1%, a difference of 0.12%), and Immigrants from Indonesia (17.1%, a difference of 0.17%).
| Demographics | Rating | Rank | Cognitive Disability |
| French Canadians | 85.7 /100 | #148 | Excellent 17.1% |
| Cypriots | 85.7 /100 | #149 | Excellent 17.1% |
| Basques | 85.5 /100 | #150 | Excellent 17.1% |
| Syrians | 83.0 /100 | #151 | Excellent 17.1% |
| Immigrants | Indonesia | 82.7 /100 | #152 | Excellent 17.1% |
| Immigrants | Kazakhstan | 80.5 /100 | #153 | Excellent 17.1% |
| Immigrants | Malaysia | 79.3 /100 | #154 | Good 17.1% |
| Brazilians | 78.9 /100 | #155 | Good 17.1% |
| Sri Lankans | 78.9 /100 | #156 | Good 17.1% |
| Immigrants | Australia | 76.0 /100 | #157 | Good 17.1% |
| Celtics | 74.1 /100 | #158 | Good 17.1% |
| Immigrants | Latvia | 73.2 /100 | #159 | Good 17.2% |
| Australians | 72.4 /100 | #160 | Good 17.2% |
| Americans | 72.2 /100 | #161 | Good 17.2% |
| Yugoslavians | 71.6 /100 | #162 | Good 17.2% |