Zip Codes with the Highest Percentage of Households Residing in Detached Homes in Akron, OH
RELATED REPORTS & OPTIONS
Detached Home Residency
Akron
Compare Zip Codes
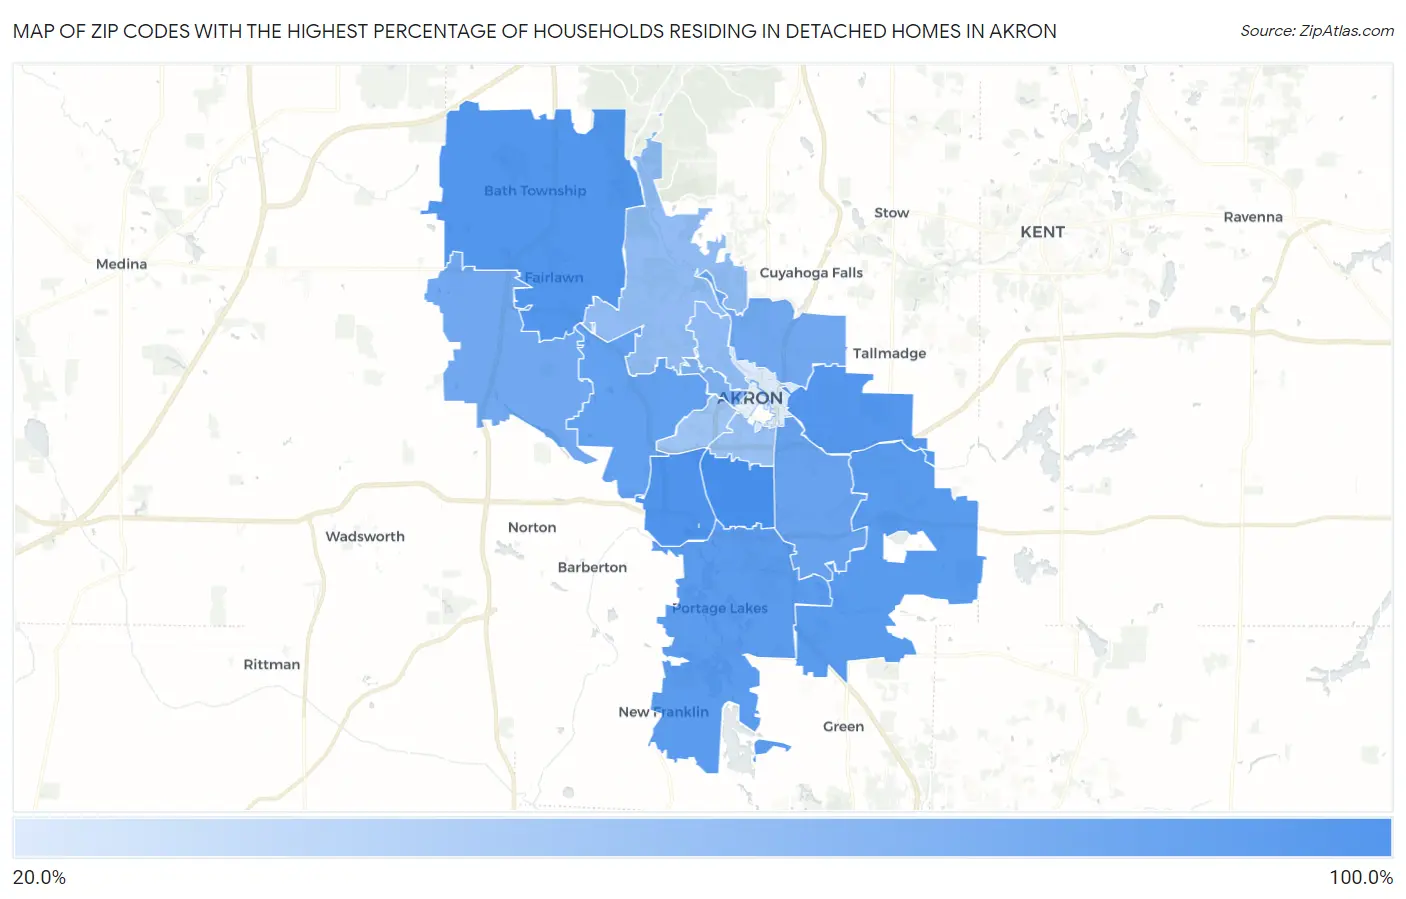
Map of Zip Codes with the Highest Percentage of Households Residing in Detached Homes in Akron
21.7%
87.5%
Zip Codes with the Highest Percentage of Households Residing in Detached Homes in Akron, OH
| Zip Code | Detached Home Residency | vs State | vs National | |
| 1. | 44301 | 87.5% | 70.5%(+17.0)#365 | 62.5%(+25.0)#8,282 |
| 2. | 44314 | 83.5% | 70.5%(+13.0)#510 | 62.5%(+21.0)#11,386 |
| 3. | 44333 | 81.6% | 70.5%(+11.1)#580 | 62.5%(+19.1)#12,913 |
| 4. | 44305 | 80.2% | 70.5%(+9.70)#634 | 62.5%(+17.7)#14,035 |
| 5. | 44312 | 79.5% | 70.5%(+9.00)#652 | 62.5%(+17.0)#14,581 |
| 6. | 44319 | 78.0% | 70.5%(+7.50)#705 | 62.5%(+15.5)#15,781 |
| 7. | 44320 | 73.1% | 70.5%(+2.60)#859 | 62.5%(+10.6)#19,516 |
| 8. | 44306 | 70.4% | 70.5%(-0.100)#933 | 62.5%(+7.90)#21,393 |
| 9. | 44310 | 66.7% | 70.5%(-3.80)#995 | 62.5%(+4.20)#23,542 |
| 10. | 44321 | 66.7% | 70.5%(-3.80)#996 | 62.5%(+4.20)#23,548 |
| 11. | 44302 | 59.4% | 70.5%(-11.1)#1,084 | 62.5%(-3.10)#26,687 |
| 12. | 44303 | 52.4% | 70.5%(-18.1)#1,130 | 62.5%(-10.1)#28,683 |
| 13. | 44313 | 51.4% | 70.5%(-19.1)#1,135 | 62.5%(-11.1)#28,890 |
| 14. | 44311 | 48.3% | 70.5%(-22.2)#1,146 | 62.5%(-14.2)#29,448 |
| 15. | 44307 | 46.0% | 70.5%(-24.5)#1,154 | 62.5%(-16.5)#29,799 |
| 16. | 44304 | 21.7% | 70.5%(-48.8)#1,192 | 62.5%(-40.8)#31,696 |
1
Common Questions
What are the Top 10 Zip Codes with the Highest Percentage of Households Residing in Detached Homes in Akron, OH?
Top 10 Zip Codes with the Highest Percentage of Households Residing in Detached Homes in Akron, OH are:
What zip code has the Highest Percentage of Households Residing in Detached Homes in Akron, OH?
44301 has the Highest Percentage of Households Residing in Detached Homes in Akron, OH with 87.5%.
What is the Percentage of Households Residing in Detached Homes in Akron, OH?
Percentage of Households Residing in Detached Homes in Akron is 67.6%.
What is the Percentage of Households Residing in Detached Homes in Ohio?
Percentage of Households Residing in Detached Homes in Ohio is 70.5%.
What is the Percentage of Households Residing in Detached Homes in the United States?
Percentage of Households Residing in Detached Homes in the United States is 62.5%.