Zip Codes with the Highest Percentage of Households Without a Vehicle in Akron, OH
RELATED REPORTS & OPTIONS
Households without a Cars
Akron
Compare Zip Codes
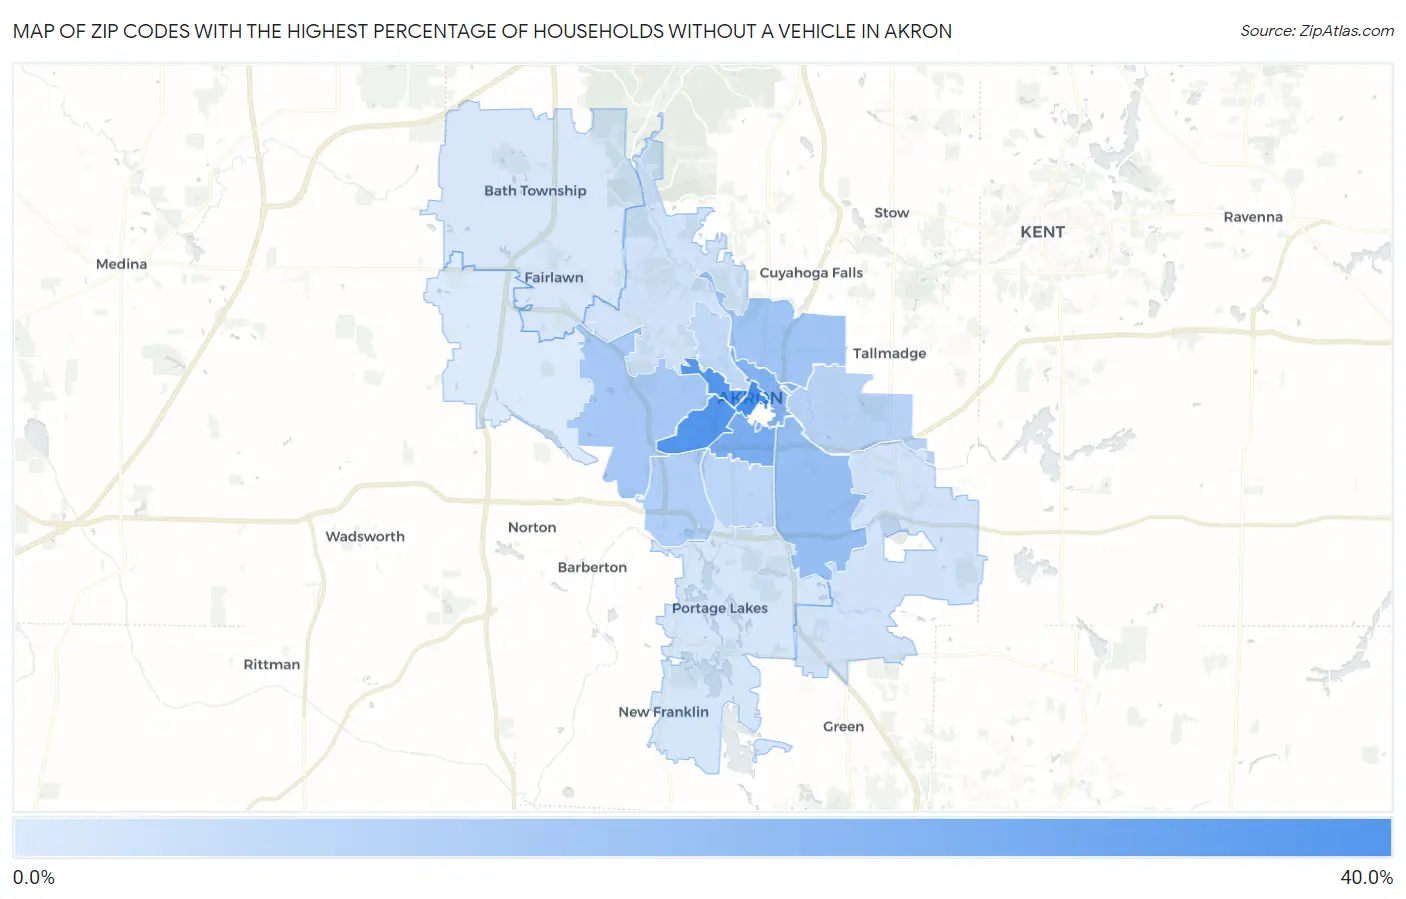
Map of Zip Codes with the Highest Percentage of Households Without a Vehicle in Akron
3.5%
36.0%
Zip Codes with the Highest Percentage of Households Without a Vehicle in Akron, OH
| Zip Code | Housholds Without a Car | vs State | vs National | |
| 1. | 44308 | 36.0% | 7.4%(+28.6)#19 | 8.3%(+27.7)#615 |
| 2. | 44307 | 32.9% | 7.4%(+25.5)#25 | 8.3%(+24.6)#699 |
| 3. | 44302 | 32.6% | 7.4%(+25.2)#27 | 8.3%(+24.3)#707 |
| 4. | 44311 | 23.8% | 7.4%(+16.4)#51 | 8.3%(+15.5)#1,152 |
| 5. | 44304 | 21.9% | 7.4%(+14.5)#59 | 8.3%(+13.6)#1,309 |
| 6. | 44306 | 17.8% | 7.4%(+10.4)#78 | 8.3%(+9.50)#1,813 |
| 7. | 44310 | 15.4% | 7.4%(+8.00)#109 | 8.3%(+7.10)#2,274 |
| 8. | 44320 | 14.7% | 7.4%(+7.30)#119 | 8.3%(+6.40)#2,473 |
| 9. | 44314 | 11.9% | 7.4%(+4.50)#167 | 8.3%(+3.60)#3,611 |
| 10. | 44305 | 10.8% | 7.4%(+3.40)#193 | 8.3%(+2.50)#4,252 |
| 11. | 44301 | 9.7% | 7.4%(+2.30)#227 | 8.3%(+1.40)#5,117 |
| 12. | 44303 | 8.7% | 7.4%(+1.30)#264 | 8.3%(+0.400)#6,099 |
| 13. | 44312 | 5.7% | 7.4%(-1.70)#434 | 8.3%(-2.60)#11,125 |
| 14. | 44313 | 5.6% | 7.4%(-1.80)#443 | 8.3%(-2.70)#11,373 |
| 15. | 44319 | 4.6% | 7.4%(-2.80)#546 | 8.3%(-3.70)#13,942 |
| 16. | 44333 | 4.2% | 7.4%(-3.20)#599 | 8.3%(-4.10)#15,156 |
| 17. | 44321 | 3.5% | 7.4%(-3.90)#696 | 8.3%(-4.80)#17,376 |
1
Common Questions
What are the Top 10 Zip Codes with the Highest Percentage of Households Without a Vehicle in Akron, OH?
Top 10 Zip Codes with the Highest Percentage of Households Without a Vehicle in Akron, OH are:
What zip code has the Highest Percentage of Households Without a Vehicle in Akron, OH?
44308 has the Highest Percentage of Households Without a Vehicle in Akron, OH with 36.0%.
What is the Percentage of Households Without a Vehicle in Akron, OH?
Percentage of Households Without a Vehicle in Akron is 13.6%.
What is the Percentage of Households Without a Vehicle in Ohio?
Percentage of Households Without a Vehicle in Ohio is 7.4%.
What is the Percentage of Households Without a Vehicle in the United States?
Percentage of Households Without a Vehicle in the United States is 8.3%.