Zip Codes with the Largest Burmese Community in Akron, OH

RELATED REPORTS & OPTIONS

Burmese
Population
Families and Households
Female Fertility
Female Fertility (Unmarried)
Race (Community Size)
Race (Percentage)
Ancestry (Community Size)
AfghanAfricanAmericanApacheArabArmenianAustrianBangladeshiBelgianBelizeanBhutaneseBlackfeetBrazilianBritishBurmeseCajunCanadianCelticCentral AmericanCentral American IndianCherokeeChippewaChoctawColombianCreekCroatianCubanCzechCzechoslovakianDanishDelawareDominicanDutchEastern EuropeanEcuadorianEgyptianEnglishEuropeanFinnishFrenchFrench CanadianGermanGhanaianGreekGuamanian / ChamorroGuatemalanHaitianHonduranHungarianIndian (Asian)IndonesianIranianIrishIroquoisItalianJamaicanJapaneseJordanianKenyanKoreanLebaneseLiberianLithuanianMacedonianMalaysianMexicanMexican American IndianMoroccanNative HawaiianNavajoNicaraguanNigerianNorthern EuropeanNorwegianPakistaniPalestinianPanamanianPennsylvania GermanPeruvianPolishPortuguesePuerto RicanRomanianRussianSamoanScandinavianScotch-IrishScottishSerbianSiouxSlavicSlovakSloveneSouth AmericanSpaniardSpanishSri LankanSubsaharan AfricanSwedishSwissSyrianThaiTurkishUkrainianWelshWest IndianYugoslavian
Ancestry (Percentage)
AfghanAfricanAmericanApacheArabArmenianAustrianBangladeshiBelgianBelizeanBhutaneseBlackfeetBrazilianBritishBurmeseCajunCanadianCelticCentral AmericanCentral American IndianCherokeeChippewaChoctawColombianCreekCroatianCubanCzechCzechoslovakianDanishDelawareDominicanDutchEastern EuropeanEcuadorianEgyptianEnglishEuropeanFinnishFrenchFrench CanadianGermanGhanaianGreekGuamanian / ChamorroGuatemalanHaitianHonduranHungarianIndian (Asian)IndonesianIranianIrishIroquoisItalianJamaicanJapaneseJordanianKenyanKoreanLebaneseLiberianLithuanianMacedonianMalaysianMexicanMexican American IndianMoroccanNative HawaiianNavajoNicaraguanNigerianNorthern EuropeanNorwegianPakistaniPalestinianPanamanianPennsylvania GermanPeruvianPolishPortuguesePuerto RicanRomanianRussianSamoanScandinavianScotch-IrishScottishSerbianSiouxSlavicSlovakSloveneSouth AmericanSpaniardSpanishSri LankanSubsaharan AfricanSwedishSwissSyrianThaiTurkishUkrainianWelshWest IndianYugoslavian
Immigrant Origin (Total)
Immigrant Origin (Percentage)
Income
Income (Families)
Income (Households)
Poverty
Poverty (Families)
Unemployment
Employment Occupations
Employment Industries
Employer Class
Commute Time
Commute Means
School Enrollment
Education by Degree Field
Occupancy
Finances
Physical Characteristics
Akron
Compare Zip Codes
Comparison Subject

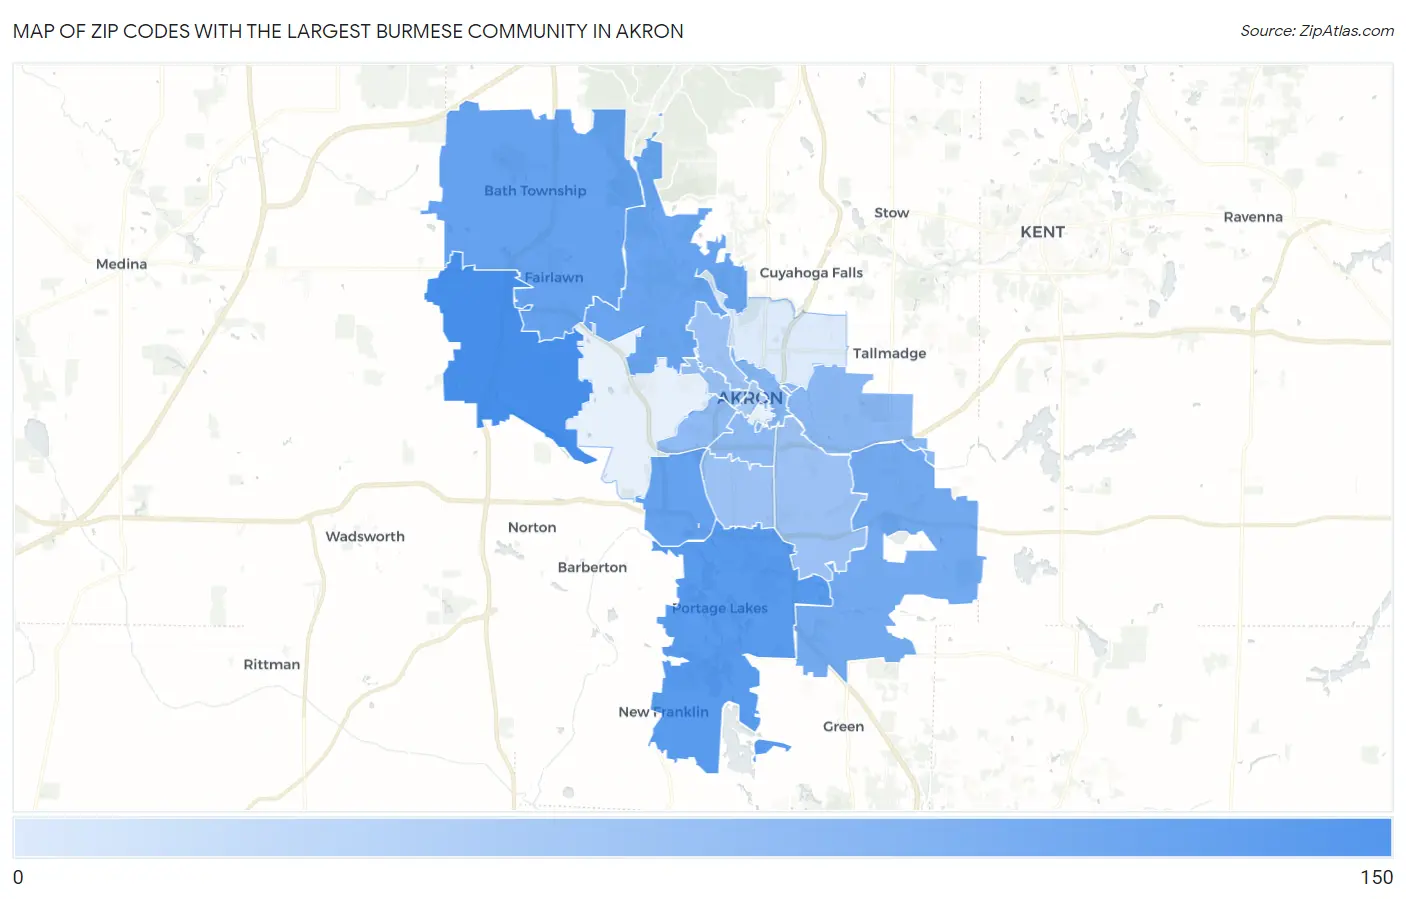
Map of Zip Codes with the Largest Burmese Community in Akron

0
150
Zip Codes with the Largest Burmese Community in Akron Map

Zip Codes with the Largest Burmese Community in Akron, OH

Zip Code Burmese vs State vs National
1.4432113226,343(0.50%)#521,977,441(0.01%)#3,271
2.443198426,343(0.32%)#991,977,441(0.00%)#4,408
3.443335726,343(0.22%)#1321,977,441(0.00%)#5,434
4.443145726,343(0.22%)#1331,977,441(0.00%)#5,438
5.443134826,343(0.18%)#1481,977,441(0.00%)#5,859
6.443123726,343(0.14%)#1731,977,441(0.00%)#6,494
7.443042226,343(0.08%)#2341,977,441(0.00%)#7,814
8.443052026,343(0.08%)#2401,977,441(0.00%)#7,945
9.443111726,343(0.06%)#2651,977,441(0.00%)#8,396
10.443071726,343(0.06%)#2661,977,441(0.00%)#8,406
11.443021326,343(0.05%)#2971,977,441(0.00%)#8,972
12.443061226,343(0.05%)#3001,977,441(0.00%)#9,058
13.443011226,343(0.05%)#3031,977,441(0.00%)#9,088
14.443031126,343(0.04%)#3171,977,441(0.00%)#9,295
15.44308826,343(0.03%)#3431,977,441(0.00%)#9,977
16.44310126,343(0.00%)#3861,977,441(0.00%)#11,580

Common Questions

What are the Top 10 Zip Codes with the Largest Burmese Community in Akron, OH?
Top 10 Zip Codes with the Largest Burmese Community in Akron, OH are:
#1
132
#2
84
#3
57
#4
57
#5
48
#6
37
#7
22
#8
20
#9
17
#10
17
What zip code has the Largest Burmese Community in Akron, OH?
44321 has the Largest Burmese Community in Akron, OH with 132.
What is the Total Burmese Population in Akron, OH?
Total Burmese Population in Akron is 306.
What is the Total Burmese Population in Ohio?
Total Burmese Population in Ohio is 26,343.
What is the Total Burmese Population in the United States?
Total Burmese Population in the United States is 1,977,441.