Zip Codes with the Highest Percentage of Population with a Degree in Literature and Languages in Reno, NV

RELATED REPORTS & OPTIONS

Literature and Languages
Population
Families and Households
Female Fertility
Female Fertility (Unmarried)
Race (Community Size)
Race (Percentage)
Ancestry (Community Size)
AfricanAlaskan AthabascanAmericanApacheArabArapahoArgentineanArmenianAssyrian / Chaldean / SyriacAustralianAustrianBangladeshiBasqueBelgianBelizeanBhutaneseBlackfeetBolivianBrazilianBritishBulgarianBurmeseCanadianCarpatho RusynCelticCentral AmericanCentral American IndianCherokeeChickasawChileanChippewaChoctawColombianColvilleCosta RicanCreeCreekCroatianCrowCubanCzechCzechoslovakianDanishDominicanDutchEastern EuropeanEcuadorianEgyptianEnglishEstonianEthiopianEuropeanFijianFilipinoFinnishFrenchFrench American IndianFrench CanadianGermanGerman RussianGreekGuamanian / ChamorroGuatemalanHaitianHonduranHungarianIcelanderIndian (Asian)InupiatIranianIraqiIrishIroquoisIsraeliItalianJamaicanJapaneseKenyanKoreanLaotianLatvianLebaneseLiberianLithuanianLuxembourgerMacedonianMalaysianMalteseMexicanMexican American IndianMoroccanNative HawaiianNavajoNew ZealanderNicaraguanNigerianNorthern EuropeanNorwegianOsagePaiutePakistaniPanamanianPennsylvania GermanPeruvianPimaPolishPortuguesePotawatomiPuebloPuerto RicanRomanianRussianSalvadoranSamoanScandinavianScotch-IrishScottishSerbianShoshoneSiouxSlavicSlovakSloveneSouth AmericanSouth American IndianSpaniardSpanishSpanish AmericanSri LankanSubsaharan AfricanSwedishSwissSyrianThaiTonganTrinidadian and TobagonianTurkishUkrainianVenezuelanVietnameseWelshYugoslavianYuman
Ancestry (Percentage)
AfricanAlaskan AthabascanAmericanApacheArabArapahoArgentineanArmenianAssyrian / Chaldean / SyriacAustralianAustrianBangladeshiBasqueBelgianBelizeanBhutaneseBlackfeetBolivianBrazilianBritishBulgarianBurmeseCanadianCarpatho RusynCelticCentral AmericanCentral American IndianCherokeeChickasawChileanChippewaChoctawColombianColvilleCosta RicanCreeCreekCroatianCrowCubanCzechCzechoslovakianDanishDominicanDutchEastern EuropeanEcuadorianEgyptianEnglishEstonianEthiopianEuropeanFijianFilipinoFinnishFrenchFrench American IndianFrench CanadianGermanGerman RussianGreekGuamanian / ChamorroGuatemalanHaitianHonduranHungarianIcelanderIndian (Asian)InupiatIranianIraqiIrishIroquoisIsraeliItalianJamaicanJapaneseKenyanKoreanLaotianLatvianLebaneseLiberianLithuanianLuxembourgerMacedonianMalaysianMalteseMexicanMexican American IndianMoroccanNative HawaiianNavajoNew ZealanderNicaraguanNigerianNorthern EuropeanNorwegianOsagePaiutePakistaniPanamanianPennsylvania GermanPeruvianPimaPolishPortuguesePotawatomiPuebloPuerto RicanRomanianRussianSalvadoranSamoanScandinavianScotch-IrishScottishSerbianShoshoneSiouxSlavicSlovakSloveneSouth AmericanSouth American IndianSpaniardSpanishSpanish AmericanSri LankanSubsaharan AfricanSwedishSwissSyrianThaiTonganTrinidadian and TobagonianTurkishUkrainianVenezuelanVietnameseWelshYugoslavianYuman
Immigrant Origin (Total)
AfghanistanAfricaArgentinaAsiaAustraliaAustriaBangladeshBoliviaBosnia and HerzegovinaBrazilBulgariaCambodiaCameroonCanadaCaribbeanCentral AmericaChileChinaColombiaCosta RicaCroatiaCubaCzechoslovakiaDenmarkEastern AfricaEastern AsiaEastern EuropeEcuadorEgyptEl SalvadorEnglandEthiopiaEuropeFranceGermanyGreeceGuatemalaHaitiHondurasHong KongHungaryIndiaIndonesiaIranIrelandIsraelItalyJamaicaJapanKenyaKoreaKuwaitLatin AmericaLebanonLithuaniaMalaysiaMexicoMicronesiaMiddle AfricaNetherlandsNicaraguaNigeriaNorthern AfricaNorthern EuropeNorwayOceaniaPakistanPanamaPeruPhilippinesPolandPortugalRomaniaRussiaSaudi ArabiaScotlandSerbiaSingaporeSouth AfricaSouth AmericaSouth Central AsiaSouth Eastern AsiaSouthern EuropeSpainSwitzerlandSyriaTaiwanThailandTrinidad and TobagoUkraineVenezuelaVietnamWestern AfricaWestern AsiaWestern Europe
Immigrant Origin (Percentage)
AfghanistanAfricaArgentinaAsiaAustraliaAustriaBangladeshBoliviaBosnia and HerzegovinaBrazilBulgariaCambodiaCameroonCanadaCaribbeanCentral AmericaChileChinaColombiaCosta RicaCroatiaCubaCzechoslovakiaDenmarkEastern AfricaEastern AsiaEastern EuropeEcuadorEgyptEl SalvadorEnglandEthiopiaEuropeFranceGermanyGreeceGuatemalaHaitiHondurasHong KongHungaryIndiaIndonesiaIranIrelandIsraelItalyJamaicaJapanKenyaKoreaKuwaitLatin AmericaLebanonLithuaniaMalaysiaMexicoMicronesiaMiddle AfricaNetherlandsNicaraguaNigeriaNorthern AfricaNorthern EuropeNorwayOceaniaPakistanPanamaPeruPhilippinesPolandPortugalRomaniaRussiaSaudi ArabiaScotlandSerbiaSingaporeSouth AfricaSouth AmericaSouth Central AsiaSouth Eastern AsiaSouthern EuropeSpainSwitzerlandSyriaTaiwanThailandTrinidad and TobagoUkraineVenezuelaVietnamWestern AfricaWestern AsiaWestern Europe
Income
Income (Families)
Income (Households)
Poverty
Poverty (Families)
Unemployment
Employment Occupations
Employment Industries
Employer Class
Commute Time
Commute Means
School Enrollment
Education by Degree Field
Occupancy
Finances
Physical Characteristics
Reno
Compare Zip Codes
Comparison Subject

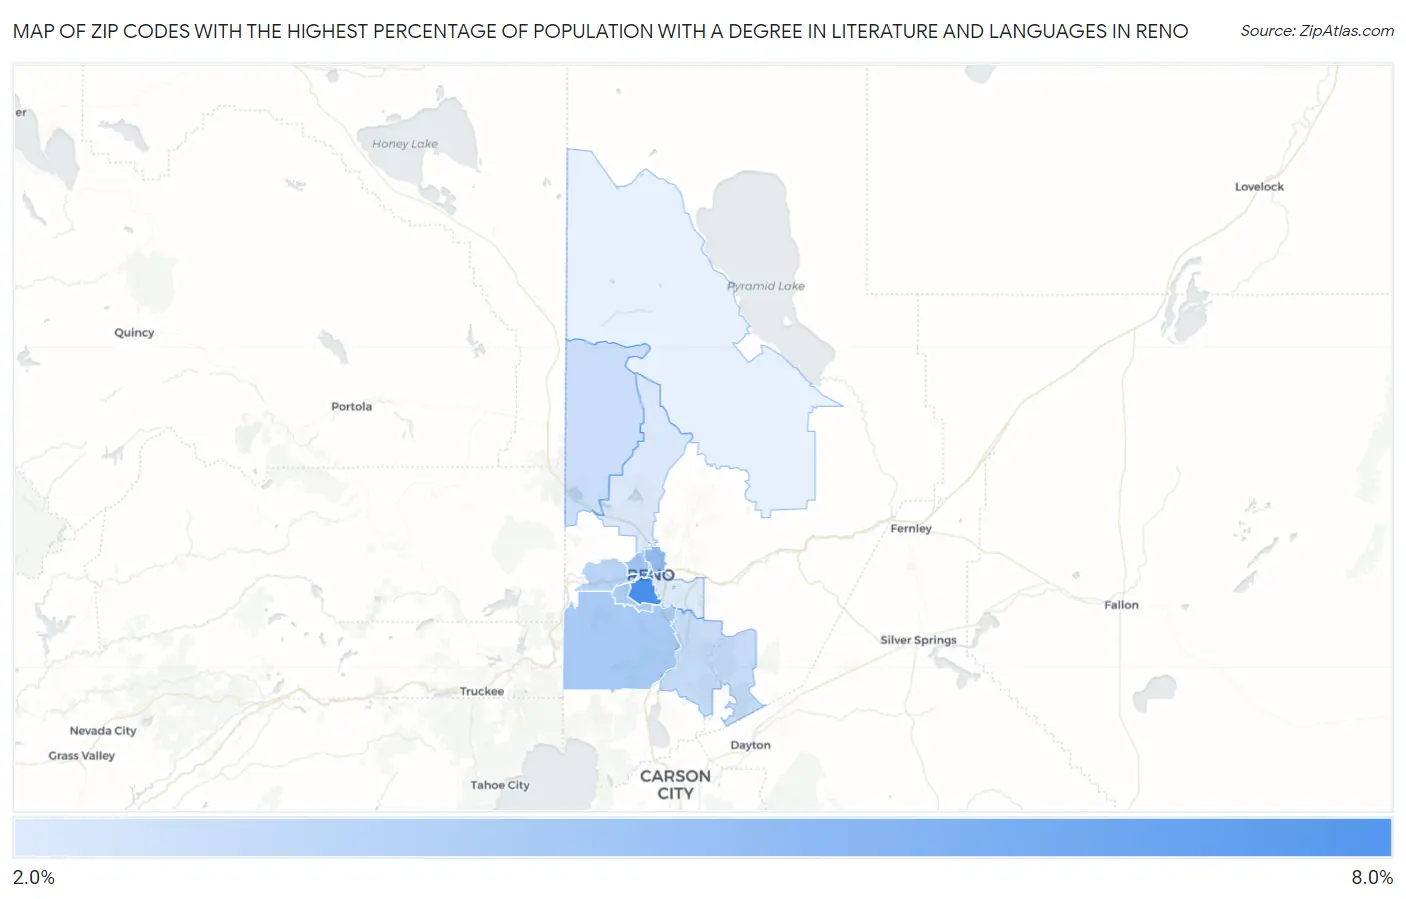
Map of Zip Codes with the Highest Percentage of Population with a Degree in Literature and Languages in Reno

0.0%
8.0%
Zip Codes with the Highest Percentage of Population with a Degree in Literature and Languages in Reno Map

Zip Codes with the Highest Percentage of Population with a Degree in Literature and Languages in Reno, NV

Zip Code % Graduates vs State vs National
1.895097.5%3.5%(+4.02)#74.4%(+3.07)#3,461
2.895015.3%3.5%(+1.84)#134.4%(+0.898)#6,708
3.895125.2%3.5%(+1.72)#144.4%(+0.780)#6,970
4.895034.7%3.5%(+1.22)#204.4%(+0.274)#8,202
5.895114.5%3.5%(+1.05)#214.4%(+0.111)#8,664
6.895194.4%3.5%(+0.951)#244.4%(+0.007)#8,952
7.895234.0%3.5%(+0.538)#374.4%(-0.406)#10,161
8.895213.6%3.5%(+0.154)#504.4%(-0.790)#11,426
9.895083.5%3.5%(+0.059)#544.4%(-0.885)#11,772
10.895063.0%3.5%(-0.468)#684.4%(-1.41)#13,589
11.895022.9%3.5%(-0.524)#704.4%(-1.47)#13,755

Common Questions

What are the Top 10 Zip Codes with the Highest Percentage of Population with a Degree in Literature and Languages in Reno, NV?
Top 10 Zip Codes with the Highest Percentage of Population with a Degree in Literature and Languages in Reno, NV are:
#1
7.5%
#2
5.3%
#3
5.2%
#4
4.7%
#5
4.5%
#6
4.4%
#7
4.0%
#8
3.6%
#9
3.5%
#10
3.0%
What zip code has the Highest Percentage of Population with a Degree in Literature and Languages in Reno, NV?
89509 has the Highest Percentage of Population with a Degree in Literature and Languages in Reno, NV with 7.5%.
What is the Percentage of Population with a Degree in Literature and Languages in Reno, NV?
Percentage of Population with a Degree in Literature and Languages in Reno is 4.7%.
What is the Percentage of Population with a Degree in Literature and Languages in Nevada?
Percentage of Population with a Degree in Literature and Languages in Nevada is 3.5%.
What is the Percentage of Population with a Degree in Literature and Languages in the United States?
Percentage of Population with a Degree in Literature and Languages in the United States is 4.4%.