Zip Codes with the Highest Percentage of Immigrants from Eastern Asia in Nashua, NH
RELATED REPORTS & OPTIONS
Eastern Asia
Nashua
Compare Zip Codes
Map of Zip Codes with the Highest Percentage of Immigrants from Eastern Asia in Nashua
0.85%
1.40%
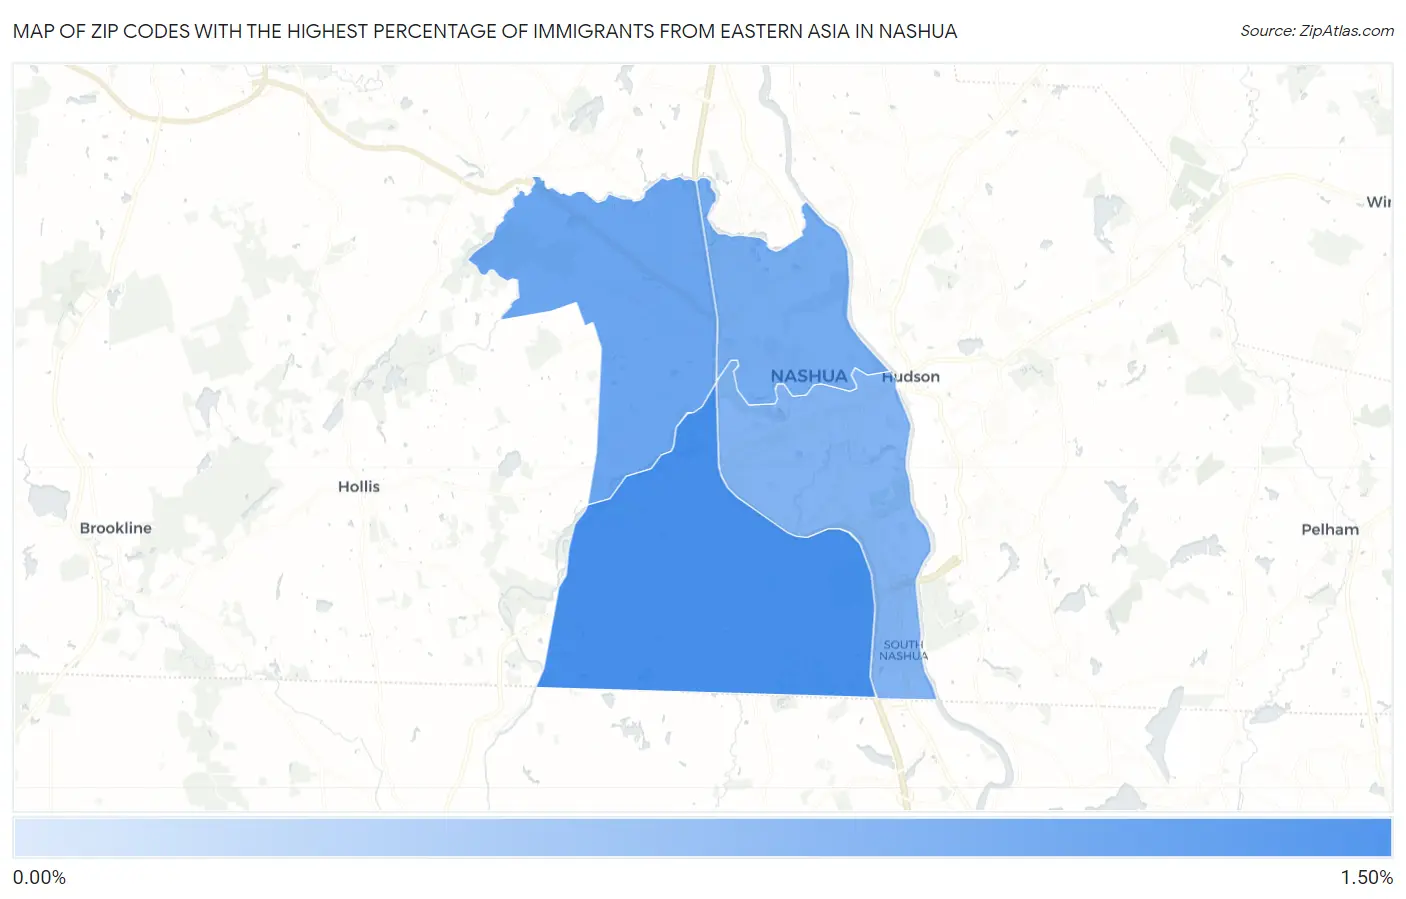
Zip Codes with the Highest Percentage of Immigrants from Eastern Asia in Nashua, NH
| Zip Code | Eastern Asia | vs State | vs National | |
| 1. | 03062 | 1.40% | 0.57% (+0.832)#23 | 1.28% (+0.124)#2,863 |
| 2. | 03063 | 1.05% | 0.57% (+0.486)#32 | 1.28% (-0.222)#3,718 |
| 3. | 03064 | 0.97% | 0.57% (+0.400)#35 | 1.28% (-0.308)#4,010 |
| 4. | 03060 | 0.85% | 0.57% (+0.281)#39 | 1.28% (-0.427)#4,462 |
1
Common Questions
What are the Top 3 Zip Codes with the Highest Percentage of Immigrants from Eastern Asia in Nashua, NH?
Top 3 Zip Codes with the Highest Percentage of Immigrants from Eastern Asia in Nashua, NH are:
What zip code has the Highest Percentage of Immigrants from Eastern Asia in Nashua, NH?
03062 has the Highest Percentage of Immigrants from Eastern Asia in Nashua, NH with 1.40%.
What is the Percentage of Immigrants from Eastern Asia in Nashua, NH?
Percentage of Immigrants from Eastern Asia in Nashua is 1.08%.
What is the Percentage of Immigrants from Eastern Asia in New Hampshire?
Percentage of Immigrants from Eastern Asia in New Hampshire is 0.57%.
What is the Percentage of Immigrants from Eastern Asia in the United States?
Percentage of Immigrants from Eastern Asia in the United States is 1.28%.