Zip Codes with the Highest Percentage of Population Employed in Life, Physical & Social Science in Nashua, NH
RELATED REPORTS & OPTIONS
Life, Physical & Social Science
Nashua
Compare Zip Codes
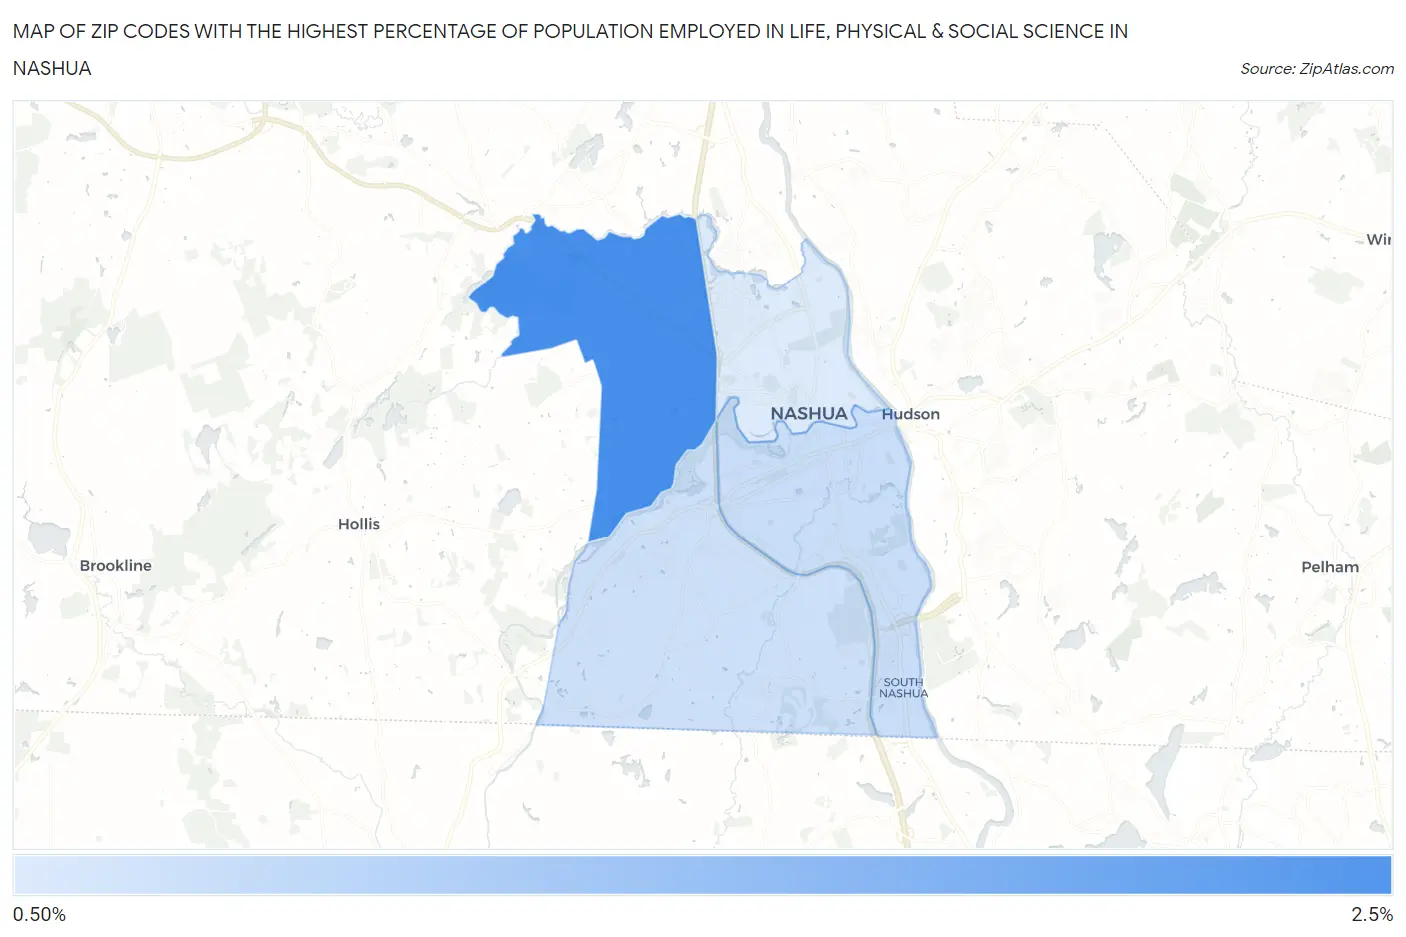
Map of Zip Codes with the Highest Percentage of Population Employed in Life, Physical & Social Science in Nashua
0.77%
2.0%
Zip Codes with the Highest Percentage of Population Employed in Life, Physical & Social Science in Nashua, NH
| Zip Code | % Employed | vs State | vs National | |
| 1. | 03063 | 2.0% | 1.1%(+0.875)#44 | 1.1%(+0.920)#3,655 |
| 2. | 03060 | 0.93% | 1.1%(-0.202)#94 | 1.1%(-0.156)#9,614 |
| 3. | 03062 | 0.90% | 1.1%(-0.239)#98 | 1.1%(-0.194)#10,000 |
| 4. | 03064 | 0.77% | 1.1%(-0.365)#110 | 1.1%(-0.320)#11,298 |
1
Common Questions
What are the Top 3 Zip Codes with the Highest Percentage of Population Employed in Life, Physical & Social Science in Nashua, NH?
Top 3 Zip Codes with the Highest Percentage of Population Employed in Life, Physical & Social Science in Nashua, NH are:
What zip code has the Highest Percentage of Population Employed in Life, Physical & Social Science in Nashua, NH?
03063 has the Highest Percentage of Population Employed in Life, Physical & Social Science in Nashua, NH with 2.0%.
What is the Percentage of Population Employed in Life, Physical & Social Science in Nashua, NH?
Percentage of Population Employed in Life, Physical & Social Science in Nashua is 1.1%.
What is the Percentage of Population Employed in Life, Physical & Social Science in New Hampshire?
Percentage of Population Employed in Life, Physical & Social Science in New Hampshire is 1.1%.
What is the Percentage of Population Employed in Life, Physical & Social Science in the United States?
Percentage of Population Employed in Life, Physical & Social Science in the United States is 1.1%.